


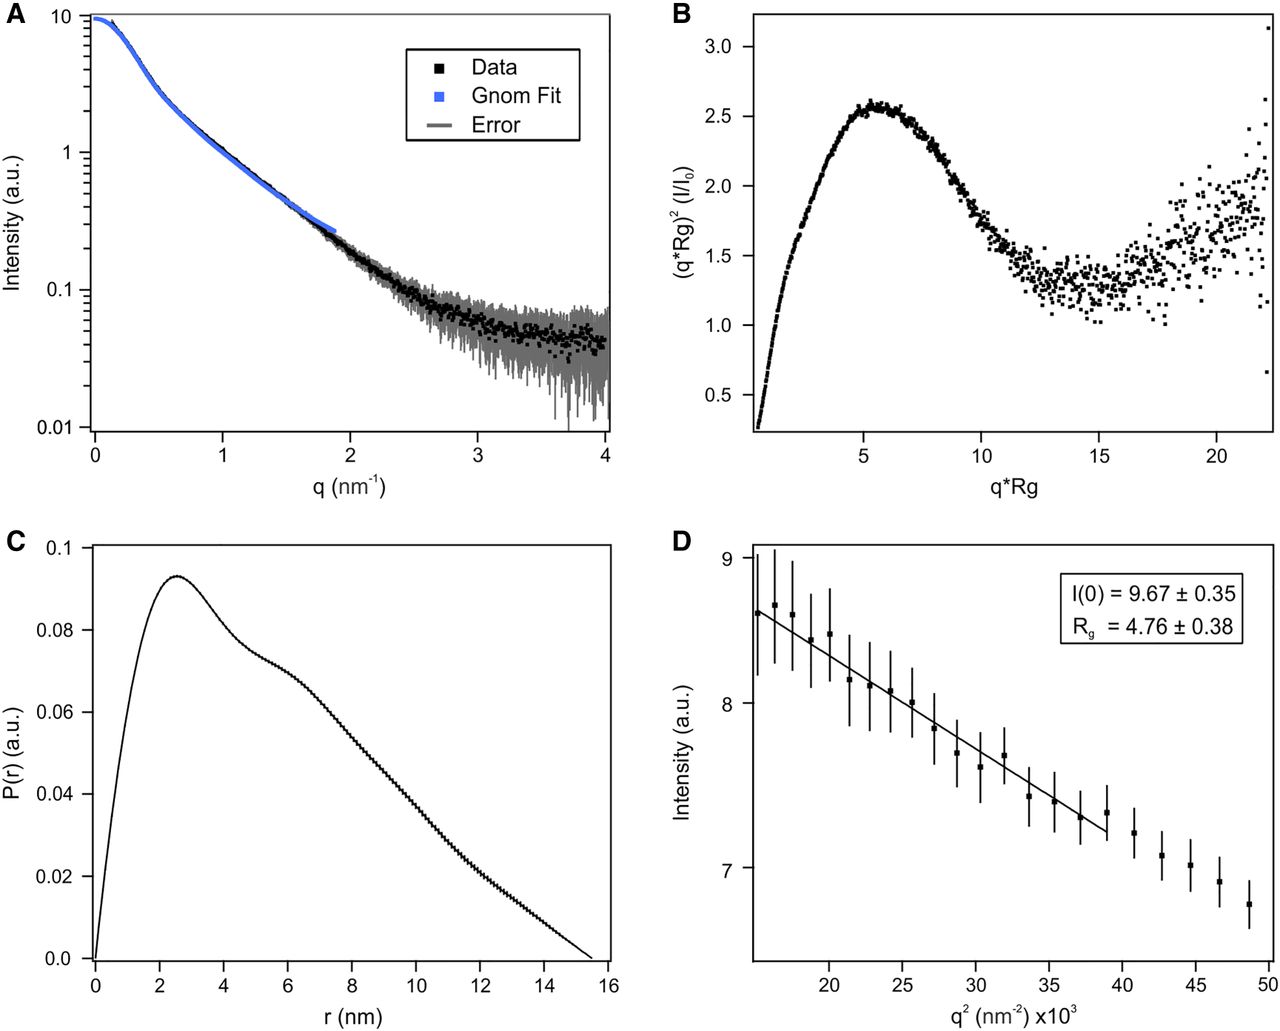
FIGURE 6.
SAXS results of OxyS. Experimental SAXS data is in black, error bars in gray, and linear fit in blue. (A) log(I) versus q plot. (B) Kratky plot. (C) P(r) distribution. (D) Guinier plot with linear regression. The intensity scale is logarithmic.




