


Novel mRNAs 3′ end-associated cis-regulatory elements with epigenomic signatures of mammalian enhancers in the Arabidopsis genome
- Mycological Research Center, College of Life Sciences, Fujian Agriculture and Forestry University, Fuzhou, 350002, Fujian, China
- Corresponding author: chekanovaj{at}gmail.com, chekanovaj{at}fafu.edu.cn
Abstract
The precise spatial and temporal control of gene expression requires the coordinated action of genomic cis-regulatory elements (CREs), including transcriptional enhancers. However, our knowledge of enhancers in plants remains rudimentary and only a few plant enhancers have been experimentally defined. Here, we screened the Arabidopsis thaliana genome and identified >1900 unique candidate CREs that carry the genomic signatures of mammalian enhancers. These were termed putative enhancer-like elements (PEs). Nearly all PEs are intragenic and, unexpectedly, most associate with the 3′ ends of protein-coding genes. PEs are hotspots for transcription factor binding and harbor motifs resembling cleavage/polyadenylation signals, potentially coupling 3′ end processing to the transcriptional regulation of other genes. Hi-C data showed that 24% of PEs are located at regions that can interact intrachromosomally with other protein-coding genes and, surprisingly, many of these target genes interact with PEs through their 3′ UTRs. Examination of the genomes of 1135 sequenced Arabidopsis accessions showed that PEs are conserved. Our findings suggest that the identified PEs may serve as transcriptional enhancers and sites for mRNA 3′ end processing, and constitute a novel group of CREs in Arabidopsis.
Keywords
- transcriptional enhancers
- plant transcriptional enhancers
- cis-regulatory elements (CREs)
- mRNA 3′ end processing
- chromatin
INTRODUCTION
The regulation of eukaryotic transcription involves multiple trans-acting factors, such as RNA polymerase II (Pol II) and transcription factors (TFs). These act on cis-regulatory DNA elements (CREs), such as promoters and enhancers, working together with chromatin structure, which regulates the accessibility of the cis-regulatory elements (CREs) to polymerases and TFs (Fig. 1A; Wittkopp and Kalay 2011; Shlyueva et al. 2014). Most of our current information about enhancers and their functions comes from studies in metazoans. Enhancers can be located in intra- or intergenic regions (Heintzman et al. 2007; Kim et al. 2010; ENCODE Project Consortium et al. 2012; Arnold et al. 2013) and function as platforms for TF binding, containing clustered binding sites for multiple TFs (Spitz and Furlong 2012). Enhancers bring important accessory factors near their target promoters to initiate and/or sustain transcription via the formation of chromatin loops and lead to changes in genome architecture.
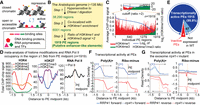
The putative enhancer-like elements (PEs) in Arabidopsis carry canonical epigenomic signatures of mammalian enhancers. (A) Open and closed chromatin structures. (B) PEs identified by enrichment of H3K4me1 and an H3K4me1/me3 ratio of >2, centered on DNase I hypersensitive sites. (C) Signal intensity of H3K4me1 and me3 at the identified PEs (n = 1919). The hidden Markov model (HMM) posterior probability scores of mono and trimethylation of H3K4, which represent the signal intensities per specific histone modification, were tabulated for each of these 6001 DNase I hypersensitive sites (DHSs). Red and green bars correspond to H3K4me1 and H3K4me3, respectively; the blue line corresponds to the log2 of the ratio of H3K4me1/me3. The small graph at the top shows the H3K4me1 and H3K4me3 signals in all 6001 regions before applying the H3K4me1/me3 threshold (step 3). (D) Meta-analysis of the chromatin signatures and Pol II occupancy in the region flanking the PE midpoints (orange dotted line). From left to right: the distribution of H3K4 methylation (mono-, di-, and tri-), acetylation and trimethylation of H3K27, and Pol II occupancy. The y-axis shows the signal intensity from ChIP-chip data; the x-axis depicts the distance ±1.5 kb from PE midpoints. (E) Pie diagram illustrating the transcriptionally active and inactive PEs based on RNA-seq. PEs were considered expressed if the entire genomic region had at least 1 normalized read per ten million (>1 RPTM; P < 0.0001). (F,G) Meta-gene like plots showing the transcriptional activity as reads density (RPTM × 104) in PE regions. The poly(A)+ and ribo-minus RNA expression are shown independently for the top (blue, forward [+]) and bottom (red, reverse [−]) strands. (F) Transcriptional activity in the PE regions in wild-type (WT); (G) transcriptional activity in the PE regions in WT (solid) and the exosome-deficient lines (dashed line).
Recent studies in animals have annotated enhancers genome-wide by profiling epigenomic features (Heintzman et al. 2007; ENCODE Project Consortium et al. 2012; Arnold et al. 2013; Andersson et al. 2014). Although various groups of cell-type-specific enhancers could be associated with different chromatin states, the general epigenomic characteristics of canonical metazoan enhancers include nucleosome depletion, specific histone modification patterns, binding of TFs, and the ability to form chromatin loops (Heintzman et al. 2007; Spitz and Furlong 2012; Calo and Wysocka 2013; Core et al. 2014; Shlyueva et al. 2014). High-throughput studies have also demonstrated widespread transcription from metazoan enhancers, which produces RNA exosome-sensitive enhancer RNAs (eRNAs) that are implicated in enhancer function (Kim et al. 2010; Andersson et al. 2014; Pefanis et al. 2015; Li et al. 2016). Enhancers are marked by specific histone modifications, and H3K4me1 was among the first chromatin signatures found to be distinctively enriched at enhancers genome-wide (Heintzman et al. 2007; Calo and Wysocka 2013). Since then, different histone marks were shown to be associated with different groups of enhancers, including H3K9ac and H3K18ac (Ernst et al. 2011; Zentner et al. 2011), H3K79me2/3 (Bonn et al. 2012; Djebali et al. 2012), H3.3 (Deaton et al. 2016), and others (Calo and Wysocka 2013).
Metazoan enhancers share many epigenetic features with promoters; for example, both acquire H3K27ac upon activation, but a high H3K4me1/H3K4me3 ratio distinguishes enhancers from promoters (Heintzman et al. 2007; Calo and Wysocka 2013). Moreover, H3K4me1 marks bona fide canonical enhancers, including active and poised (predetermined) enhancers, which wait in the genome for the right time to be activated (Creyghton et al. 2010; Rada-Iglesias et al. 2011; Zentner et al. 2011; Calo and Wysocka 2013). Additionally, H3K4me1 deposition and nucleosome depletion typically precede the deposition of H3K27ac, which marks active enhancers and is commonly used as a benchmark to identify active enhancers. Despite these advances, our understanding of the mechanisms of enhancer action remains incomplete, particularly for intragenic enhancers, even though more than half of identified metazoan enhancers lie within gene bodies (Heintzman et al. 2007; Kim et al. 2010; ENCODE Project Consortium et al. 2012; Kowalczyk et al. 2012; Arnold et al. 2013).
In plants, only a few functional enhancers have been identified experimentally and only five enhancers have been extensively experimentally characterized in Arabidopsis (Weber et al. 2016). The best-characterized enhancer in Arabidopsis is the egg apparatus-specific enhancer (EASE) (Yang et al. 2005), an intergenic enhancer with an experimentally identified functional 77-bp enhancer sequence that can work independently of position and orientation. We also determined here that Arabidopsis EASE is enriched for H3K4me1 compared to H3K4me3, similar to the canonical chromatin signatures of metazoan enhancers. Recent data found in Arabidopsis, pea, and maize also suggests that some plant enhancers may exhibit chromatin features similar to those of animals (Chua et al. 2003; Zhu et al. 2015; Weber et al. 2016; Oka et al. 2017). Enhancer trapping has been used to identify individual functional enhancers prior to the genome-wide high-throughput era (Weber et al. 2016). However, only a few enhancers, such as EASE, have been identified using this method, due to the labor intensive nature of this methodology.
Genome-wide approaches for enhancer identification have only recently been applied to plants, and these studies have specifically focused on intergenic regions. For example, over 10,000 Arabidopsis putative intergenic enhancer candidates were predicted based on DNase I hypersensitive sites (DHSs) in intergenic regions away from known transcription start sites (TSSs) (Zhu et al. 2015; Hetzel et al. 2016). These studies considered H3K27ac and H3K27me3; however, they did not consider the H3K4 methylation status and potentially missed other groups of enhancers with different chromatin signatures. A recent study in maize predicted approximately 1500 candidate enhancers in intergenic regions that exhibit low DNA methylation, DNase I hypersensitivity, and high H3K9ac; this pool of candidate enhancers includes three previously characterized maize enhancers (Oka et al. 2017). These studies have just begun to provide the first genome-wide glance at candidate transcriptional enhancers in plants. Additionally, a recent report used assay for transposase-accessible chromatin using sequencing (ATAC-seq) to identify accessible chromatin regions in the root tips of Arabidopsis, rice, alfalfa and tomato (Maher et al. 2018); these accessible regions harbor binding sites of TFs and thus represent regulatory regions that may be transcriptional enhancers. However, the chromatin signatures and potential of these regions functioning as transcriptional enhancers have not been investigated yet.
Therefore, more work is needed to determine the specific subset of chromatin modifications, and the genomic and functional requirements associated with transcriptional enhancers genome-wide in plants. Moreover, these studies have specifically focused on intergenic regions. No intragenic enhancers have been reported in plants and the genome-wide chromatin signatures of plant enhancers remain largely unknown.
Here, to identify and predict Arabidopsis PEs genome-wide, we derived stringent criteria based on the canonical chromatin signatures of metazoan transcriptional enhancers. The finding that the EASE enhancer carries the canonical metazoan chromatin signatures suggested that these chromatin characteristics could be used as a benchmark to identify putative enhancers in Arabidopsis. To provide a comprehensive genomic characterization, we analyzed the chromatin landscape, Pol II occupancy, TF binding, polyadenylated and nonpolyadenylated transcriptomes (using exosome-deficient lines to capture unstable transcripts), and analyzed Hi-C data sets. This analysis identified >1900 unique genomic regions that we termed PEs. Based on the Hi-C data, many PEs participate in chromatin looping. Most PEs are intragenic, and associate with 3′ end processing sites of the genes housing them. PEs are also conserved in 1135 Arabidopsis accessions. Together, our data suggest that PEs could be a unique group of CREs, which may serve dual purposes in Arabidopsis, potentially acting as 3′ end processing sites and transcriptional enhancers.
RESULTS
Genome-wide identification of putative enhancer-like elements in Arabidopsis
Transcriptional enhancers activate gene expression independent of orientation and distance. Due to the scarcity of knowledge on plant transcriptional enhancers, we based our criteria on (i) information known about metazoan enhancers and (ii) our analysis on the well experimentally characterized EASE enhancer in Arabidopsis. We then used these criteria to isolate genomic regions that carry these canonical chromatin signatures from data sets produced from Arabidopsis seedling of similar ages and conditions (schematic in Fig. 1B and details in SI Text). We first examined the sites of nucleosome depletion in the Arabidopsis genome. To assess the nucleosome-free regions, 38,290 DNase I hypersensitive sites (DHSs) were extracted from DNase-seq data set (Zhang et al. 2012) for young Arabidopsis seedlings (Fig. 1B, step 1).
Open chromatin regions are also marked by specific histone modifications, including H3K4 methylation. Monomethylation on H3K4 generally marks bona fide canonical enhancers in metazoans, although different chromatin signatures exist in metazoans; additionally, poised enhancers are marked by H3K4me1 before they acquire the proper H3K27 marks (Heintzman et al. 2007; Ernst et al. 2011; Zentner et al. 2011; Bonn et al. 2012; Djebali et al. 2012; Calo and Wysocka 2013; Shlyueva et al. 2014; Deaton et al. 2016). Recent data in Arabidopsis, pea, and maize showed a positive correlation between active enhancers and H3/H4 acetylation, and a correlation between inactive enhancers and H3K27me3, in agreement with the chromatin signatures of metazoan enhancers, suggesting that some plant enhancers may exhibit chromatin features similar to those of animals (Weber et al. 2016). Additionally, using data sets from chromatin immunoprecipitation-microarray (ChIP-chip) experiments on Arabidopsis seedlings (Zhang et al. 2007; Charron et al. 2009; Chodavarapu et al. 2010), we determined that the experimentally characterized Arabidopsis EASE (Yang et al. 2005) and its neighboring chromatin are enriched for H3K4me1 compared to H3K4me3 (Fig. 5A; P < 0.05; see below for more for details). This result further indicates that H3K4me1 is informative for the identification of putative enhancers in Arabidopsis. In other species, more than 50% of potential enhancers were predicted to be outside of intergenic regions (Heintzman et al. 2007; Kim et al. 2010; ENCODE Project Consortium et al. 2012; Kowalczyk et al. 2012; Arnold et al. 2013). Since H3K4me1 is found predominantly in the gene body of less than one-third of all protein-coding genes in Arabidopsis (Supplemental Fig. S1A; Zhang et al. 2009), the use of H3K4me1 enrichment as an enhancer signature also allows to examine all DHSs genome-wide. Therefore, we next set out to isolate DHSs that colocalize with H3K4me1 enrichment, using H3K4me1 ChIP-chip data sets from the high-density whole-genome tiling microarray for young Arabidopsis seedlings (Zhang et al. 2009). We found that 6001 (P < 0.0001, Bedtools Fisher's exact test was used to test the statistical significance of data associations with a set of randomized control) DHSs colocalized with areas enriched for H3K4me1 (Fig. 1B, step 2).
Since the vast majority of TF binding sites are located in the vicinity of promoters, we had to discriminate against promoters, which are typically marked with H3K4me3 (as observed in metazoans and Arabidopsis) (Zhang et al. 2009; Spitz and Furlong 2012; Calo and Wysocka 2013; Shlyueva et al. 2014). To discriminate between enhancers and promoters, we set a threshold for the ratio of mono- and trimethylation of H3K4 of >2 (Fig. 1B,C; HMM posterior probability scores represent the signal intensities per specific histone modification) using H3K4me1 and H3K4me3 ChIP-chip data sets for young Arabidopsis seedlings (Zhang et al. 2009). This analysis yielded 1919 regions with the canonical signatures of mammalian enhancers and EASE (Fig. 1B, step 3). These 1919 regions, which varied in size, could harbor the candidates for PEs in the Arabidopsis genome. We also found that 65% of these regions (n = 1249, P < 0.0001) overlap with the nucleosome-free regions identified by ATAC-seq in root tissues by Maher et al. (2018).
To uniformly analyze the 1919 regions, further explore their genomic features, and consider the nucleosomes up- or downstream from the DHS, we first added 1.5-kb up- and downstream from the DHS midpoints converting each DHS into a 3-kb region. We termed these 3-kb regions PEs and the center of the DHS the PE midpoint (Fig. 1; Supplemental Dataset S1).
PEs are highly H3K27 acetylated, bound by Pol II, and transcribed
Metagene analysis was used to profile the distribution of chromatin modifications across PE regions. Analysis of mono-, di-, and trimethylated H3K4 (Zhang et al. 2009) in the PE regions revealed patterns very similar to those reported for mammalian enhancers (Heintzman et al. 2007; Kim et al. 2010; Calo and Wysocka 2013; Shlyueva et al. 2014): a significant enrichment of H3K4me1, very low H3K4me3, and no fluctuations in H3K4me2 throughout the PE region (Fig. 1D; Supplemental Fig. S2). Notably, examination of H3K27 (Zhang et al. 2007; Charron et al. 2009), which can distinguish between active and poised enhancers (Calo and Wysocka 2013; Shlyueva et al. 2014), revealed that PEs have high H3K27ac and little H3K27me3 (Fig. 1D; Supplemental Fig. S2), suggesting that PEs could be active enhancers.
Recent studies showed that active enhancers are transcribed in mammals (Kim et al. 2010; Li et al. 2016). In accord, using a Pol II ChIP-chip data set for young Arabidopsis seedlings (Chodavarapu et al. 2010), we found widespread Pol II occupancy throughout the entire PE region (Fig. 1D; Supplemental Fig. S2), peaking around the PE midpoints. Given that plants have two additional plant-specific RNA polymerases, Pol IV and V, we confirmed that very few PE regions overlap with Pol IV/Pol V-associated loci, suggesting that Pol IV/V are not responsible in transcribing PEs (Wierzbicki et al. 2012; Law et al. 2013) (details in SI Text). All together, the epigenomic profiles of PEs replicate the canonical signatures of mammalian enhancers and a well experimentally characterized Arabidopsis enhancer EASE, and also indicated that PEs may represent active enhancer-like elements in Arabidopsis.
To examine transcriptional activity in PE regions, we profiled RNA expression in WT seedlings. To determine whether transcripts in PE regions are exosome-sensitive, we compared the RNA expression profile in WT with the RNA expression profile in inducible RNAi lines of the RNA exosome core complex subunit RRP41 (rrp41-i). Since eRNAs can vary in length and polyadenylation status and are transcribed uni- or bidirectionally (Li et al. 2016), we sequenced polyadenylated RNAs [poly(A)+] and ribo-minus RNAs depleted of rRNAs to increase our detection of nonpolyadenylated RNAs (Supplemental Dataset S2). Our metagene analysis of the regions ±1.5 kb from the PE midpoint in all RNA-seq data sets found that 99.8% (P < 0.0001, χ2 test) of PEs are transcribed in both directions (Fig. 1E,F; Supplemental Fig. S2). The transcriptional profile of poly(A)+ and ribo-minus RNA around PE midpoints appears very different from typical bidirectional transcription from TSSs of metazoan protein-coding genes (Andersson et al. 2015). Instead, the peaks of transcriptional activity appear upstream of PEs on both DNA strands and end near the PE midpoint (Fig. 1F).
In examining the effect of the RNA exosome, we found small but discernable differences in RNA abundance in the rrp41-i mutant lines compared to the WT (Fig. 1G), and this difference was particularly pronounced for the ribo-minus RNAs (Fig. 1G, right panel). Of the PEs, 207 express polyadenylated RNAs affected by depletion of the exosome subunit RRP41, with 67 PEs exclusively expressed only in rrp41-i (Fig. 1E; Supplemental Fig. S3; Supplemental Dataset S3; details in SI Text).
PEs are hotspots for TF binding and binding sites specifically cluster around the PE midpoints
Enhancers serve as cis-regulatory modules providing a platform for TF binding (Spitz and Furlong 2012; Core et al. 2014). To examine the occurrence of TF binding motifs in PEs, we extracted the binding motifs of >1700 experimentally characterized TFs and >50 TF families from the Arabidopsis regulatory information server (AGRIS) (Yilmaz et al. 2011). The presence of these known TF motifs were scanned using find individual motif occurrences (FIMO) (Grant et al. 2011) on both strands of each PE region, and only the statistically significant motif occurrences were subjected to further analysis (statistical threshold, P < 0.0001). Metagene analysis revealed significant enrichment of TF binding motifs in PE regions preferentially clustered in the vicinity of PE midpoints (Fig. 2A), as would be expected for transcriptional enhancers. Based on scanning for the presence of their motifs with a statistical threshold of P < 0.0001, MADs-box, MYB, HSF, HB, and bZIP TFs were the most prevalent families of TFs with binding sites in the PE regions (Fig. 2B), suggesting that PEs could be bound by a wide range of TFs.
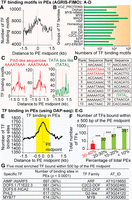
PEs are hotspots for TF binding and binding sites specifically cluster around PE midpoints. Panels (A–D) show the distribution of known TF binding motifs in PE regions. The experimentally characterized TF motifs were extracted from the AGRIS database and their occurrences in PE regions were determined with MEME-FIMO (P < 0.0001). Panels (E–G) show the experimentally identified binding of TFs at PE regions. The peaks of TF binding at PE regions were extracted from DAP-seq data sets (A) Distribution of all TF motifs in identified PEs. (B) Abundance of different TF families with binding motifs at PEs, shown as a total number of binding motifs present in the PE region for each TF family. (C) Distribution of specific TF motifs bearing PAS-like (in red) and TATA-box like (in green) sequences in PE regions. (D) The top 20 most frequent TF binding motifs identified in the PE regions; their distribution is shown in Supplemental Figure S4. (E) Distribution of TF binding sites in the identified PEs. The peak enrichment of TF binding was observed close to the PE midpoints (orange dotted line), defined as PE midpoint-proximal region, ±500 nt flanking the PE midpoint (in yellow). (F) Numbers of TFs binding in PE midpoint-proximal regions (***) P < 0.0001. The five specific TFs represented by the red bar bind at a total of >600 PEs (30%–40% of total PEs); and (G) their information (P < 0.0001, Bedtools Fisher's exact test).
Surprisingly, the most enriched motifs near PE midpoints included polyadenylation sequence (PAS)-like motifs (Fig. 2C,D). Moreover, most of the TF motifs are A-rich, closely resembling PASs and the sequences located at the 3′ ends of protein-coding genes (Fig. 2D; Supplemental Fig. S4). Additionally, our analysis of TF binding motif occurrences showed that the PAS-like motifs (AAAATAAA and AAATAAAA) present in the majority of PE regions (76%; P < 0.0001, χ2 test) are bound by the Arabidopsis TF BELLRINGER (BLR), which belongs to the conserved eukaryotic Homeobox TF family. BLR has been shown to function as repressor of AGAMOUS (AG) by binding to AG CREs located in a 3-kb intronic region (Bao et al. 2004). A total of 1460 PEs have at least one BLR-binding-PAS-like motif (76%; P < 0.0001, χ2 test) and the majority of these PEs harbor more than one motif (n = 1083). The homeobox TF family includes a wide range of well-conserved eukaryotic TFs; specifically, one specific homeobox TF, NANOG, was shown to bind and activate primed enhancers in mice to promote the pluripotent state in mouse embryonic stem cells (Murakami et al. 2016). The Uniport sequence search was used to examine whether BLR shares sequence similarity to any proteins involved in enhancer binding. BLR shared significant, high sequence similarity with the homeobox protein Meis1 in human (e = 3 × 10⁻¹³) and mice (e = 2 × 10⁻¹³), and Pknox1 in human (e = 4 × 10⁻¹³) and mice (e = 3 × 10⁻¹³). Pknox1 and Meis I bind to the Hoxb2 enhancer and mediate Hoxb2 hindbrain enhancer activity (Jacobs et al. 1999). Additionally, Meis1 is a homolog of homothorax (hth) in Drosophila, which (in complex with other TFs) can function as a molecular switch in regulating rho CREs (enhancers) that are essential for Drosophila peripheral nervous system (PNS) development (Li-Kroeger et al. 2008).
To identify how TF binding sites clustered in PEs, we extracted peaks of TF binding in PE regions from DNA affinity purification sequencing (O'Malley et al. 2016) (DAP-seq) data sets (P < 0.0001, Fisher's exact test was used to test the statistical significance of data associations with a set of randomized control) and subjected them to metagene analysis (Supplemental Datasets S4, S5). The Cistrome project produced a genome-wide catalog of the binding peaks for 1812 TFs (composing 80 TF families) in Arabidopsis using DAP-seq (O'Malley et al. 2016), and 529 (30%) of these Arabidopsis TFs were further analyzed for their binding peaks and motifs. Similar to the results from mapping of TF motifs (Fig. 2A), we found TF binding peaked in the region close to the PE midpoints (Fig. 2E).
To determine which specific groups of TFs bind near PE midpoints, we restricted the analysis window to the PE midpoint-proximal region (yellow area in Fig. 2E), ±500 nt of the PE midpoints. We then analyzed all TF binding peaks determined by DAP-seq in the midpoint-proximal region of 1919 PEs (Supplemental Dataset S6). The TFs with binding sites within ±500 nt of PE midpoints can be subdivided into two groups, depending on the number of PE regions they bound (P < 0.0001, χ2 test). The first group included a wide variety of TFs, but each TF bound to only a few PEs (Fig. 2F, green bars). For example, 391 different TFs bind to <10% of all PEs (Fig. 2F, green bar at far right). The second group comprised only five TFs (Fig. 2F, red bar; Fig. 2G), but these TFs bind a large number of >600 PEs (30%–40% of total PEs).
TF binding motifs in the midpoint-proximal regions are distinct from general consensus binding motifs
We further analyzed the five specific TFs that bind the most PEs (Fig. 2G). A study that analyzed the TF motifs in ATAC-seq also implicated one of these five TFs, MYB77, in coregulation of common gene sets in root tips across four different plant species (Maher et al. 2018). We first examined the binding profile of these five TFs and the distribution of their binding sites over the PE regions individually (Supplemental Fig. S5A–E, panel i; Supplemental Dataset S7). We found that binding sites for these TFs (with the exception of the G2-like TF) are highly enriched at the midpoint-proximal regions, with a sharp binding peak around the midpoint. We then extracted the binding sites for each of these five TFs from the entire 3-kb PE region and the 1-kb midpoint-proximal regions and subjected them to motif discovery analysis separately to identify the three most enriched binding motifs in these regions (E-value ≤0.05, MEME-ChIP [Machanick and Bailey 2011]). The motifs determined from TF binding sites across the entire 3-kb region closely resembled the consensus motifs determined by interrogating all peaks of TF binding genome-wide by O'Malley et al. (2016) (Supplemental Fig. S6). In contrast, the motifs from TF binding sites within midpoint-proximal regions are extremely AT-rich and tend to cluster preferentially around PE midpoints (Supplemental Fig. S5A–E, panel ii; Supplemental Dataset S7). The difference between the motifs from the PE midpoint-proximal regions and the general consensus sequences suggests that midpoint-proximal regions might be bound by TFs through a distinct set of binding motifs.
Spatial relationship between PEs and the TSSs and TESs of protein-coding genes
Metazoan enhancers occur in inter- or intragenic regions across the genome (Heintzman et al. 2007; Kim et al. 2010; ENCODE Project Consortium et al. 2012; Kowalczyk et al. 2012; Arnold et al. 2013). To characterize the genomic locations of the PEs, we mapped the PE regions on all Arabidopsis chromosomes and found that PEs are distributed across euchromatic regions on all chromosomes, but are notably absent from centromeric regions (Supplemental Fig. S7). Examination of PE positions relative to annotated genes showed that nearly all PEs (99%, P < 0.0001, Fisher's exact test was used to test the statistical significance of data associations with a set of randomized control) overlap with protein-coding gene units and are thus intragenic PEs (Fig. 3A; Supplemental Datasets S8, S9; P < 0.0001, χ2 test). Only 21 PEs (1%) were located between protein-coding genes. Therefore, in contrast to the previously identified intergenic enhancer candidates (Zhu et al. 2015; Hetzel et al. 2016), 99% of the putative enhancers-like elements (PEs) identified here are intragenic.
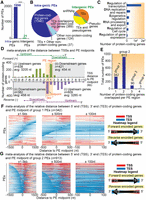
Genomic architecture of the identified PEs and the spatial relationship between PEs and the TSSs and transcription end sites (TESs). (A) Nearly all PEs are intragenic, overlapping with protein-coding genes. Only 21 PEs (1%) are located in intergenic regions. (***) P < 0.0001. (B) Pie charts show the proportion of genomic features (protein-coding genes and non-protein-coding features) overlapping with intragenic PEs (n = 1898) and intergenic PEs (n = 21) (left and right, respectively). (C) Gene Ontology (GO) analysis of the protein-coding genes overlapping exclusively with intragenic PEs (n = 1348) in the molecular function category (P < 0.0001; Supplemental Dataset S10). (D) Analysis of distances between PE midpoints (n = 1348) and TSSs of all 2450 protein-coding genes overlapping with PEs, conducted in a strand-specific manner. Regions beyond the PE borders extended to ±10 kb from the PE midpoints were analyzed. These protein-coding genes were sub-divided into two groups based on where their TSSs are located relative to the PE midpoints, either upstream (i) or downstream (ii). Upstream genes: TSSs of genes located 5′ to PE midpoint; downstream genes: TSSs of genes located 3′ to PE midpoint. The bars represent the total number of TSSs in 1-kb intervals from PE midpoints. (E) Analysis of intragenic PEs based on the numbers of protein-coding genes overlapping with them. (F,G) Heatmaps illustrating protein-coding gene structures relative to PE midpoints for Group 1 and 2 PEs, respectively. A red-to-blue color scale represents the protein-coding gene structures, with red referring to the 5′ end (TSSs) and blue referring to the 3′ end (TESs) of protein-coding genes. The three panels in figure C and D differ by the region examined, ranging from ±1500 nt, ±500 nt, and ±100 nt from the PE midpoint (from left to right). (F) Group 1 PEs overlap with one gene; (G) Group 2 PEs overlap with two protein-coding genes per PE region. For both Group 1 and 2 PEs, TESs (blue) are located preferentially in close proximity to the PE midpoint in contrast to TSSs (red). The same trend is found for TESs of protein-coding genes encoded on both DNA strands.
Most of the intragenic PEs (n = 1348) identified here overlap exclusively with protein-coding genes (Fig. 3B; Supplemental Datasets S8, S9). GO analysis of the 2450 protein-coding genes overlapping these PEs found that regulation of transcription is among the most frequent GO terms in the molecular function category (Fig. 3C; Supplemental Fig. S8; Supplemental Dataset S10; P < 0.0001, Fisher's exact test). The remaining 550 intragenic PEs overlap with protein-coding genes and non-protein-coding genes, including transposons (TEs) (Fig. 3B). The intergenic PEs (n = 21) located between protein-coding genes can also overlap with non-protein-coding features, including TEs (Fig. 3B). The integrative genomics view (IGV) visualization of three intragenic PEs and their overlapping protein-coding genes is shown in Figure 4.
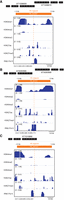
Integrative genomics viewer (IGV) visualization of three PE loci and their surrounding protein-coding gene annotations. The PE region (indicated by orange boxes) and the protein-coding genes (indicated by black boxes with the direction of transcription) in the same genome region are shown. The IGV genome-browser view of H3K4 methylation (mono-, di-, and tri-), acetylation and trimethylation of H3K27, and RNA Pol II occupancy are shown for PE_000087 (A), PE_001121 (B), and PE_000107 (C). Each genomic-browser view is centered around the PE midpoint (indicated by orange dotted lines).
In the compact genome of Arabidopsis, gene bodies and intergenic regions occur about every 2–3 kb (The Arabidopsis Genome Initiative 2000), indicating that CREs, like enhancers, in Arabidopsis are likely to be located close to protein-coding genes. To understand how the intragenic PEs overlap with specific protein-coding gene structures, we first used a metagene-like analysis and mapped the TSSs of all protein-coding genes that overlap with PE regions, in a strand-specific manner. To account for the TSSs of all genes overlapping with PEs, we expanded the window of analysis to ±10 kb from the PE midpoint. To consider the distance between PE midpoints and the TSSs of all protein-coding genes that overlap with PE regions, all genes overlapping with PEs were grouped based on the distance of their TSSs to PE midpoints (shown as bars on Fig. 3D). For the genes that initiate downstream from PE midpoints (top right and bottom left on Fig. 3D, panel ii), the average distance of their TSSs from the midpoint was 454–458 nt, indicating that their promoters are located away from PE midpoints. In contrast, the average distance of TSSs located upstream of PE midpoints was >3.2 kb (top left and bottom right on Fig. 3D, panel i). Notably, twice as many genes overlapping PEs have TSSs located far upstream of the PE midpoint (n = 1647) compared to downstream from the midpoints (n = 803) (P < 0.0001, χ2 test; Fig. 3D; Supplemental Fig. S9). This suggests that most TSSs of protein-coding genes are not preferentially located near PE midpoints. Additionally, based on chromatin modification signatures (shown in Fig. 1D), PEs do not resemble conventional promoters, when compared to conventional promoters previously characterized by Hetzel et al. (2016).
We then analyzed the connection between transcription end sites (TESs) of protein-coding genes and the PE midpoints. To visualize where different protein-coding gene structures are enriched relative to the PE midpoints, we depicted the positions of the TSSs and TESs in different colors using a heatmap-like approach. Since some intragenic PEs overlap with more than one protein-coding gene, we subdivided the PEs into groups, based on the number of genes they overlap and analyzed them separately (Fig. 3E). Most PE regions (93%) overlap with one or two protein-coding genes (Groups 1 and 2, respectively). We mapped the positions of protein-coding genes relative to gene structures and the PE midpoint for the Group 1 and 2 PEs separately (Fig. 3F,G), taking into account the orientation of each gene structure. Three different ranges of distance from PE midpoints were analyzed, ±1500, ±500, and ±100 nt, to zoom in on the regions closest to the midpoint, which most likely represent the regulatory modules. This analysis indicates that the midpoint-proximal regions of PEs are dominated by the TESs of protein-coding genes.
To confirm that there is no bias between the chromatin signature present at PEs and the 3′ ends of all other protein-coding genes that do not harbor PEs, we further analyzed the 3′ ends of the group of all other protein-coding genes that do not house PEs. We profiled the distribution of H3K4 methylation (mono-, di-, and tri-) and acetylation and trimethylation of H3K27 in regions flanking TESs of this group of protein-coding genes (that do not harbor PEs). As expected, we found that the chromatin signature of the 3′ ends of all protein-coding genes that do not harbor PEs is very different from the chromatin signature of PEs (Supplemental Fig. S10). The additional profiling of the distribution of H3K4 methylation at the gene bodies of protein-coding genes that harbor PEs at their 3′ UTRs showed that the H3K4me1 signal dramatically declines toward the 3′ ends of genes (Supplemental Fig. S1B). These comparisons further indicate that there is no bias between the chromatin signature present at PEs and the 3′ ends of the protein-coding genes (details in SI Text). We also confirmed that there is no bias between convergent gene pattern and PEs’ identification (details in SI Text).
Together with the TF binding data, these observations suggest that most of the PE midpoint-proximal regions overlap with the 3′ ends of some genes, where PASs are also located, and cleavage/polyadenylation takes place. Therefore, it is possible that these regulatory regions may serve dual purposes in Arabidopsis, by also functioning as transcriptional enhancers.
Connection between PEs and the experimentally characterized egg apparatus-specific enhancer
Only five enhancers have been extensively experimentally characterized in Arabidopsis (Weber et al. 2016) and we wanted to find out if any of these enhancers share similarities with PEs. Using Arabidopsis seedling ChIP-chip data sets (Zhang et al. 2007; Charron et al. 2009; Chodavarapu et al. 2010), we determined that one of them, the egg apparatus-specific enhancer (EASE) and its neighboring chromatin, are enriched for H3K4me1 compared to H3K4me3 (Fig. 5A; P < 0.05, two-tailed paired t-test; IGV visualization of EASE locus: Fig. 5C), providing further support for our use of H3K4me1 as a genomic property of a certain group of Arabidopsis enhancers.
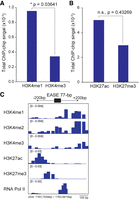
Chromatin signatures in the region flanking the EASE genomic locus and the IGV visualization of the EASE locus. The accumulation of HMM posterior probability (as a measurement of total ChIP-chip signal intensity) for each ChIP-chip data set (±200-bp the EASE genomic locus). (A) Histone H3K4 mono- and trimethylation. Statistically significant (*) P < 0.05, two-tailed paired t-test. (B) Histone H3K27 acetylation and trimethylation. Statistically nonsignificant (n.s.), P = 0.43269, two-tailed paired t-test. (C) IGV visualization of the EASE locus and the ±200 bp flanking region. The signal intensity of H3K4 methylation (mono-, di-, and tri-), acetylation and trimethylation of H3K27, and RNA Pol II occupancy are shown.
EASE is located in the intergenic regions on chromosome IV and its enhancer activity has been characterized experimentally (Yang et al. 2005). Previous work demonstrated that a 77-bp module located at the EASE locus can work independently of position and orientation and is sufficient to drive spatially restricted β-glucuronidase (GUS) expression mainly in the egg apparatus; this module is well conserved in different accessions of Arabidopsis (77-bp EASE module, GenBank accession no. AX100536). We did not observe the EASE locus among the 1919 PEs, since it was not located in the nucleosome-free region in the seedling stage, which is most likely the result of EASE being an egg apparatus-specific enhancer. Likewise, we did not find significant differences between H3K27ac and H3K27me3 enrichment at the EASE locus (Fig. 5B; n.s., P > 0.05, two-tailed paired t-test), which might be because at the seedling stage, EASE is only primed by H3K4me1, and has yet to be activated as a functional enhancer in the egg cells.
Next, we examined whether the PE regions harbor modules bearing similarities to the EASE 77-bp module that has been shown to be sufficient to control specific gene expression in the egg apparatus. However, there is generally no sequence conservation between different transcriptional enhancers, so we used the 77-bp EASE module as a model to search for significant matches based on position-specific scoring matrix (FIMO [Grant et al. 2011], P < 0.0001) on both strands of each PE region. This analysis allows the identification of modules with tolerable variations to the EASE 77-bp sequences that are also statistically significant. The identified modules were termed EASE-like. We found that 77% of identified PEs harbored at least one EASE-like module (n = 1468; statistical threshold: P < 0.0001). Moreover, more than half of these PEs carry more than one EASE-like module (n = 899; P < 0.0001, χ2 test). All together, these data, combined with the ability of PEs to engage in chromatin looping and being bound by a wide range of TFs, provide additional evidence that PEs have the potential to function as enhancer-like elements in Arabidopsis.
The intragenic nature of the PEs, and their potential function in seedlings, makes classical functional tests, usually performed using minimal promoters and a reporter gene, challenging to conduct and interpret. However, the relationship between PEs and known enhancers that function in seedlings can be examined using enhancer trap lines. To this end, we examined enhancer trap lines that are expressed in germinating seedlings and found that among the 10 positionally mapped enhancer trap insertion lines, (Liu et al. 2005) two PEs are located in the same genomic location as the reporter gene insertion (Supplemental Fig. S11A,B), and one PE is located in close proximity (<6 kb) from the insertion site (Supplemental Fig. S11C; details in SI Text). This result indicates that the PEs overlapping with or located close to the enhancer trap reporter gene insertion could be active enhancers in Arabidopsis. Also, the enhancer trap lines have the advantage of providing evidence of the enhancer's activity in its native genomic context, which is a crucial point given the intragenic nature of PEs.
Intriguingly, we also found that in addition to occurring in PEs, the EASE-like modules can be found in the 3′ UTRs of a much wider group of Arabidopsis genes (53% of all 3′ ends of Arabidopsis protein-coding genes have one or more EASE-like modules; P < 0.0001; details in SI Text). The presence of the EASE-like modules in 3′ ends of many Arabidopsis protein-coding genes may suggest the possibility of a broader connection between transcriptional enhancers and the sites of mRNA 3′ end processing. It also suggests that different groups of transcriptional enhancers bearing chromatin signatures that differ from those of PEs might be discovered in the future at the 3′ ends of Arabidopsis genes.
PEs can form intrachromosomal chromatin loops and physically interact with other protein-coding genes
The hallmark of transcriptional enhancers is that they can function over large genomic distances by forming chromatin loops (independently of distance and orientation) to target promoters (Sanyal et al. 2012; Spitz and Furlong 2012; Shlyueva et al. 2014). Enhancers can also interact with regions outside of promoters and form physical interactions with a target gene body by associating with elongating Pol II (Lee et al. 2015). To examine possible intrachromosomal interactions involving PE regions, we utilized Arabidopsis Hi-C data at 2-kb resolution in young seedlings (Wang et al. 2015), and identified 5773 pairs of interacting loci (2-kb each). We found that 452 PEs (24%; P = 9.2 × 10⁻¹⁵, Bedtools Fisher's exact test was used to test the statistical significance of data associations with a set of randomized control) can form 1076 intrachromosomal loops with 879 loci, termed PE-interacting loci, eILs (Fig. 6A–C; Supplemental Fig. S12; Supplemental Dataset S11). These data also suggest that these interactive PE regions are located at genomic loci that have the high probability of forming intrachromosomal interactions with another loci.
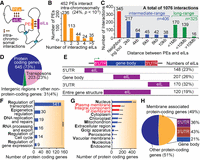
PEs can physically interact with other protein-coding genes intrachromosomally. (A) Illustration of the chromatin looping between PEs and eILs. (B) 24% (P = 1.7 × 10⁻¹⁴) of all PEs can form chromatin loops with other loci (eILs); these interactive PEs can be grouped based on the number of eILs they interact with (shown as bars). (C) The identified 1076 PE–eIL interactions fall into three groups: neighboring loci (red bars), intermediate-range interactions (2–10 kb, blue bars), and long-range interactions (>10 kb, green bars). (D) Most eILs occur in protein-coding gene regions (73%; P < 0.0001). eILs also occur in other genomic features, including TEs, intergenic regions, and other non-protein-coding genes. (E) Over 50% of eILs are mapped to 5′ UTRs and 3′ UTRs of protein-coding genes; and the rest are mapped to gene body or entire gene regions (from 5′ to 3′ UTRs of genes with length <2-kb). (F,G) GO analysis of protein-coding genes that interact with PEs (Fisher's exact test [*] P < 0.05, [***] P < 0.0001; Supplemental Dataset S13). (F) Regulation of transcription is the most frequent GO term in the molecular function category. (G) GO terms for subcellular localization show that many of the genes encode for membrane-associated functions. (H) 79% (P < 0.0001, χ2 test) of genes encoding for membrane-associated functions interact with PEs via their 5′ or 3′ UTRs.
In addition, interactive PE regions can form multiple chromatin loops with different eILs (Fig. 6B); about 23% of PEs can form more than three loops, with some PEs forming 10–45 loops. We also found that some PEs overlap with pairs of interreacting loci that consist of two neighboring loci (Fig. 6C, panel i). Based on the size of the chromatin loops, PE–eIL interactions also involve (ii) intermediate-range interactions (2–10 kb) and (iii) long-range interactions (>10 kb), with the largest loop being 27 Mb (Fig. 6C). We also found that the intermediate- and long-range interactions occur in similar numbers, 38% and 30% of total interactions, respectively, and that the more chromatin loops a single PE locus can form, the larger the size of the loops (Supplemental Dataset S12). For example, the average size of chromatin loops for PEs forming 3–4 loops is 7.8 kb, but for the PEs forming 10–45 loops, the size is 2.74 Mb. Moreover, the more extensive loop-forming PEs tend to interact more with TEs, rather than protein-coding genes.
The eILs occur in protein-coding gene regions (73%), TEs (23%), and other non-protein-coding regions (4%) (Fig. 6D; P < 0.0001, Fisher's exact test). This indicates that most interactive PEs form chromatin loops with protein-coding genes. More than half of the protein-coding genes interact with PEs via 5′ UTRs (23%) and, intriguingly, 3′ UTRs (32%) (Fig. 6E). The remaining genes interact via the gene body or entire gene structure (Fig. 6E), which is similar to results reported in mice (Lee et al. 2015). GO analysis of the protein-coding genes interacting with PEs showed that the majority of these genes are involved in the regulation of transcription (Fig. 6F; Supplemental Fig. S13; Supplemental Dataset S13; P < 0.0001, Fisher's exact test). Half of the genes interacting with PEs are annotated as membrane function associated (Fig. 6G,H), and the majority (79%; P < 0.0001, χ2 test) of these genes interacts with PEs via either their 5′ or 3′ ends (36% and 43%, respectively) (Fig. 6H).
Intriguingly, many of the genes interact with PEs through their 3′ UTRs. In yeast and mammals, the 3′ and 5′ ends of protein-coding genes often interact forming self-gene loops, which are widely involved in the regulation of these genes’ expression (Hampsey et al. 2011; Grzechnik et al. 2014). Self-gene loops are also common in Arabidopsis (Liu et al. 2016). Using the Arabidopsis Hi-C data set at gene-level resolution (Liu et al. 2016), we found that ∼22% of the eILs are located in the 3′ UTRs of genes that also form self-gene loops between their 3′ and 5′ UTRs (P < 0.0001, Fisher's exact test). It is possible that the interaction of the PEs with the 3′ ends of their target genes may be one of the mechanisms influencing transcription at the 5′ end via targeting the 3′ end of self-looped genes.
We also used a panel of 16 epigenetic data sets from young Arabidopsis seedlings (Wang et al. 2015) to examine the epigenomic signatures of PEs as well as whether different categories of eILs associated with specific genomic features (TEs or 5′ UTRs, 3′ UTRs and gene bodies of protein-coding genes) have distinct chromatin signatures. (Supplemental Fig. S14A,B, details in SI Text). Remarkably, the pool of interactive PEs has more-pronounced 3′ UTR chromatin signatures than the entire population of PEs (Supplemental Fig. S14B, bottom panel). Additionally, this pool of PEs had a noticeable enrichment of the histone H3.3 variant (Supplemental Fig. S14B). Histone H3.3 has been shown to associate with the 3′ end of genes in Arabidopsis and animals (Ooi et al. 2010; Stroud et al. 2012; Wollmann et al. 2012), associate with less stable and easier to displace than canonical nucleosomes in animals, and also actively mark transcriptional enhancers (Deaton et al. 2016). The epigenetic signatures based on comprehensive chromatin profiling confirmed our findings that PEs are closely associated with the 3′ UTRs of protein-coding genes, where cleavage/polyadenylation also takes place (Fig. 3F,G), yet bear the signatures of canonical mammalian enhancers (Fig. 1C,D).
PE regions are conserved in 1135 Arabidopsis accessions
DNA sequence conservation is often associated with important functions (Wittkopp and Kalay 2011; Burgess and Freeling 2014). Therefore, we applied comparative genomics to the collection of 1135 recently sequenced Arabidopsis accessions (1001 Genomes Consortium 2016). Enhancers have higher sequence variability than promoters within intra-species because enhancers are responsible for the recruitment of multiple TFs that control gene expression as shown in animal studies (Wittkopp and Kalay 2011). Yet, the genomic locations of functionally homologous enhancers are often conserved between species and also exhibit some degree of intra-species sequence conservation.
To gain insight into the conservation of PE positions and sequence, we first interrogated the high-diversity panel of 10 accessions (Kawakatsu et al. 2016; 1001 Genomes Consortium 2016) selected based on their geographic and genetic diversity (Supplemental Dataset S14). The calculated average of allelic variants (AVs) across the entire Arabidopsis genome in a context-independent manner was reported to be 300 nt per 3-kb region across all accessions. Analysis of AVs at each genomic position in all PEs indicated that PE regions are highly conserved within the high-diversity panel (Supplemental Dataset S14). Furthermore, analysis of all 1135 accessions showed that the average AV at PEs is significantly lower than the expected average AV across the entire genome (Supplemental Fig. S15; the expected average AV was calculated in a genomic context-independent manner based on a random set of 3-kb genomic regions, see SI methods for detailed methods). More than 72% of total PEs had AVs <300 nt per 3-kb, with the average being 256 nt per 3-kb PE region, P < 0.0001, suggesting that the sequences of PEs are conserved in the 1135 Arabidopsis accessions.
DISCUSSION
Here we have shown that Arabidopsis possesses a novel group of >1900 unique, putative CREs that may function as intragenic enhancer-like elements, providing the first genome-wide identification and characterization of potential intragenic transcriptional enhancers in plants (summary in Fig. 7). The PEs carry the canonical signatures of active mammalian transcriptional enhancers, which is also found at the experimentally characterized Arabidopsis enhancer EASE. Importantly, many PEs can engage in chromatin looping and serve as hotspots for TF binding, further supporting that PEs could function as PEs in Arabidopsis. Enhancer trap is a powerful approach to determine the possible locations of functional enhancers. We found that some PEs are located in close proximity to the known enhancer trap reporter gene insertions, suggesting that these PEs could be active enhancers and provides one of the most direct measures of enhancer activity in its native genomic context, a crucial point given the intragenic nature of PEs.
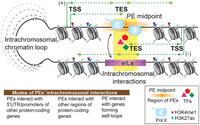
Summary of the conserved and novel characteristics of PEs. This diagram summarizes the identification and characterization of the identified intragenic putative plant enhancers (PEs) carrying epigenomic signatures of canonical mammalian enhancers. Distinct from putative plant enhancers reported previously, almost all PEs are intragenic and associated with the 3′ ends of protein-coding genes. The TESs located upstream of the midpoint on both DNA strands in a pattern that resembles strand-specific RNA expression profile. The data collectively suggest that a high number of genes end their transcription in the vicinity of PE midpoints. In accord, PAS-like motifs are clustered in this region. PEs can physically form intrachromosomal chromatin loops with other regions (eILs), majority of which are protein-coding genes. Additionally, more than half of PEs can interact with protein-coding genes via their 5′ or 3′ UTRs. The sizes of the intrachromosomal chromatin loops ranged from a few kb to 27 Mb.
PEs associate predominately with the 3′ UTRs of protein-coding genes, where cleavage/polyadenylation takes place. Furthermore, PEs serve as platforms for TF binding, and are enriched for binding motifs closely resembling cleavage/polyadenylation signals. The PAS-like motifs at PEs in Arabidopsis are bound by BLR, an ortholog of the homeobox proteins Meis1 and Pknox1 in human and mice, which have been shown to bind to and mediate Hoxb2 hindbrain enhancer activity (Jacobs et al. 1999). This suggests that our observations may have the potential to be extended beyond the plant kingdom. Indeed, a few potential human enhancers have been recently reported to be located in the 3′ UTR (Liu et al. 2017); however, no in-depth analysis and characterization were done on them, nor were any connections made to mRNA 3′ end processing. Therefore, to our knowledge, this is the first report that provides in-depth analysis and links hubs of two very different processes, mRNA 3′ end processing and potential transcriptional regulation of other genes. The close association of PEs with the 3′ end processing sites of genes they reside in is a novel and intriguing observation that requires in-depth follow up in Arabidopsis and other eukaryotes, such as mammals and Drosophila, in which there is a much better understanding of the mechanisms of transcription and 3′ end processing.
It would be interesting to determine how many 3′ UTRs may have the potential to serve as transcriptional enhancers, or whether this is a feature of specific groups of genes. Additionally, many experimentally characterized EASE-like modules can be found at PEs, as well as in regions flanking TESs of many protein-coding genes in Arabidopsis genomes. Together with the enrichment of PAS-like TF binding motifs at PEs, these observations further suggest the possibility of broader connections between transcriptional enhancers and the sites of mRNA 3′ end processing.
Given the scarcity of knowledge on chromatin signatures of plant transcriptional enhancers and the wide variety of different chromatin signatures of metazoan enhancers, it remains to be determined which other chromatin signatures could be used to identify enhancers in plants on a genome-wide scale. Three previous studies (Zhu et al. 2015; Hetzel et al. 2016; Oka et al. 2017) demonstrated that different groups of candidate plant enhancers do not necessarily have the same chromatin signatures; therefore, more research will be needed to identify the full repertoire of putative enhancers in plants and to determine their associated genomic features. A recent study profiled the accessible chromatin regions using ATAC-seq in Arabidopsis root tips, suggesting that some of these accessible chromatin regions might function as enhancers in root tips; however, their chromatin signatures have yet to be determined (Maher et al. 2018). It is also important to point out that different sets of chromatin signatures could be associated with many different groups of transcriptional enhancers that have distinct cellular functions (Zentner et al. 2011; Ernst et al. 2016). As would be expected for CREs possessing important regulatory functions (Wittkopp and Kalay 2011), the sequences of PE regions are conserved in the 1135 natural inbred Arabidopsis lines.
How could PEs act? Based on the Hi-C data, PEs can form intrachromosomal chromatin loops with other protein-coding genes. More than half of the protein-coding genes interacting with PEs do so either via their 5′ or 3′ UTRs, while the remaining genes interact via the gene body or entire gene structure. The interaction of PEs with 5′ UTRs would be in line with the classic mode of action of transcriptional enhancers targeting promoters, as would be expected for functional enhancers (Spitz and Furlong 2012; Shlyueva et al. 2014). Enhancers can also interact with regions outside of promoters and form physical interactions with a target gene body by associating with elongating Pol II (Lee et al. 2015). Thus, PEs’ interactions with other regions of protein-coding genes, such as s or the gene body, could be a result of similar associations of enhancers with elongating Pol II. Unexpectedly, many genes interact with PEs through their 3′ UTRs, pointing toward additional possible modes of enhancer action. For example, a large body of evidence shows that physical interaction between 3′ and 5′ UTRs of protein-coding genes is involved in the regulation of expression of such self-looped genes by various mechanisms (Hampsey et al. 2011; Grzechnik et al. 2014). We also found that many of the genes that interact with PEs via their 3′ UTRs form local self-gene loops. Thus, interaction of PEs with the target genes’ 3′ UTRs could serve as one of the mechanisms for transcriptional regulation of the self-looped genes.
Another tantalizing question is whether 3′ UTR-associated CREs, such as the PEs described here, could influence gene expression by regulating 3′ end mRNA processing of target genes and/or host genes. These two possibilities are not mutually exclusive, given the intimate interconnection between transcriptional and cotranscriptional RNA processing documented in many eukaryotes, such as loading of some 3′ end processing factors on the Pol II carboxy-terminal domain (Hsin and Manley 2012; Proudfoot 2016) around promoter regions and regulation of multiple processes via 3′ and 5′ UTRs of self-looping genes (Hampsey et al. 2011; Grzechnik et al. 2014). Therefore, the link between PEs and 3′UTRs of target genes should perhaps come as no surprise.
Our study provides a framework for investigating the mechanisms of transcriptional regulation and its link to cotranscriptional mRNA processing in Arabidopsis and other eukaryotes. Over 50% of identified metazoan enhancers are intragenic (Heintzman et al. 2007; Kim et al. 2010; ENCODE Project Consortium et al. 2012; Arnold et al. 2013), yet these remain the most elusive group of CREs in all eukaryotes; therefore, our work also contributes to the understanding of how some intragenic enhancers could function. Our findings provide a genome-wide look at a set of largely uncharacterized putative transcriptional enhancers in the plant genome; further analysis of this resource will enable annotation of transcriptional enhancers, functional studies of these key CREs, and improve our understanding of the noncoding regions of the genome.
MATERIALS AND METHODS
Plant materials and growth conditions
The inducible RNA interference (iRNAi) line (rrp41-i) targeting the Arabidopsis exosome subunit gene RRP41 was described previously (RRP41-iRNAi) (Chekanova et al. 2007; Shin et al. 2013). The ecotype background Columbia (Col-0) was used for WT and the iRNAi lines. To induce iRNAi against RRP41, the seedlings were germinated and grown for 7 d on 1/2 MS plates with 8 mM 17β-estradiol, as previously described (Chekanova et al. 2007), the induced seedlings are referred to as rrp41-i. The uninduced seedlings are referred to as RRP41 (WT), as the control for rrp41-i. All data sets utilized in our analysis were for young Arabidopsis seedlings in similar condition and developmental stages (see corresponding sections for each data set for more details).
Construction of libraries for strand-specific RNA-seq and mapping and assembly of transcriptomes
Three biological replicates, consisting of 7-d-old seedlings, were prepared using the RRP41-iRNAi line. Two sets of samples, both the induced (rrp41-i) and the uninduced corresponding control (RRP41), were collected. Total RNA was extracted from each biological replica and polyadenylated RNA [poly(A)+] was prepared using the TruSeq Stranded mRNA Library Preparation Kit (catalog number: RS-122-2101, Illumina). The rRNA-depleted total RNA (ribo-minus) was prepared from the same total RNA sample using TruSeq Stranded Total RNA Sample Preparation Kit with Ribo-Zero Plant (catalog number: RS-122-2401, Illumina). Each library was subjected to paired-end sequencing at 2 × 100 nt on an Illumina HiSeq2500 and demultiplexed using CASAVA 1.8.2. The RNA-seq data generated using filters to select for polyadenylated RNA and rRNA-depleted total RNA were referred to as poly(A)+ and ribo-minus data sets, respectively, in subsequent analysis. Therefore, a total of four series of RNA-seq data were generated in the study, including two types of libraries for the induced RRP41-iRNAi plants (rrp41-i) and corresponding control (RRP41). Each series contains three biological replicates (a total of 12 data sets). Detailed methods for analyzing RNA-seq data, as well as meta-analysis of transcriptional activity at PE regions, are fully described in the SI Methods.
Microarray data analysis
The previously published chromatin immunoprecipitation followed by high-density/resolution whole-genome tiling microarray (ChIP-Chip) data sets were downloaded from GEO. The data used in this study included GSE13613 (Zhang et al. 2009) (sample GSM343141 for H3K4 monomethylation, GSM343143 for H3K4 di-methylation, and GSM343144 for H3K4 trimethylation in WT, performed for 3-wk-old Arabidopsis seedlings), GSE21818 (Chodavarapu et al. 2010) (sample GSM543507 for RNA Pol II ChIP-chip and GSM543508 for input DNA, performed for 10- to 14-d-old Arabidopsis seedlings), GSE15597 (Charron et al. 2009) (for H3K27 acetylation, performed for 5-d-old Arabidopsis seedlings), and GSE7093 (Zhang et al. 2007) (for H3K27 trimethylation, performed for 10- to 14-d-old Arabidopsis seedlings). Detailed methods for analyzing ChIP-chip data sets are fully described in the SI Methods.
Analysis of the chromatin signatures and RNA Pol II occupancy in the PE regions
To characterize the chromatin signatures and RNA Pol II occupancy in the PE regions, metagene analysis was conducted, using BEDTools version 2.24 (Quinlan and Hal 2010) (map -o mean | groupby -o sum function). The entire 3-kb region was divided into 100 intervals (30-nt per bin), and the accumulation of HMM posterior probability (as a measurement of signal intensity) for each ChIP-chip data set (described above) was tabulated per 30-nt bin. The summed signal intensities in each 100 intervals in the entire 3-kb PE region were graphed in metagene-like plot relative to PE midpoint (orange dotted line). Metagene plots are typically used to depict the results of metagene analysis in vicinity of genes (typically centered at TSSs of protein-coding genes); here we adopted the similar logic (termed metagene-like plots) to characterize the signal intensities of each ChIP-chip data in the PE regions, relative to the midpoints. The same data were graphed in a heatmap-style plot to show the signal intensity for each PE region (Supplemental Fig. S2).
Analyzing the TF binding motifs in the PE regions (MEME-FIMO)
To measure the occurrence of TF binding motifs in PE regions, the TF binding motif data sets curated by AGRIS (Arabidopsis gene regulatory information server) (Yilmaz et al. 2011) were used. AGRIS provides extensive resources about Arabidopsis CREs and functional information for over 1700 TFs, including experimentally verified TF binding sites in proximity to genes genome-wide and the consensus binding motifs of each TF. FIMO (Grant et al. 2011), which is based on a position-specific scoring matrix, from the MEME suite was used to scan for known TF binding motifs within the entire length of PE regions that were statistically significant. Detailed methods are fully described in the SI Methods.
Analysis of peaks of TF binding in the PE regions (DAP-seq)
The analysis of peaks of TF binding in PEs utilized the comprehensive data set of genome-wide identification of TF-binding peaks and sequence motifs released by the Cistrome project (http://neomorph.salk.edu/PlantCistromeDB) (O'Malley et al. 2016), which used DAP-seq to interrogate TF binding to genomic DNA (gDNA) in the in vitro assay. Detailed methods are fully described in the SI Methods. Briefly, to determine TF footprints at PE regions, all peaks of TF binding in PE regions were extracted from the DAP-seq peak calling data set for all 522 TFs (P < 0.0001, Bedtools Fisher's exact test). Fisher's exact test was used to test the statistical significance of data associations with a set of randomized controls; the genomic interval-based BEDtools Fisher version 2.24 (Quinlan and Hal 2010), which compared a simulated random set of similar genomic regions (control, TAIR10 genome-based) versus the observed enrichment, was used.
Analysis of the genomic locations of the identified PEs and the landscape of TSSs and TESs of protein-coding genes relative to intragenic PEs
To examine the spatial relationship between PEs and annotated gene units in Arabidopsis TAIR10 genome (The Arabidopsis Genome Initiative 2000), BEDTools version 2.24 (Quinlan and Hal 2010) was used to determine if any of the annotated gene units overlap with the identified PE regions genome-wide (P < 0.0001, Fisher's exact test). Detailed methods are fully described in the SI Methods. Briefly, nearly all PEs were located in intragenic regions, which overlap protein-coding gene units (P < 0.0001, χ2 test). All different individual genomic features colocalized with PEs were separately analyzed, and these genomic features included protein-coding genes, TEs, pseudogenes, annotated ncRNAs, tRNAs, regions encoding miRNAs, snRNAs, and snoRNAs. Only the intragenic PEs (n = 1348) that overlap exclusively with protein-coding genes were subjected to further analysis, including GO analysis. The landscape of TSSs and TESs of protein-coding genes relative to intragenic PEs was also analyzed and depicted using a heatmap-like approach. The unconventional use of heatmaps centered around PE midpoints allowed us to: (i) clearly visualize different regions of protein-coding gene units in different colors, highlighting the 5′ to 3′ polarity of the protein-coding gene structure, and (ii) identify the positions where specific protein-coding gene components (such as TESs) were enriched in the vicinity of the PE midpoint in a strand-specific manner.
Analysis of intrachromosomal interactions at PE regions
The recently published data set of intrachromosomal interactions obtained by Hi-C (Wang et al. 2015) was used to determine whether PE regions interact with other loci on the same chromosome. The Hi-C data sets were generated using young seedlings, grown under similar conditions used to identify PEs and to characterize the transcriptional activity at PE regions. Detailed methods for analyzing Hi-C data sets are fully described in the SI Methods.
Analysis of eILs, the PE interacting loci
To characterize the genomic features of eILs (n = 879), which interact with PEs intrachromosomally, BEDTools version 2.24 (Quinlan and Hal 2010) was used to determine if any annotated gene units overlap with eILs genome-wide. To determine if PEs can interact with specific component of protein-coding genes, the positions of eILs were mapped against protein-coding gene units (5′UTRs, 3′UTRs, and the gene body) genome-wide using BEDTools version 2.24 (Quinlan and Hal 2010). Detailed methods are fully described in the SI Methods.
DNA sequence conservation in PE regions
To examine PEs’ positional and sequence conservation, the collection of sequence variants analyzed by the 1001 Arabidopsis thaliana genomes project were utilized (1001 Genomes Consortium 2016). The 1001 Arabidopsis thaliana genomes project reported a large collection of genome accessions from more than 1200 natural variants selected based on their geographic and genetic diversity, representing a diverse population of natural variants collected globally. Detailed methods are fully described in the SI Methods.
Software
The following software was used: BEDTools version 2.24 (Quinlan and Hal 2010); CisGenome/TileMap (Ji et al. 2006, 2008); Cufflinks (v2.1.1) (Trapnell et al. 2010); FIMO (find individual motif occurrences) (Grant et al. 2011); gplot/heatmap.2 (http://cran.r-project.org/package=gplots); MEME-ChIP (Machanick and Bailey 2011); TopHat (v2.0.9) (Kim et al. 2013); VCFtools version 0.1.14 (Danecek et al. 2011).
DATA DEPOSITION
Sequencing data have been deposited in the Gene Expression Omnibus under accession number GSE99406.
SUPPLEMENTAL MATERIAL
Supplemental material is available for this article.
ACKNOWLEDGMENTS
This work was supported in part by grants from the National Institutes of Health (NIH) (#GM073872), the National Science Foundation (NSF) (grant #0724168), the U.S. Department of Agriculture (USDA) (grant #35301-18207) to J.A.C., and personal funding.
Author contributions: J.A.C. and H-L.V.W. conceived and designed the experiments. H-L.V.W. performed the experiments and bioinformatics analysis. J.A.C. and H-L.V.W. analyzed the data and wrote the paper.
Footnotes
-
Article is online at http://www.rnajournal.org/cgi/doi/10.1261/rna.071209.119.
- Received March 12, 2019.
- Accepted July 4, 2019.
This article is distributed exclusively by the RNA Society for the first 12 months after the full-issue publication date (see http://rnajournal.cshlp.org/site/misc/terms.xhtml). After 12 months, it is available under a Creative Commons License (Attribution-NonCommercial 4.0 International), as described at http://creativecommons.org/licenses/by-nc/4.0/.




