


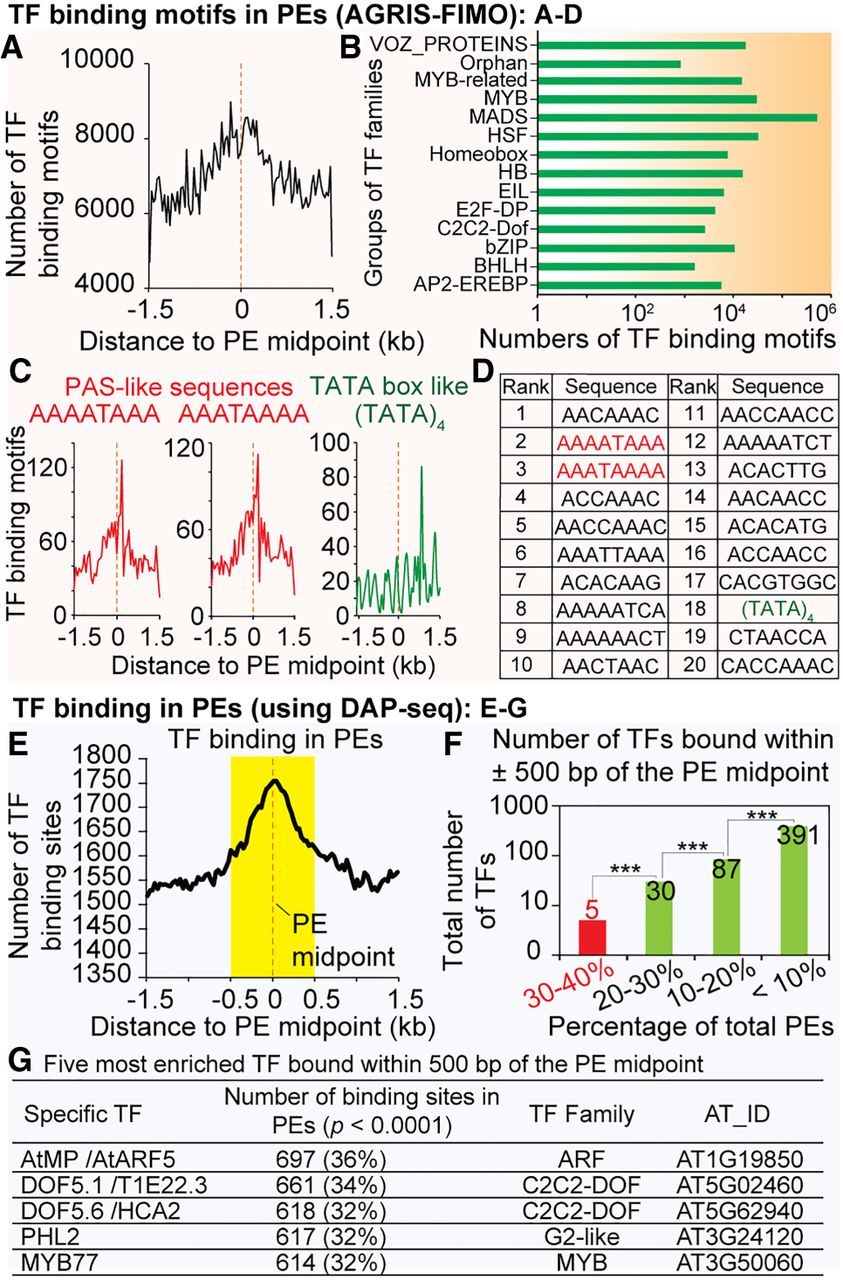
PEs are hotspots for TF binding and binding sites specifically cluster around PE midpoints. Panels (A–D) show the distribution of known TF binding motifs in PE regions. The experimentally characterized TF motifs were extracted from the AGRIS database and their occurrences in PE regions were determined with MEME-FIMO (P < 0.0001). Panels (E–G) show the experimentally identified binding of TFs at PE regions. The peaks of TF binding at PE regions were extracted from DAP-seq data sets (A) Distribution of all TF motifs in identified PEs. (B) Abundance of different TF families with binding motifs at PEs, shown as a total number of binding motifs present in the PE region for each TF family. (C) Distribution of specific TF motifs bearing PAS-like (in red) and TATA-box like (in green) sequences in PE regions. (D) The top 20 most frequent TF binding motifs identified in the PE regions; their distribution is shown in Supplemental Figure S4. (E) Distribution of TF binding sites in the identified PEs. The peak enrichment of TF binding was observed close to the PE midpoints (orange dotted line), defined as PE midpoint-proximal region, ±500 nt flanking the PE midpoint (in yellow). (F) Numbers of TFs binding in PE midpoint-proximal regions (***) P < 0.0001. The five specific TFs represented by the red bar bind at a total of >600 PEs (30%–40% of total PEs); and (G) their information (P < 0.0001, Bedtools Fisher's exact test).




