


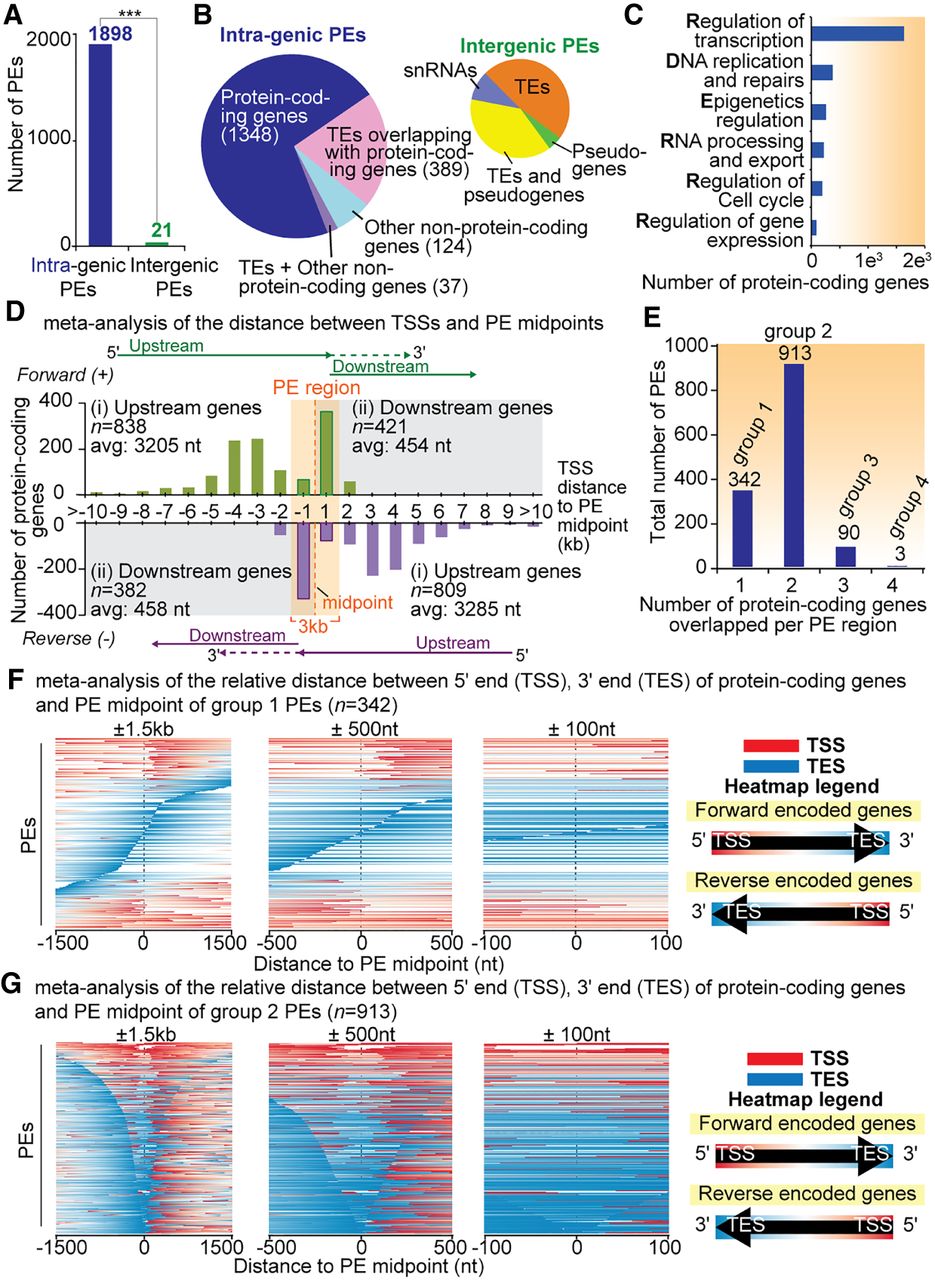
Genomic architecture of the identified PEs and the spatial relationship between PEs and the TSSs and transcription end sites (TESs). (A) Nearly all PEs are intragenic, overlapping with protein-coding genes. Only 21 PEs (1%) are located in intergenic regions. (***) P < 0.0001. (B) Pie charts show the proportion of genomic features (protein-coding genes and non-protein-coding features) overlapping with intragenic PEs (n = 1898) and intergenic PEs (n = 21) (left and right, respectively). (C) Gene Ontology (GO) analysis of the protein-coding genes overlapping exclusively with intragenic PEs (n = 1348) in the molecular function category (P < 0.0001; Supplemental Dataset S10). (D) Analysis of distances between PE midpoints (n = 1348) and TSSs of all 2450 protein-coding genes overlapping with PEs, conducted in a strand-specific manner. Regions beyond the PE borders extended to ±10 kb from the PE midpoints were analyzed. These protein-coding genes were sub-divided into two groups based on where their TSSs are located relative to the PE midpoints, either upstream (i) or downstream (ii). Upstream genes: TSSs of genes located 5′ to PE midpoint; downstream genes: TSSs of genes located 3′ to PE midpoint. The bars represent the total number of TSSs in 1-kb intervals from PE midpoints. (E) Analysis of intragenic PEs based on the numbers of protein-coding genes overlapping with them. (F,G) Heatmaps illustrating protein-coding gene structures relative to PE midpoints for Group 1 and 2 PEs, respectively. A red-to-blue color scale represents the protein-coding gene structures, with red referring to the 5′ end (TSSs) and blue referring to the 3′ end (TESs) of protein-coding genes. The three panels in figure C and D differ by the region examined, ranging from ±1500 nt, ±500 nt, and ±100 nt from the PE midpoint (from left to right). (F) Group 1 PEs overlap with one gene; (G) Group 2 PEs overlap with two protein-coding genes per PE region. For both Group 1 and 2 PEs, TESs (blue) are located preferentially in close proximity to the PE midpoint in contrast to TSSs (red). The same trend is found for TESs of protein-coding genes encoded on both DNA strands.




