


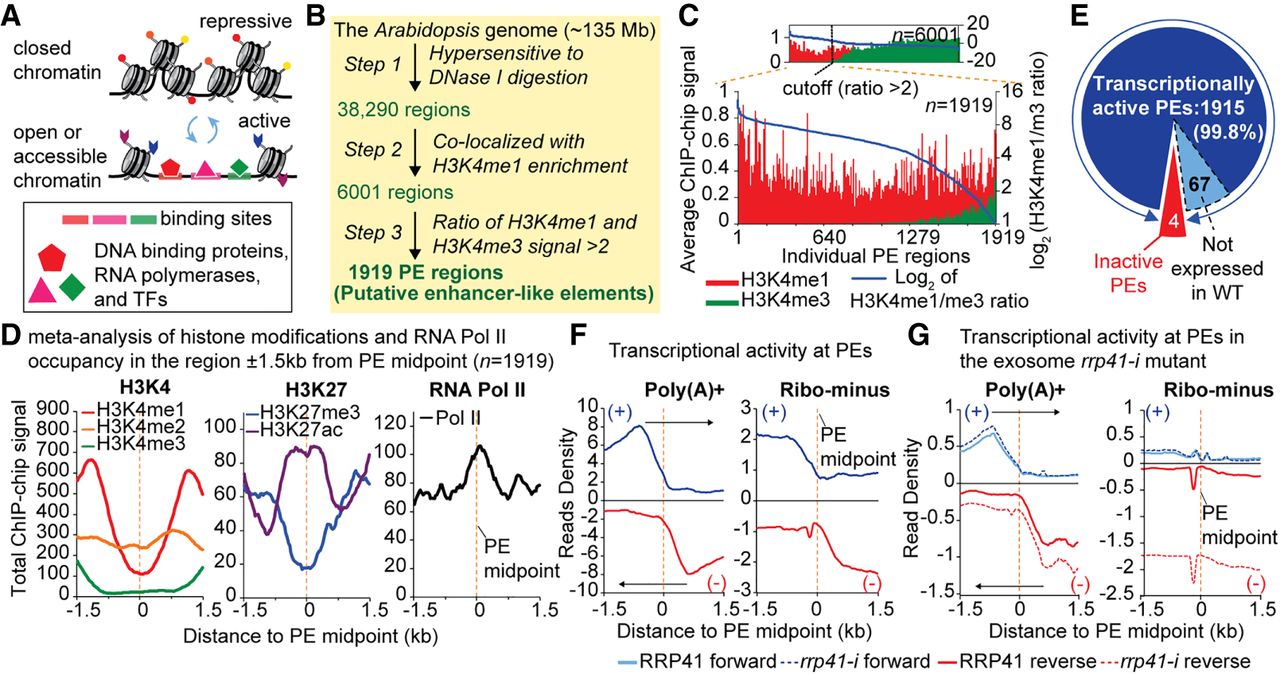
The putative enhancer-like elements (PEs) in Arabidopsis carry canonical epigenomic signatures of mammalian enhancers. (A) Open and closed chromatin structures. (B) PEs identified by enrichment of H3K4me1 and an H3K4me1/me3 ratio of >2, centered on DNase I hypersensitive sites. (C) Signal intensity of H3K4me1 and me3 at the identified PEs (n = 1919). The hidden Markov model (HMM) posterior probability scores of mono and trimethylation of H3K4, which represent the signal intensities per specific histone modification, were tabulated for each of these 6001 DNase I hypersensitive sites (DHSs). Red and green bars correspond to H3K4me1 and H3K4me3, respectively; the blue line corresponds to the log2 of the ratio of H3K4me1/me3. The small graph at the top shows the H3K4me1 and H3K4me3 signals in all 6001 regions before applying the H3K4me1/me3 threshold (step 3). (D) Meta-analysis of the chromatin signatures and Pol II occupancy in the region flanking the PE midpoints (orange dotted line). From left to right: the distribution of H3K4 methylation (mono-, di-, and tri-), acetylation and trimethylation of H3K27, and Pol II occupancy. The y-axis shows the signal intensity from ChIP-chip data; the x-axis depicts the distance ±1.5 kb from PE midpoints. (E) Pie diagram illustrating the transcriptionally active and inactive PEs based on RNA-seq. PEs were considered expressed if the entire genomic region had at least 1 normalized read per ten million (>1 RPTM; P < 0.0001). (F,G) Meta-gene like plots showing the transcriptional activity as reads density (RPTM × 104) in PE regions. The poly(A)+ and ribo-minus RNA expression are shown independently for the top (blue, forward [+]) and bottom (red, reverse [−]) strands. (F) Transcriptional activity in the PE regions in wild-type (WT); (G) transcriptional activity in the PE regions in WT (solid) and the exosome-deficient lines (dashed line).




