


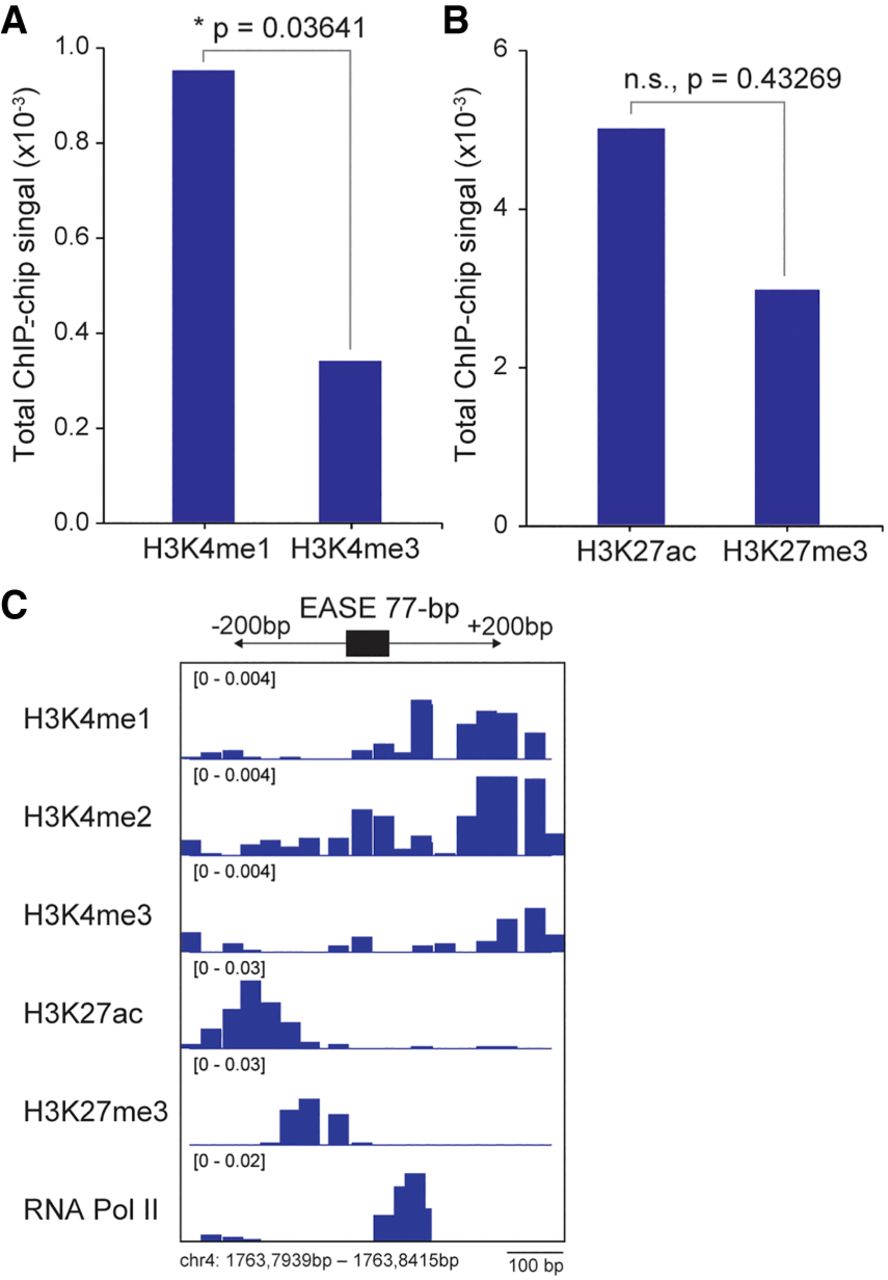
Chromatin signatures in the region flanking the EASE genomic locus and the IGV visualization of the EASE locus. The accumulation of HMM posterior probability (as a measurement of total ChIP-chip signal intensity) for each ChIP-chip data set (±200-bp the EASE genomic locus). (A) Histone H3K4 mono- and trimethylation. Statistically significant (*) P < 0.05, two-tailed paired t-test. (B) Histone H3K27 acetylation and trimethylation. Statistically nonsignificant (n.s.), P = 0.43269, two-tailed paired t-test. (C) IGV visualization of the EASE locus and the ±200 bp flanking region. The signal intensity of H3K4 methylation (mono-, di-, and tri-), acetylation and trimethylation of H3K27, and RNA Pol II occupancy are shown.




