


Transcriptome and targetome analysis in MIR155 expressing cells using RNA-seq
- Guorong Xu1,
- Claire Fewell2,
- Christopher Taylor1,3,
- Nan Deng1,
- Dale Hedges4,
- Xia Wang2,
- Kun Zhang5,
- Michelle Lacey6,
- Haitao Zhang2,
- Qinyan Yin2,
- Jennifer Cameron2,
- Zhen Lin2,
- Dongxiao Zhu1,3 and
- Erik K. Flemington2
- 1Department of Computer Science, University of New Orleans, New Orleans, Louisiana 70148, USA
- 2Department of Pathology, Tulane University Health Sciences Center and Tulane Cancer Center, New Orleans, Louisiana 70112, USA
- 3Research Institute for Children, Children's Hospital, New Orleans, New Orleans, Louisiana 70118, USA
- 4Miami Institute of Human Genomics, Miami, Florida 33136, USA
- 5Department of Computer Science, Xavier University of New Orleans, New Orleans, Louisiana 70125, USA
- 6Department of Mathematics, Tulane University and Tulane Cancer Center, New Orleans, Louisiana 70112, USA
Abstract
Previous studies have demonstrated the utility of microarray expression analysis to identify potential microRNA targets. Nevertheless, technical limitations intrinsic to this platform constrain its ability to fully exploit the potential of assessing transcript level changes to explore microRNA targetomes. High-throughput multiplexed Illumina-based next-generation sequencing (NGS) provides a digital readout of absolute transcript levels and imparts a higher level of accuracy and dynamic range than microarray platforms. We used Illumina NGS to analyze transcriptome changes induced by the human microRNA MIR155. This analysis resulted in a larger inferred targetome than similar studies carried out using microarray platforms. A comparison with 3′ UTR reporter data demonstrated general concordance between NGS and corresponding 3′ UTR reporter results. Nonharmonious results were investigated more deeply using transcript structure information assembled from the NGS data. This analysis revealed that transcript structure plays a substantial role in mitigated targeting and in frank targeting failures. With its high level of accuracy, its broad dynamic range, its utility in assessing transcript structure, and its capacity to accurately interrogate global direct and indirect transcriptome changes, NGS is a useful tool for investigating the biology and mechanisms of action of microRNAs.
Keywords
INTRODUCTION
MicroRNAs play critical roles in controlling biological processes through their ability to post-transcriptionally regulate gene expression. A testament to their importance in normal organismal biology is that dysregulation of microRNA function through genetic or epigenetic alterations is at the root of an array of disparate diseases including cancer (Calin et al. 2004; Iorio et al. 2005; Lu et al. 2005; Volinia et al. 2006; Zhang et al. 2006). The gene encoding microRNA-155 (MIR155) was classified as an oncogene (Clurman and Hayward 1989; Tam et al. 1997; Costinean et al. 2006) many years before it was identified as a microRNA (Eis et al. 2005) and is now among the most highly implicated microRNAs in cancer. Despite its link to hematologic (Eis et al. 2005; Kluiver et al. 2005) and other cancers (Volinia et al. 2006), there is currently little information regarding direct targets or pathways through which MIR155 signals to promote the tumor phenotype.
The phenotypic consequences of microRNAs are facilitated through the combination of not only direct, but also indirect, influences on gene expression. Nevertheless, the identification of direct target mRNAs is a topic of intense interest because it provides insights into the entry point through which microRNAs regulate a respective pathway. The recognition of targets through a predominantly Watson–Crick base-pairing mechanism has capacitated informatics-based prediction approaches that have lent considerable support to global target identification efforts (Li et al. 2010b). Despite the applicability of this approach, there are less tangible flanking sequence criteria that also play a role in specifying targeting (Hammell 2010). This limits the veracity of informatics-based target prediction and necessitates the concomitant application of experimental methods to search for and/or validate microRNA targets. High-throughput sequencing of RNAs isolated by cross-linking immunoprecipitation (HITS-CLIP) is a recently developed method that enables identification of direct target sequences through the sequencing of RNAs from immuno-precipitated cross-linked Argonaute–miRNA–mRNA complexes (Chi et al. 2009). The use of SILAC (stable isotope labeling with amino acids in cell culture) and state-of-the-art mass spectroscopy approaches has allowed the interrogation of up to 5000 members of a proteome for changes in protein output in response to microRNA expression (Selbach et al. 2008). Whereas HITS-CLIP can directly identify targeting sequences, proteomics approaches identify an inferred targetome. On the other hand, SILAC-based proteomics approaches also provide expression information for directly and indirectly affected genes that can give additional insights (relative to HITS-CLIP) into the biological outcomes of a microRNA's function. In spite of this, proteomics methods likely miss up to half of all expressed proteins and may be biased against the less abundant proteins that often play critical regulatory roles in cell signaling.
Microarray-based analysis of transcriptomes has the potential to interrogate a much larger portion of all genes expressed in a cell, and this approach has been used to globally characterize microRNA-mediated transcriptome changes and inferred targetomes (for example, see Grimson et al. 2007). Nevertheless, microarray technologies have several intrinsic characteristics that limit their utility in fully exploiting RNA changes to assess microRNA-induced transcriptome changes and microRNA targetomes. High-throughput sequencing of RNAs has overcome many of these limitations, and we reasoned that next-generation sequencing (NGS) may provide an improvement over microarray technologies. The higher level of accuracy of NGS (Marioni et al. 2008; Mortazavi et al. 2008) should make it more suitable for assessing the relatively moderate influences that microRNAs have on their target mRNAs. Its broader dynamic range allows the analysis of both high- and low-abundance transcripts and should therefore facilitate the analysis of genes spanning a wide spectrum of expression levels. Unlike the most commonly used microarray platforms, which only interrogate the ends of terminal exons to derive expression information, NGS gathers expression information throughout the entire locus of all expressed genes. This feature of NGS is important in light of recent studies showing the occurrence of widespread upstream transcription termination shifts during immune cell development and in cancer cells, for example, Sandberg et al. (2008) and Mayr and Bartel (2009). For genes simultaneously expressing shortened and long transcripts, expression changes obtained by microarray studies reflect only changes in the subset of extended isoforms that may be more responsive to microRNA targeting but do not accurately mirror overall changes in expression of the locus. Finally, NGS allows the user to simultaneously assess isoform structure, which is critically important for many regulatory processes including microRNA targeting. This information can be used to elucidate targeting failures in a particular system. We also anticipate that as the potential targetomes of microRNAs become well characterized and as NGS data become broadly accumulated for different cell systems, actual targetomes can be predicted for each cell system based on transcript structure. This should allow for informed prediction of biological outputs of microRNAs in different cell systems based on publicly available information alone.
RESULTS
Model system
Epstein-Barr virus (EBV) infected B-cells expressing the full repertoire of latency genes (type III latency) manifest high levels of MIR155, whereas EBV-infected B-cells exhibiting a limited viral gene expression program (type I latency) do not (Jiang et al. 2006; Kluiver et al. 2006). To investigate the utility of next generation RNA sequencing (RNA-seq) in assessing a microRNA targetome, we infected the type I latency B-cell line, Mutu I, in duplicate with an MIR155 expressing retrovirus (or an empty vector control retrovirus) to achieve high MIR155 expression in a low expression background. Infections were judged to be highly efficient based on the low level of cell death after selection and the high percentage of GFP-positive cells (>60%) 2 d after infection. We therefore considered the infected cell populations to be highly polyclonal. Expression of MIR155 was found to be ∼100,000-fold higher in MIR155 transduced Mutu I cells than in control transduced Mutu I cells or in two other type I latency cell lines (Fig. 1A, Akata and Rael). Additionally, expression in MIR155 transduced Mutu I cells was comparable to endogenous MIR155 expression in the type III latency cell lines, JY, X50-7, and IB4 (Fig. 1A). The level of MIR155 in retrovirally transduced Mutu I cells was found to be sufficient to exert suppression of the previously identified MIR155 target, BACH1 (Fig. 1B; Gottwein et al. 2007; Skalsky et al. 2007; Yin et al. 2008). Furthermore, ectopic MIR155 exerted a phenotypic influence on Mutu I cells since MIR155 transduced cells formed more colonies in soft agar than their control transduced counterparts (Fig. 1C), a result that is consistent with the known oncogenic properties of MIR155. We therefore considered this system to be suitable for carrying out MIR155 transcriptome and targetome analysis using RNA-seq.
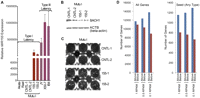
Model system. (A) Mature MIR155 was analyzed by real-time RT-PCR in the EBV type I latency cell lines—Akata, Rael, and Mutu I—and the type III latency cell lines—JY, X50-7, and IB4. CNTL-1 and CNTL-2 and 155-1 and 155-2 refer to duplicate biological replicate infections with control and MIR155 expressing retroviruses. Expression values are reported relative to the average expression levels in Akata and Rael. (B) BACH1 and ACTB (β-actin) Western blots were performed using protein extracts isolated 14 d after retroviral infections. (C) Newly established control and MIR155 expressing Mutu I cells were plated in soft agar and cultured for 2 wk prior to photo-documentation. (D) The total number of genes and the number of genes containing any MIR155 seed type that are expressed above and below the indicated RPKM cutoffs in control Mutu I cells were counted and graphed.
Read mapping
Control and MIR155 transduced Mutu I RNAs were analyzed by NGS using an Illumina Genome Analyzer II. Reads per kilobase of exon model per million mapped reads (RPKM) (Mortazavi et al. 2008) was used to score gene expression abundance. A unique challenge for working with RNA-seq data is short reads originating from exon–exon junctions in cDNAs (∼10%) that fail to map back to the reference genome because in this context, exons are separated by introns. The millions of unmapped short reads originating from exon–exon junctions, denoted as initially unmapped reads (IUMs), needed to be accounted for when calculating RPKM scores (Trapnell et al. 2009). While most aligners (named “exon aligner” hereinafter) map only short reads originating from exons (ignoring IUMs), ERANGE (Mortazavi et al. 2008), TopHat (Trapnell et al. 2009), and rSeq (Jiang and Wong 2008) (named “junction mapper” hereinafter) are among recently developed approaches to assign IUMs originating from exon–exon junctions back to individual genes.
The exon aligners and junction mappers differ vastly in algorithms and accuracy. For RNA-seq data, it is necessary to choose and combine the most accurate exon aligner and junction mapper to estimate the gene expression RPKM scores. In our analysis, alignments were first carried out using the exon aligner Novoalign (http://www.novocraft.com), with reads aligning to more than one locus excluded from further analysis. IUMs were secondly de novo aligned to the assembled IUMs using the junction mapper TopHat (Trapnell et al. 2009). IUMs mapping to exon junctions using TopHat were then combined with exon mapped reads from the Novoalign output, and RPKM calculations were carried out using University of California Santa Cruz (UCSC)–annotated gene loci (Rhead et al. 2010).
Expression analysis
Microarray technologies can readily be used to generate information regarding the relative expression of genes between samples. Due in part to cross-hybridization and sensitivity issues as well as the analog nature of microarray platforms, however, the determination of absolute transcript levels is challenging. In contrast, NGS provides a digital readout of the number of reads mapping to each gene, and Li et al. (2010a) have shown that when the mean expressed transcript length is 1 kb, 1 RPKM corresponds to roughly one transcript per cell in mouse. It is reasonable to assume that transcript levels falling below this threshold may be of limited functional significance to the overall cell population. At the very fundamental level of RPKM analysis, NGS allows the user to tentatively absolve this group of genes from playing a direct global role in altering cell signaling/phenotype in a particular system. Such genes can be set aside and perhaps considered at a later point in the context of paracrine or subpopulation effects. In control Mutu I cells, approximately half of all annotated genes were found to be expressed below 1 RPKM (Fig. 1D). Approximately 800 genes bearing MIR155 3′ UTR seed sequences were found to be expressed below 1 RPKM. Even at a 0.1-RPKM cutoff, more than 600 seed containing genes were found to fall below this threshold and are therefore likely to have limited functional significance in these cells irrespective of whether they are true MIR155 targets. Notably, a higher percentage of MIR155 seed containing genes are expressed in Mutu I B-cells compared to the percentage of all genes expressed, possibly reflecting the critical role of MIR155 in immune cell development (O'Connell et al. 2007; Rodriguez et al. 2007). Alternatively, this enrichment may simply reflect a general bias toward targeting a group of genes that are universally expressed.
Relative expression and distribution of genes with 3′ UTR MIR155 seed sequences
We next assessed whether genes containing MIR155 3′ UTR seed sequences are preferentially distributed among down-regulated genes. Genes expressed below 0.5 RPKMs were excluded from this analysis since these genes are likely of arguable functional significance and technical reproducibility begins to wane in this RPKM range (Mortazavi et al. 2008). In line with expectations, we observed preferential distribution of genes containing 7-mer and 8-mer MIR155 seed sequences in the down-regulated fractions (Fig. 2A–C). Statistical analysis demonstrated preferential distribution (P-value < 2.2 × e−16) in terms of mean and variance (for details, refer to the Materials and Methods section). Cumulative distribution plots showed enrichment of all classes of 7-mers and 8-mers in the down-regulated fractions relative to genes with no 7-mer or 8-mer seeds (P-value < 2.2 × e−16) (Fig. 2D). Notably, even among genes without MIR155 seed sequences, there is a greater number of down-regulated compared to induced genes, indicating a more global redistribution of gene expression. This is not inconsistent with previous microarray studies showing that MIR155 down-regulates more genes than it induces (Gottwein et al. 2007; Skalsky et al. 2007). Because RPKM calculations normalize to all mappable reads, these results presumably mean that MIR155 decreases the expression of genes within the lower expression class through a mechanism other than 3′ UTR 7-mer or 8-mer base-pairing. Irrespective of this issue, the enrichment for genes with 7-mer or 8-mer seeds in the down-regulated fractions relative to genes without 7-mer or 8-mer seeds is consistent with expectations based on previous microarray studies. As further evidence that RNA-seq analysis performed within expectations, we observed a down-regulation bias for genes containing 3′ UTRs with greater numbers of 7-mer or 8-mer seeds (Fig. 2E).
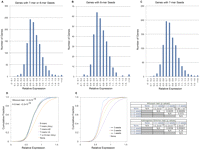
Genes containing MIR155 seed sequences are enriched in down-regulated fractions. Relative expression (expression in MIR155 transduced Mutu I cells divided by the expression in control transduced Mutu I cells) histograms for genes containing 7-mer or 8-mer (A), 8-mer (B), or 7-mer (C) seeds in their 3′ UTR. (D) Cumulative distribution of genes with different seed classes. P-values for all seed classes as determined by one-sided Wilcoxon test (Wil.) and one-sided Kologorov–Smirnov test (K-S) were <2.2 × 10⁻¹⁶. (E) Cumulative distribution of genes with different numbers of seeds. P-values for all seed number comparisons were determined using a one-sided Wilcoxon test and a one-sided Kologorov–Smirnov test and are shown in the matrix to the right.
NGS versus microarray studies
Having demonstrated a preferential distribution of genes with MIR155 seeds in down-regulated fractions, we next sought to assess the performance of next generation sequencing relative to microarray analysis. We performed differential expression analysis on our RNA-seq data set and on data sets from two previously published microarray studies in which MIR155 expression vectors were introduced into either a mouse macrophage cell line (O'Connell et al. 2008) or human 293 cells (Skalsky et al. 2007). Using only gene identifiers common to all four platforms and using a false discovery rate (FDR) of zero, 2165 genes were determined to be down-regulated by NGS, whereas 38 and 58 down-regulated genes were identified in our analysis of the two published microarray data sets (Fig. 3). NGS identified 102 down-regulated genes (FDR = 0) with 3′ UTR 8-mer seeds, while seven and two down-regulated genes with 8-mer seeds were identified in the two microarray data sets.
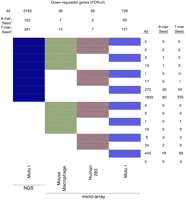
Cross-platform comparison of targetome prediction using bitmap. Down-regulated genes were identified at a false discovery rate (FDR) = 0 for NGS and each microarray platform. Each gene was determined to be significantly down-regulated (at FDR = 0) or not in each of the four platforms; down-regulated genes were assigned to one of the 24 = 16 possible clusters, represented by color/white patterns and corresponding to 16 rows in the bitmap. Numbers at the top refer to the total number of down-regulated genes for the indicated platform (summation of the number of genes represented by all colored patterns in column). Numbers to the right refer to the number of genes common to platforms with colored patterns in each respective row.
To more stringently assess the relative robustness of NGS for transcriptome and targetome studies, we generated additional control and MIR155 retrovirally transduced Mutu I cell lines and subjected four control and four MIR155 expressing cell lines to Agilent microarray analysis with dye swaps for each comparison. This resulted in better concordance relative to previous microarray studies, but the number of down-regulated genes and the number of down-regulated genes with 8-mer seed sequences were threefold and 2.6-fold lower than that observed using the NGS data set (Fig. 3).
3′ UTR reporter analysis
Luciferase reporter plasmids bearing ectopic 3′ UTRs can be used to assess microRNA targeting through the respective 3′ UTR. To further analyze the inferred targetome derived from NGS, a 3′ UTR reporter data set was generated using 170 3′ UTRs containing MIR155 7-mer or 8-mer seeds and nine 3′ UTRs with no MIR155 seeds (Fig. 4A). The relative expression of reporters lacking MIR155 seeds in cells cotransfected with a MIR155 expression vector versus a control expression vector fell in the range of 0.8 to 1.04. The relative expression of genes with MIR155 seed sequences spanned a range from 0.13 to 1.2 (Fig. 4A; Supplemental Data 1), allowing us to analyze a spectrum of MIR155 target regulatory classes.
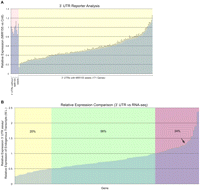
Comparison between 3′ UTR analysis and RNA-seq analysis. (A) Distribution of 3′ UTR suppression by MIR155 in reporter assays. Detailed information including gene names for each data point is presented in Supplemental Data 1. Genomic coordinates for each 3′ UTR in reporter constructs are listed in Supplemental Data 4. Values are the expression of reporters in cells cotransfected with the MIR155 expression vector versus cells cotransfected with the control expression vector divided by the expression of the control reporter cotransfected with the MIR155 expression vector versus cells cotransfected with the control expression vector. Results are based on biological triplicate transfections with control and MIR155 expression vectors. Error bars are standard error of change. (B) Comparison of relative expression observed in 3′ UTR assays with relative expression of endogenous transcripts at the whole locus level. The y-axis values are the relative expression observed in 3′ UTR assays divided by the relative expression of the endogenous transcripts (at the whole locus [W.L.] level). Genes with yellow shading are genes considered to lack full response at the endogenous transcript level. Genes with green shading fall within the expected difference range. Genes with pink shading represent candidate genes whose transcripts are regulated through additional mechanisms in Mutu I cells. The arrow indicates an inflection point in the curve.
Comparison of 3′ UTR analysis and RNA-seq analysis for MIR155 targets
A total of 150 of the 170 genes tested in the 3′ UTR reporter study were expressed at 0.5 or more RPKMs in Mutu I cells, allowing us to do comparisons with these 150 genes. Whereas changes observed by RNA-seq only reflect influences at the transcript level, changes observed in 3′ UTR assays reflect the combined influence of transcript level changes plus the influence of a microRNA on translation, the latter of which is expected to vary depending on the target. In line with expectations, the majority (76%) of genes tested showed greater than or equal suppression in 3′ UTR reporter assays relative to the RNA-seq analysis (Fig. 4B; Supplemental Data 2). Of the remaining 24% of genes that displayed greater suppression as observed by RNA-seq versus 3′ UTR analysis (values >1 in the y-axis of Fig. 4B), at least some of these genes are likely to be modulated endogenously through additional mechanisms such as transcriptional regulation (especially those to the right of the apparent inflection point; see arrow in Fig. 4B).
Although the relative contribution of translational inhibition varies from target to target, it appears that decreases in protein levels are rarely more than twice the decrease in RNA levels (Selbach et al. 2008). In our case, there are 29 genes (19%) with more than twofold greater inhibition in 3′ UTR assays compared to the inhibition observed at the endogenous transcript level (Fig. 4B; Supplemental Data 2). We operationally treated these genes as outliers that show a disproportionately lesser degree of regulation at the level of RNA-seq.
To investigate these poor performers, we first directed our attention to some of the most extreme examples, those with little or no regulation observed by RNA-seq but good regulation in our 3′ UTR analysis. Three examples—PCDH9, MAP3K10, and TAF5L (Supplemental Data 3)—proved to be illustrative of scenarios accounting for some of these targeting failures/inefficiencies. First, suppression of the PCDH9 3′ UTR in the reporter assay was found to be substantial (relative expression of 0.26), whereas there was no change in RNA-seq (relative expression of 1.0). Visualization of the read pile-ups on the USCS Genome Browser (Rhead et al. 2010) showed no evidence of reads mapping to exons 3, 4, or 5, the latter of which contains the MIR155 seed sequence (Supplemental Fig. 1). In contrast, ample read evidence supports transcription through exons 1 and 2, and splicing evidence supports an exon 1 and exon 2 junction. In this example, PCDH9 is likely to be a true target of MIR155 as evidenced by the 3′ UTR reporter analysis. The lack of any change in PCDH9 transcript levels in Mutu I cells is likely an accurate reflection of the dominant utilization of an isoform that is recalcitrant to MIR155 targeting.
Several recent studies have demonstrated 3′ UTR shortening in activated lymphocytes and in tumors (Sandberg et al. 2008; Mayr and Bartel 2009). The lack of a change in MAP3K10 transcript levels as determined by RNA-seq analysis in the face of a relative expression of 0.47 observed by 3′ UTR analysis likely reflects such a scenario. In this case, read evidence falls off upstream from the MIR155 seed sequence, a localization with proximity to the end of a shorter 3′ UTR isoform entry identified from the GenBank database (Z48615) (Supplemental Fig. 2). MAP3K10 is a representative example of a lack of responsiveness resulting from the dominant usage of an upstream poly-adenylation site.
Expression of MIR155 in Mutu I cells resulted in no observable change in overall TAF5L RNA levels despite the presence of a 3′ UTR with five MIR155 sites and a relative expression of 0.3 observed in our 3′ UTR analysis. TAF5L has two annotated isoforms with two distinct 3′ UTRs (Fig. 5A,B). In contrast to the 3′ UTR tested in our 3′ UTR analysis, the other 3′ UTRs contains no MIR155 seed sequences. Although both isoforms are expressed in Mutu I cells, RPKM analysis of exon 5 (no MIR155 seeds) and the unique region of exon 4 (5 MIR155 seeds) shows that the relative abundance of the isoforms containing seeds is ∼20-fold lower than the isoforms lacking seeds (Fig. 5C). This dominant expression of the non-seed-containing isoform can explain the lack of observable changes in overall TAF5L transcripts in MIR155 expressing Mutu I cells. To determine whether the seed-containing isoform is regulated by MIR155 in Mutu I cells, we calculated the differential expression of 3′ UTR sequences that are unique to this transcript. Whereas the relative expression of exon 4 (common to both isoforms) and exon 5 are ∼1, the relative expression of the unique region is 0.52 (Fig. 5D), which is in line with the relative expression observed for this 3′ UTR in the reporter assay (Fig. 5E). Therefore, while the dominance of the nonseed containing TAF5L isoform results in no change at the whole locus level, the seed containing isoform is specifically regulated by MIR155 in concordance with the 3′ UTR results.
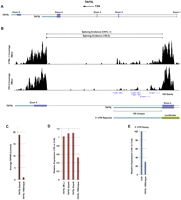
Isoform-dependent regulation of TAF5L by MIR155. (A) Gene structures of annotated TAF5L transcripts. (B) Expanded depiction of genomic sequences spanning exons 4 and 5 with accompanying read evidence. Splicing evidence indicates that reads spanning the exon 4/5 junction were found in control (CNTL-1) and MIR155 (155-2)–expressing cells. Pile-ups are a representation of the number of reads identified at each nucleotide position. (C) Quantitative analysis of read coverage (RPKMs) across exon 5 and the unique 3′ UTR sequences containing MIR155 seed sequences. RPKM calculations were performed based on the number of reads in control Mutu I cells. (D) Relative expression of TAF5L whole locus (W.L.), TAF5L exons 4 and 5, and unique 3′ UTR containing MIR155 seed sequences were calculated based on RPKM calculations performed using the appropriate respective feature annotations. Error bars are standard error of change. (E) 3′ UTR assay showing suppression of 3′ UTR containing MIR155 seed sequences. These results are extracted from the data shown in Figure 4.
Global analysis of terminal exon relative expression
We used these examples of targeting failures as a basis to design a general approach to assess the degree to which differential isoform usage contributes to mitigated suppression in Mutu I cells. We reasoned that the relative expression of terminal exons would better reflect the degree of suppression observed in 3′ UTR assays in cases in which multiple transcript isoforms account for mitigated suppression in our cells (as observed by RNA-seq analysis of the whole transcript locus). First, for genes using more than one terminal exon, the terminal exons bearing MIR155 seed sequences should, on average, show a higher degree of suppression than the whole locus. Second, for genes bearing only one terminal exon but using more than one poly(A) signal, there should be a higher relative read representation of longer MIR155 seed containing transcripts within terminal exon coordinates compared to the whole gene locus.
For this analysis, RPKM and corresponding relative expression calculations were carried out for all terminal exon loci. We first applied this terminal exon differential expression data to the group of genes (excluding PCDH9, MAP3K10, and TAF5L) showing a disproportionately greater suppression in the 3′ UTR assays relative to RNA-seq (3′ UTR relative expression/RNA-seq [transcript] relative expression <0.5). Genes with terminal exon RPKM levels of <0.5 were excluded from this analysis. Of the 23 testable genes, better concordance with 3′ UTR data was achieved with the terminal exon analysis in a little more than half of the genes (Fig. 6A). This indicates that, in these cases, the inability of MIR155 to suppress expression of these genes to its full potential is likely due to the expression of alternate nonsuppressible isoforms.
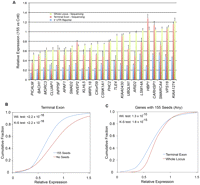
Mitigated response of endogenous genes to MIR155 is mediated in part by alternate transcript structure. (A) Comparison of relative expression at the whole locus level, the terminal exon level, and in 3′ UTR assays. The genes depicted are only those showing greater than 0.5 RPKMs in whole locus sequencing and in the terminal exon analysis. Error bars are standard error of change. (B) Cumulative distribution plot of terminal exon analysis shows a highly significant relative expression shift for genes with MIR155 seeds versus genes without seeds. P-values as determined by a one-sided Wilcoxon test (Wil.) and a one-sided Kologorov–Smirnov test (K-S) were found to be <2.2 × 10⁻¹⁶. (C) Terminal exon analysis shows significantly more down-regulation than whole locus analysis implicating transcript structure in mitigating MIR155 responses at the whole locus level. P-values were determined by a one-sided Wil. test and a one-sided K-S test.
At the global level, cumulative distribution analysis of terminal exons with or without MIR155 seed sequences shows a relative enrichment of seed containing genes in the down-regulated fractions (P-value < 2.2 × 10⁻¹⁶) (Fig. 6B), in line with the whole locus analysis shown in Figure 2. However, greater inhibition is observed at the terminal exon level than the whole locus level (Fig. 6C), indicating that isoform usage likely dictates the degree of suppression for a broad spectrum of MIR155 targets. Together, these data support the contention that for some targets, a lack of miRNA repression responses at the endogenous transcript level can be attributed to altered transcript structure.
DISCUSSION
There are now a number of tangible methods to globally assess the influence of microRNAs on cell signaling, which range from an assessment of RNA binding sites (e.g., HITS-CLIP), to an assessment of changes in RNA (e.g., microarray and NGS) and protein output (e.g., SILAC). Each of these methods has its own niche in determining the overall cascade of events leading to a microRNA's influence on cell signaling pathways. A unique advantage of NGS is its capacity to simultaneously provide accurate transcript level information while, at the same time, providing unprecedented clarity regarding transcript structure at a relatively low cost. Our data support the contention that mRNA isoform utilization is a critical determinant in specifying microRNA targeting. It also advocates transcriptome and miRNA targetome characterization at the isoform level as opposed to the typically used gene level analysis. In our experiments, transcript structure information obtained by NGS provided clarity with respect to at least half of all targeting failures and/or inefficiencies (Figs. 5, 6; Supplemental Figs. 1, 2). In addition, NGS provides the user with information on “failures to detect” changes that are attributed to low (or no) target gene expression (in our case, 39% of all genes with seed sequences were expressed below 0.5 RPKMs). NGS makes these transcriptome level targeting inefficiencies and/or failures transparent to the user.
The accumulation of publically available RNA-seq data for different cell lines and different model systems will likely accelerate rapidly in the near future. We also envision that microRNA targetomes will soon become much better elucidated. Using informatics alone, RNA structure information derived from publically available NGS sequencing databases could be merged with a well-characterized targetome data set to allow investigators to make predictions regarding the cell type–restricted targetome. This will facilitate a much better informed prediction of the functional impact of a microRNA in the context of a particular cell system.
Probes used for most nontiling microarrays are typically at or near the 3′ end of terminal exons. Such probes exclusively interrogate longer isoforms that are expected on average, to be more susceptible to microRNA targeting. This may account for some of the down-regulated genes uniquely identified in the Agilent microarray platform relative to NGS (Fig. 3). Despite the intrinsic bias that these microarrays have toward more regulatable isoforms, NGS identified 2.6 times more down-regulated genes with 8-mer seeds than our Agilent microarray data from the same cell system (FDR = 0) (Fig. 3). NGS is therefore a more robust platform to identify an inferred targetome while providing a better reflection of overall gene expression since read frequency throughout the entire locus (or through the open reading frame [ORF]) can be considered. At the same time, NGS provides the flexibility to assess isoform-specific regulation by considering read frequency through isoform-specific exons or through isoform-specific 3′ UTR sequences only.
Identification of microRNA targets is critical for understanding the initial contact point between a microRNA and an affected pathway and biological function. Nevertheless, the overall biological impact of a microRNA is manifested by the combination of these direct interactions and downstream regulatory processes that are influenced by direct interactions. An illustration of this point was educed by Gene Ontology analysis (Ingenuity Pathway Analysis software; Ingenuity) of MIR155-regulated genes. The most highly implicated biological process predicted from a gene set containing either regulated genes with MIR155 seeds or any regulated gene was the cell cycle (which may contribute to the oncogenic function of MIR155) (Supplemental Fig. 3). Despite this consistency, there are a far greater number of genes implicated in this process from the latter case (total of 92 genes) than the number of regulated genes with seeds (total of 10 genes). Many of these additional genes are likely regulated through downstream regulatory processes, yet they presumably have a contributing impact on this biological process.
To our knowledge, there is no reason to expect that indirect effects of microRNA targeting would be restricted to nontargets. The addition of an indirect component to direct targets could serve to either reinforce down-regulation, thereby exerting a stronger impact on a pathway, or provide a negative feedback loop to transiently influence a pathway. Both scenarios may explain discordant 3′ UTR reporter/NGS data that cannot be explained by altered transcript structure. KLRA1 and HAL (this study), and SMAD1 and MYO10 (see below) (Yin et al. 2010; this study), are examples of genes showing relative expression of 0.6 or less in 3′ UTR assays but whose relative expression at the endogenous RNA level was found to be ∼50% of their 3′ UTR relative expression levels. These genes appear to be true targets of MIR155, but the greater observed regulation at the transcript level suggests a reinforcing component to the regulation of these genes.
Based in part on the RNA-seq data described here, we have recently validated that MIR155 inhibits bone morphogenetic protein signaling by targeting several mediators including SMAD1 (relative expression [RNA-seq] of 0.27, FDR = 0) and SMAD5 (relative expression [RNA-seq] of 0.48, FDR = 0), which are known to activate transcription of MYO10 (relative expression [RNA-seq] of 0.3, FDR = 0) (Yin et al. 2010). Quantitative PCR analysis of all three of these genes and Western blot analysis of SMAD1 and SMAD5 showed inhibition by MIR155 in Mutu I cells (Yin et al. 2010). The targeting of the MYO10 regulators, SMAD1 and SMAD5, in addition to the targeting of the MYO10 3′ UTR, illustrates a reinforcing mechanism that leads to greater suppression of MYO10 function. While we do not currently have similar regulatory information on KLRA1 or HAL, they too are candidate genes that may be suppressed through direct and indirect mechanisms to enforce inhibition of cellular processes influenced by these genes.
MATERIALS AND METHODS
Cell culture
Mutu I and 293 cells were maintained in RPMI 1640 medium or DMEM, respectively, supplemented with 10% fetal bovine serum (FBS) plus 0.5% penicillin–streptomycin. All cells were maintained at 37°C with 5% CO2 in a tissue culture incubator.
Plasmid construction
Generation of the pMSCV-puro-GFP-miR-CNTL and pMSCV-puro-GFP-MIR155 retroviral expression vectors were previously described (Yin et al. 2008). 3′ UTR reporter plasmids were generated by PCR amplification of the relevant 3′ UTR regions from genomic DNA and cloning into the reporter vector, pMIR-REPORT-dCMV (Cameron et al. 2008). Genomic coordinates of amplified regions for these and for 3′ UTR reporters purchased from Switchgear Genomics are listed in Supplemental Data 4.
Generation of stable MIR155 expressing cell lines
Retrovirus preparations were generated through transient cotransfection of 293 cells with retroviral expression vectors plus packaging vectors. Transient transfections were performed using a modified version of the calcium phosphate precipitation procedure. Briefly, 106 HEK293 cells were plated onto 100-mm-diameter tissue culture dishes. The following day, the medium was replaced with 8 mL of fresh supplemented DMEM. Four hours later, DNA precipitates were generated by mixing 0.5 mL of 1× HEPES-buffered saline (0.5% HEPES, 0.8% NaCl, 0.1% dextrose, 0.01% anhydrous Na2HPO4, 0.37% KCl at pH 7.10) with a total of 30 μg of plasmid DNA (10 μg of retroviral vector, 10 μg of vesicular stomatitis virus G-protein expression vector, plus 10 μg of pVPACK dGI packaging vector). Thirty microliters of 2.5 M CaCl2 was added, and samples were mixed immediately after each addition. Precipitates were allowed to form for 20 min at room temperature before being added in a dropwise fashion to cells. Cells were incubated at 37°C with 5% CO2 for 16 h before the medium was replaced with 10 mL of fresh DMEM plus 10% fetal bovine serum.
Forty-eight hours later, viral supernatants were collected and subjected to one round of centrifugation followed by filtration through a 0.45-μm surfactant-free cellulose acetate filter. Infections were carried out in six-well plates with 1 mL of virus plus 4 × 10⁶ Mutu I cells (suspended in 1 mL of complete RPMI media plus 24 μg/mL polybrene) per well. Cells were spun in six-well plates at 1000g for 1 h at room temperature followed by a 4-h incubation at 37°C with 5% CO2. Mutu I cells were collected, spun down, and re-suspended in 4 mL of complete RPMI per well. Cells were cultured for 2 d prior to selection in puromycin containing media.
RNA isolation
RNAs were isolated from 107 cells and prepared using a miRNeasy kit (QIAGEN) according to the vendor's protocol. The RNA was eluted from the column using 50 μL of nuclease-free water, quantified by UV spectrophotometry, and stored at −80°C.
Real-time RT-PCR analysis of MIR155 levels
Mature MIR155 expression was assessed using a mirVana quantitative reverse-transcriptase PCR (qRT-PCR) microRNA detection kit (Ambion catalog no. 1558) with the mirVana qRT-PCR MIR155 primer set (Ambion catalog no. AM30059) and the mirVana qRT-PCR 5S rRNA primer set (Ambion catalog no. AM30302) according to the manufacturer's protocol. PCR was carried out using the following conditions: 95°C for 3 min, followed by 40 cycles of 95°C for 15 sec and 60°C for 30 sec. The expression of MIR155 in experimental samples was determined by the 2−ΔΔCT method, in which CT is the threshold cycle, ΔΔCT = ΔCT average in the type I latency cell lines, Rael and Akata, minus the ΔCT for each respective cell line, and ΔCT = CT for MIR155 minus CT for 5S rRNA (housekeeping gene).
Sequencing and base calling
Preparation of transcription libraries for sequencing on the Illumina GA2x platform was carried out using the RNA-seq kit (Part no. 1004898 Rev. A) according to the manufacturer's standard protocol. Briefly, purified RNA was fragmented via incubation for 5 min at 94°C with the Illumina-supplied fragmentation buffer. The first strand of cDNA was next synthesized by reverse transcription using random oligo primers. Second-strand synthesis was conducted by incubation with RNase H and DNA polymerase I. The resulting double-stranded DNA fragments were subsequently end-repaired, and A-nucleotide overhangs were added by incubation with Taq Klenow lacking exonuclease activity. After the attachment of anchor sequences, fragments were PCR-amplified using Illumina-supplied primers and loaded onto the GA2x flow cell. Image analysis and base calling were conducted with Firecrest and Bustard programs, respectively, and initial sequence alignment for QC purposes was performed with Eland.
Read mapping to genome and across splice sites
Each short read file (sample), in the FASTQ format, was individually aligned against the Human Reference Genome (hg19) following a two-step procedure. The whole set of short reads was initially aligned to annotated exons using an exon aligner, Novoalign (http://www.novocraft.com). We used the following parameter settings to build novoindex and run Novoalign:
-
Novoindex -k 14 -s 1 an index file name (e.g., hg37) reference genome files name (e.g., chr1.fa chr2.fa chr3.fa chr4.fa chr5.fa chr6.fa chr7.fa chr8.fa chr9.fa chr10.fa chr11.fa chr12.fa chr13.fa chr14.fa chr15.fa chr16.fa chr17.fa chr18.fa chr19.fa chr20.fa chr21.fa chr22.fa chrX.fa chrY.fa chrM.fa), where: -k 14 is the k-mer length to be used for the index; and -s 1 is the step size for the index.
-
For searching the full human genome on a 16-GB RAM server, the recommended settings are k=14, s=1 or k =15, s =2.
-
Novoalign -o SAM -f short read data file name (e.g., s_1_sequence.txt) -d file location (e.g., /Volumes/Macintosh HD 2/workspace/hg37) > s_1_novo_output, where -o SAM: the output file is in the SAM format; -f: the following file name is the input FASTQ file; and -d: directory where the output file should locate (note: users need to change it to the actual directory).
-
Other options were set to the default.
The Initially UnMapped reads are likely originated from exon–exon junctions that do not exist in the reference genome. IUMs were aligned to de novo assembled exon–exon junctions using the junction mapper, TopHat (Trapnell et al. 2009). We used the following parameter settings to run TopHat:
-
TopHat -p 6 -G reference genome file name (e.g., output.gff.txt) bowtieindex file name (e.g., bowtieindex/hg37_bowtie) short read data file name (e.g., s_1_sequence.txt): -p: Uses 6 threads to align reads; and -G: Supply TopHat with a list of gene model annotations in gff format (output.gff.txt).
-
Other options were set to the default.
Gene expression analysis using RNA-seq data
We performed a genome-wide gene expression analysis using gene annotation downloaded from the UCSC Genome Browser. The expression abundance for gene i was quantified using the RPKM measure: RPKMi = 109 × Ci/(Ni × Li), where i is the gene index, Ci is the sum of short read counts mapped to exons and exon–exon junctions, Ni represents all mapped read counts in the lane, and Li is the sum of exon lengths (Mortazavi et al. 2008).
RPKM calculation was performed using an in-house-developed graphical user interface (GUI) software, SAMMate, which is freely available from http://sammate.sourceforge.net/. SAMMate takes the inputs of exon alignment files in .SAM format (Li et al. 2009), exon–exon junction alignment file in .BED format (optional), and genome annotation in a variety of formats to export a matrix of RPKM values for annotated genes. In addition, it also calculates RPKM values for each customized genomic interval.
Analysis of Agilent MIR155 arrays
Agilent microarray data for MIR155 transduced and control Mutu I samples were imported into the R software environment, version 2.7 (The R Development Core Team 2008), using the Bioconductor package “limma” (Gentleman et al. 2004; Smyth 2005). Quality control was performed using limma functions and independently written R scripts. Within-array normalization was performed using eCADS (Dabney and Storey 2007) to correct for gene-specific dye bias. Normalized log-ratios were then analyzed using the one-class framework in SAM (Tusher et al. 2001) to identify probes differentially expressed with an estimated FDR of 0.
Statistical treatment of sequencing and published microarray data
We performed differential expression analysis for the NGS data set (this study) and two previously published microarray data sets—mouse macrophage (O'Connell et al. 2008) and Human 293 cell line (Skalsky et al. 2007). Differentially expressed genes were identified by significance analysis of microarrays (SAM) (Tusher et al. 2001). SAM is a statistical technique in which significantly differentially expressed genes between control and miRNA-155 transfected cell lines can be identified by assimilating a set of gene-specific t-tests. Briefly, SAM computes a nonparametric score for each gene by dividing the between-group difference of (normalized log) gene expression levels and adjusted within-group gene expression variance across the whole genome. The score is then compared with random permutation scores that are computed in the same manner as the original score but based on randomly sampled gene expressions. The per-gene P-value was calculated by the percentage of scores that are larger than the original score in a fixed number of simulations, say, 1000. The per-gene P-values were further adjusted to the false discovery rate (FDR) (Storey and Tibshirani 2003), indicating the percentage of genes identified as being significant by chance alone. Here, we have used SAM's two-class analysis function to call significantly differentially expressed genes with an FDR of 0.
Cross-species gene mapping
Cross-species gene mapping between human and mouse gene orthologs was done using the mapping file downloaded from http://www.informatics.jax.org/mgihome/projects/aboutmgi.shtml.
Cross-platform comparison of targetome prediction using bitmap
To systematically compare the technical capabilities of NGS and microarray platforms in detecting down-regulated genes, we used only gene identifiers that are common to all four platforms. Among these gene identifiers, we identified a down-regulated gene list with FDR = 0 for each platform. Each of the genes was determined to be significantly down-regulated (at FDR = 0) or not in each of the four data sets; all genes were assigned to one of the 24 = 16 possible clusters, which is represented by color/white patterns and corresponding to 16 rows in the bitmap. The bitmap can be viewed as a generalized Venn Diagram to compare more than three groups. For example, the eighth row corresponds to 1859 (total) and 102 (8-mer seed containing) significantly down-regulated genes identified at an FDR = 0 in NGS data.
Statistical comparison of a pair of populations
We used a rank-based two-sample one-sided Wilcoxon test to test the equality of two population means (H0) versus one is greater than another (Hα). The R function wilcox.test() was used to perform this test.
We used Levene's test to test the equality of two population variances (H0) versus not equal (Hα). The R function levene.test() was used to perform this test.
We also used a Kolmogorov–Smirnov test to test the overall equality of two populations (H0) versus not equal (Hα). The R function ks.test() was used to perform this test.
In all the above tests, small P-values (e.g., < 0.05) will reject the H0.
3′ UTR-luciferase reporter analysis
For reporter analysis, 3.75 μg of either the control (pMSCV-puro-GFP-miR-CNTL) or MIR155 (pMSCV-puro-GFP-MIR155) expression vector was cotransfected with 0.25 μg of the appropriate pMIR-REPORT-dCMV or pGL4.11 3′ UTR reporter plasmid into 1 × 10⁶ Mutu I cells using Lipofectamine 2000 (Invitrogen). Cells were harvested 48 h post-transfection and analyzed using the Promega firefly luciferase assay. The values reported are the expression change of a given 3′ UTR relative to change in the control reporter.
Western blot analysis
Cells were lysed by suspending them in 1× SDS-PAGE loading buffer and heated for 20 min at 95°C to shear genomic DNA. Protein concentrations were determined using an ND-1000 spectrophotometer (NanoDrop). Twenty-five micrograms of total protein was loaded in each well and separated on a 4%–20% Tris-HCl Criterion Precast gel (BioRad, catalog no. 345-0033) and transferred to a nitrocellulose transfer membrane (Whatman Schleicher & Schuell, catalog no. 10 401196). The membranes were incubated overnight at 4°C with primary antibody in Tris-buffered saline (TBS) containing 5% low-fat powdered milk, washed three times (for 10 min each) in TBS buffer, incubated for 1 h at room temperature with the appropriate secondary antibody in TBS buffer containing 5% low-fat powdered milk, washed three times (for 10 min each) in TBS buffer, and then subjected to image analysis using an Odyssey infrared imaging system (Li-Cor Biosciences). Antibodies recognizing BACH1 and beta-ACTB (β-actin) were purchased from Santa Cruz Biotech (goat anti-BACH1, catalog no. sc-14700; goat anti-ACTB, catalog no. sc-1616). Donkey anti-goat secondary antibody was purchased from Li-COR Biosciences (IRDye 680 Donkey anti-goat IgG, catalog no. 926-32224).
Soft agar assay
Three thousand cells were plated onto each well of a 6-well tissue culture plate containing 0.5% DNA grade agar containing 1× RPMI 1640 media plus 10% FBS on the bottom layer and 0.35% DNA-grade low-melting-point agarose (in 1× RPMI 1640 media plus 10% FBS) on the top layer. The following day, 2 mL of media (RPMI 1640 + 10% FBS) was added to each well. Cells were incubated for 21 d at 37°C, 5% CO2 in a tissue culture incubator, at which time pictures were taken.
Accession numbers
Sequencing data will be available in the NCBI Short Read Archive, SRA011001. Microarray data submission to NCBI GEO database is in process.
SUPPLEMENTAL MATERIAL
Supplemental material can be found at http://www.rnajournal.org.
ACKNOWLEDGMENTS
This work was supported by the NIH grants CA124311, CA130752, and CA138268 to E.K.F.; LM010137 to D.Z.; NIH ARRA administrative supplement providing summer research experiences for students and science educators (CA CA130752-S1 to E.K.F.); and an NIH COBRE (P20 RR020152 to the program director, Prescott Deininger).
Footnotes
-
Reprint requests to: Erik K. Flemington, Department of Pathology, Tulane University Health Sciences Center and Tulane Cancer Center, 1430 Tulane Avenue, New Orleans, LA 70112, USA; e-mail: eflemin{at}tulane.edu; fax: (504) 988-1167; or Dongxiao Zhu, Department of Computer Science, University of New Orleans, Lakefront, 2000 Lakeshore Drive, New Orleans, LA 70148, USA; e-mail: dzhu{at}cs.uno.edu; fax: (504) 280-2406.
-
Article published online ahead of print. Article and publication date are at http://www.rnajournal.org/cgi/doi/10.1261/rna.2194910.
- Received March 25, 2010.
- Accepted May 14, 2010.
- Copyright © 2010 RNA Society
Freely available online through the RNA Open Access option.




