


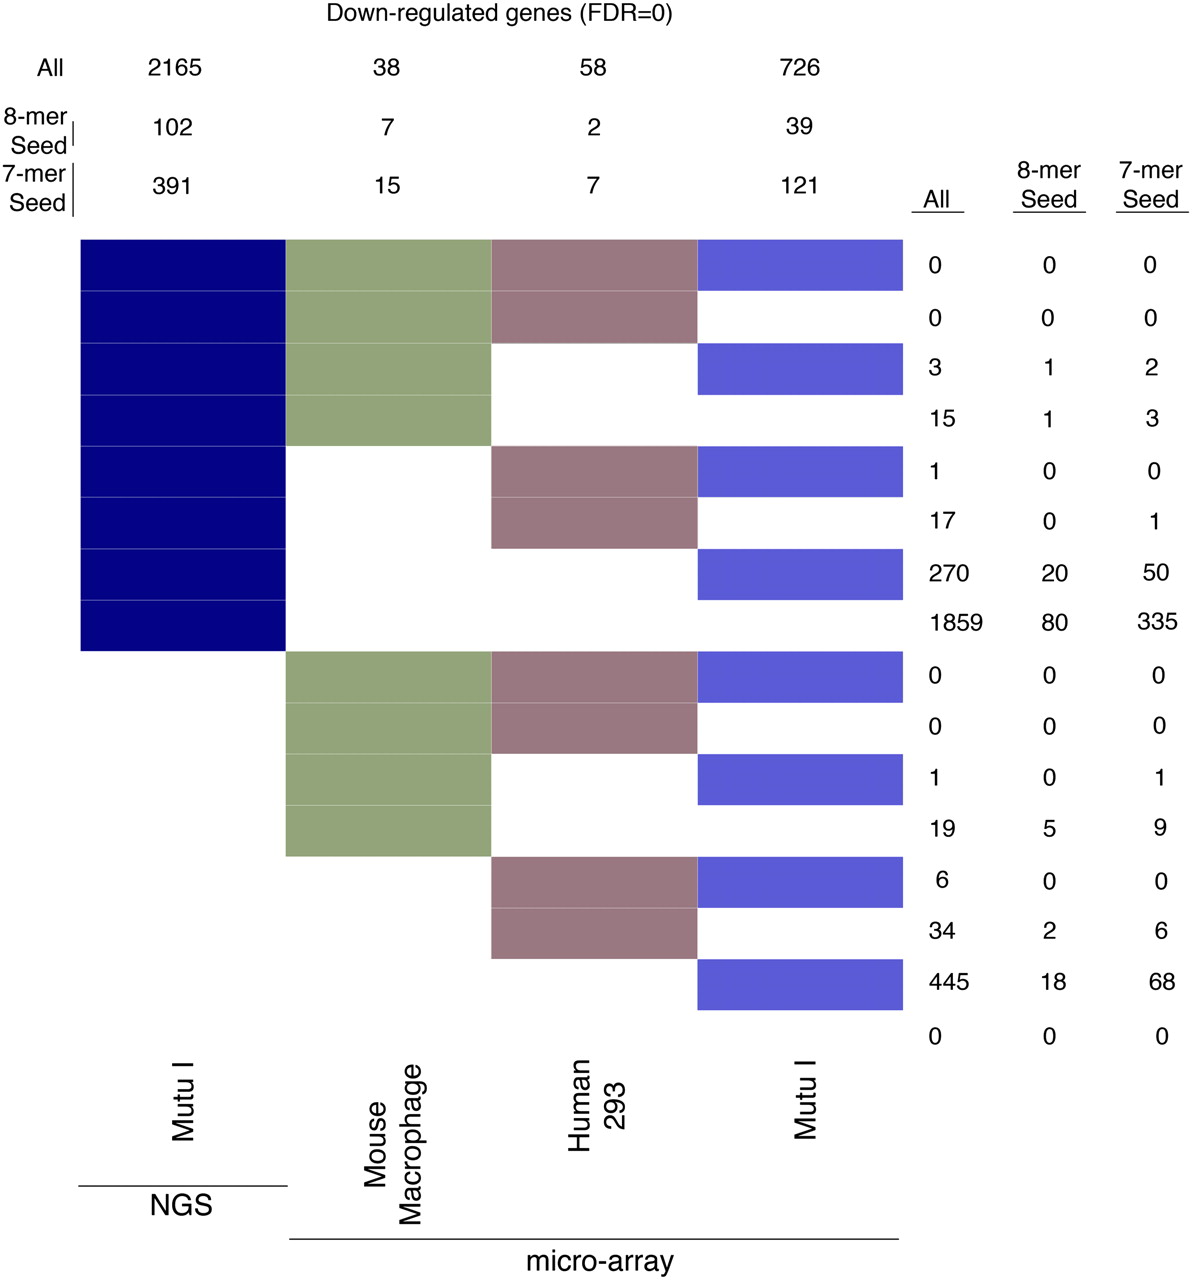
Cross-platform comparison of targetome prediction using bitmap. Down-regulated genes were identified at a false discovery rate (FDR) = 0 for NGS and each microarray platform. Each gene was determined to be significantly down-regulated (at FDR = 0) or not in each of the four platforms; down-regulated genes were assigned to one of the 24 = 16 possible clusters, represented by color/white patterns and corresponding to 16 rows in the bitmap. Numbers at the top refer to the total number of down-regulated genes for the indicated platform (summation of the number of genes represented by all colored patterns in column). Numbers to the right refer to the number of genes common to platforms with colored patterns in each respective row.




