


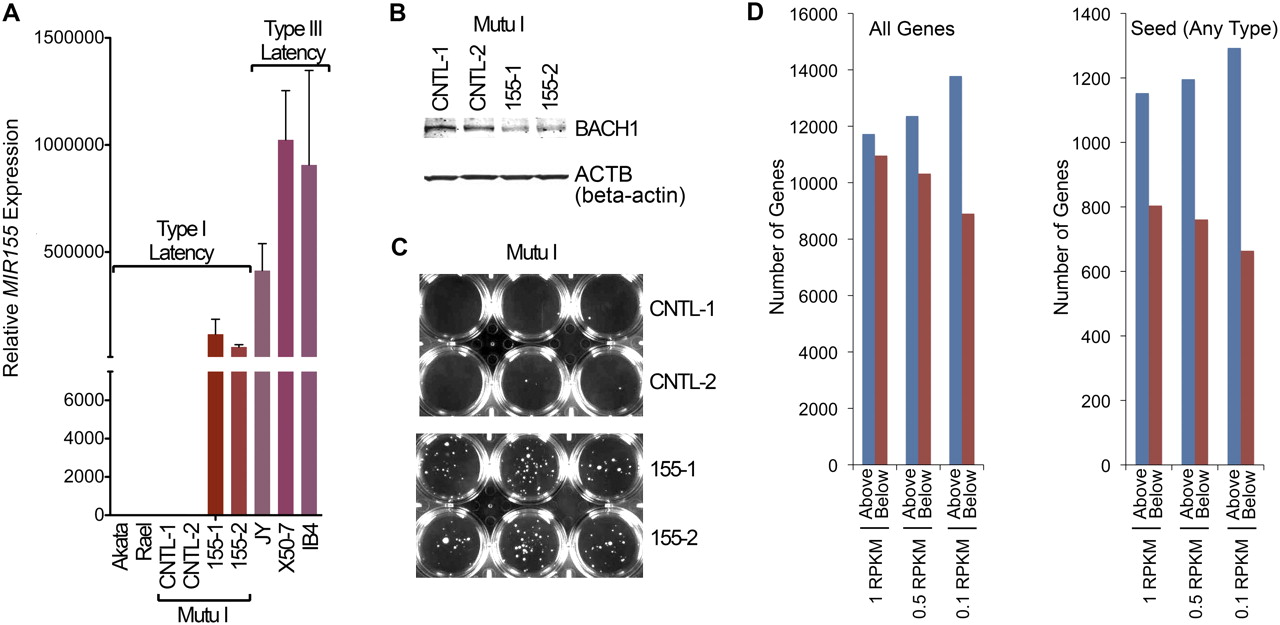
Model system. (A) Mature MIR155 was analyzed by real-time RT-PCR in the EBV type I latency cell lines—Akata, Rael, and Mutu I—and the type III latency cell lines—JY, X50-7, and IB4. CNTL-1 and CNTL-2 and 155-1 and 155-2 refer to duplicate biological replicate infections with control and MIR155 expressing retroviruses. Expression values are reported relative to the average expression levels in Akata and Rael. (B) BACH1 and ACTB (β-actin) Western blots were performed using protein extracts isolated 14 d after retroviral infections. (C) Newly established control and MIR155 expressing Mutu I cells were plated in soft agar and cultured for 2 wk prior to photo-documentation. (D) The total number of genes and the number of genes containing any MIR155 seed type that are expressed above and below the indicated RPKM cutoffs in control Mutu I cells were counted and graphed.




