


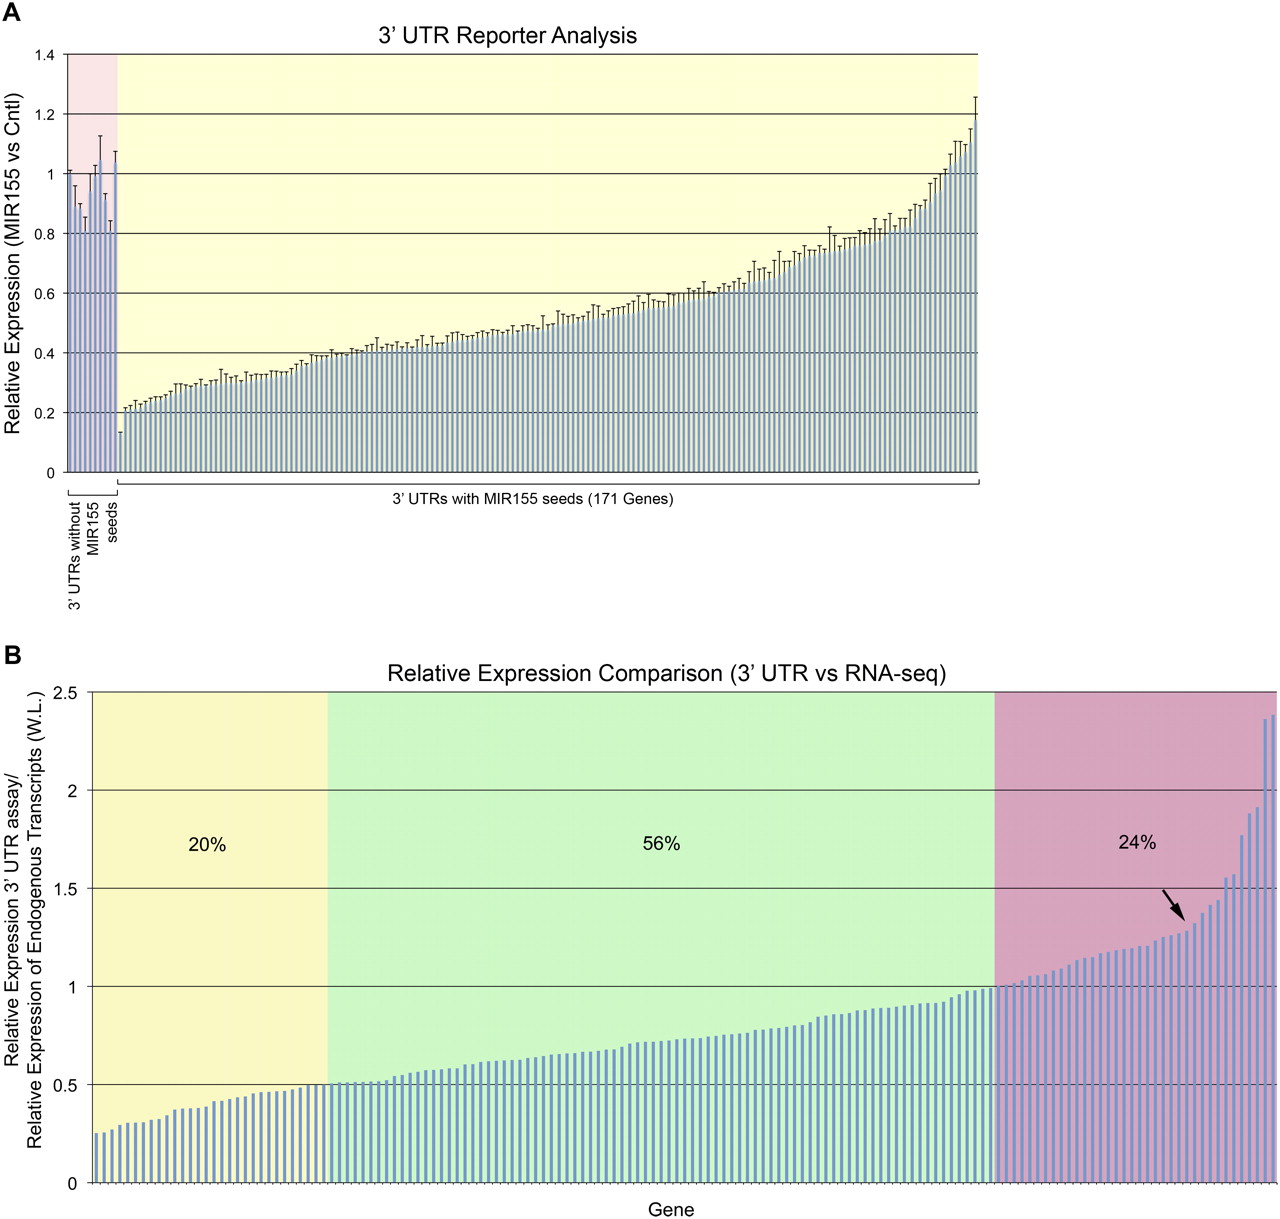
Comparison between 3′ UTR analysis and RNA-seq analysis. (A) Distribution of 3′ UTR suppression by MIR155 in reporter assays. Detailed information including gene names for each data point is presented in Supplemental Data 1. Genomic coordinates for each 3′ UTR in reporter constructs are listed in Supplemental Data 4. Values are the expression of reporters in cells cotransfected with the MIR155 expression vector versus cells cotransfected with the control expression vector divided by the expression of the control reporter cotransfected with the MIR155 expression vector versus cells cotransfected with the control expression vector. Results are based on biological triplicate transfections with control and MIR155 expression vectors. Error bars are standard error of change. (B) Comparison of relative expression observed in 3′ UTR assays with relative expression of endogenous transcripts at the whole locus level. The y-axis values are the relative expression observed in 3′ UTR assays divided by the relative expression of the endogenous transcripts (at the whole locus [W.L.] level). Genes with yellow shading are genes considered to lack full response at the endogenous transcript level. Genes with green shading fall within the expected difference range. Genes with pink shading represent candidate genes whose transcripts are regulated through additional mechanisms in Mutu I cells. The arrow indicates an inflection point in the curve.




