


Coupled RNA polymerase II transcription and 3′ end formation with yeast whole-cell extracts
Abstract
RNA polymerase II (RNAP II) transcription and pre-mRNA 3′ end formation are linked through physical and functional interactions. We describe here a highly efficient yeast in vitro system that reproduces both transcription and 3′ end formation in a single reaction. The system is based on simple whole-cell extracts that were supplemented with a hybrid Gal4-VP16 transcriptional activator and supercoiled plasmid DNA templates encoding G-less cassette reporters. We found that the coupling of transcription and processing in vitro enhanced pre-mRNA 3′ end formation and reproduced requirements for poly(A) signals and polyadenylation factors. Unexpectedly, however, we show that in vitro transcripts lacked m7G-caps. Reconstitution experiments with CF IA factor assembled entirely from heterologous components suggested that the CTD interaction domain of the Pcf11 subunit was required for proper RNAP II termination but not 3′ end formation. Moreover, we observed reduced termination activity associated with extracts prepared from cells carrying a mutation in the 5′-3′ exonuclease Rat1 or following chemical inhibition of exonuclease activity. Thus, in vitro transcription coupled to pre-mRNA processing recapitulates hallmarks of poly(A)-dependent RNAP II termination. The in vitro transcription/processing system presented here should provide a useful tool to further define the role of factors involved in coupling.
Keywords
INTRODUCTION
In order to function as templates for protein synthesis, the primary RNAP II transcripts must experience the addition of a 7-methyl-guanosine (m7G) cap to the 5′ end and receive a poly(A) tail at the 3′ end. Interestingly, these pre-mRNA processing reactions are physically and functionally linked to transcription via the carboxyl-terminal domain (CTD) of the largest subunit of RNAP II (McCracken et al. 1997). During the transcription cycle, the association of capping and 3′ end formation factors, respectively, is controlled in a dynamic fashion through differential phosphorylation of the CTD (Buratowski 2009). Phosphorylation on serine-5 following the transcription initiation promotes the association of capping factors (Komarnitsky et al. 2000; Schroeder et al. 2000), whereas phosphorylation of serine-2 at 3′ ends of genes coincides with the association of the 3′ end formation machinery (Ahn et al. 2004).
RNA synthesis by RNAP II is a highly processive reaction, and its termination is intimately linked to 3′ end formation (Proudfoot 2004; Richard and Manley 2009). RNA signals on the emerging nascent transcript determine the site of poly(A) addition and trigger the subsequent termination of RNAP II transcription (Logan et al. 1987). Two major models have been proposed that outline the mechanistic details of the molecular events that are thought to occur during termination. On the one hand, the “allosteric” model predicted that following the transcription of a poly(A) signal the properties of RNAP II change, possibly due to the dissociation of processivity factors or the association of termination factors (Logan et al. 1987). The “torpedo” model, on the other hand, relies on the endonucleolytic cleavage associated with the 3′ end formation reaction (Connelly and Manley 1988). Cleavage provides an entry site for 5′-3′ exonucleases to degrade the downstream cleavage product and to transduce to RNAP II that a poly(A) signal has been recognized. Work from many different laboratories provided evidence supporting both models (Richard and Manley 2009). Thus, it seems likely that a combination of allosteric and torpedo models and variations thereof ensure the efficient termination of RNAP II at different genes (Luo et al. 2006; Gilmour and Fan 2008).
The factors involved in pre-mRNA 3′ end formation display a remarkable complexity, and many open questions remain concerning the function of the individual subunits (Zhao et al. 1999; Mandel et al. 2008). In Saccharomyces cerevisiae, the major activities required to reconstitute 3′ end formation in vitro are contained within the cleavage factors IA and IB (CF IA and CF IB) (Kessler et al. 1996) and the cleavage and polyadenylation factor (CPF) (Dichtl et al. 2002). CF IB contains a single polypeptide, Nab4/Hrp1 (Kessler et al. 1997; Minvielle-Sebastia et al. 1998), and CPF consists of some 15 different subunits (Dichtl et al. 2002; Nedea et al. 2003). The four proteins Rna14, Rna15, Clp1, and Pcf11 constitute CF IA (Minvielle-Sebastia et al. 1997). Rna14 and Rna15 form a tight heterodimer and are involved in poly(A) site recognition in part via the RRM RNA binding domains of the Rna15 protein (Minvielle-Sebastia et al. 1994). Clp1 is a ATP binding protein that was found to carry 5′ RNA kinase activity in humans and archaea (Weitzer and Martinez 2007; Jain and Shuman 2009); however, no such activity was found associated with the yeast protein (Noble et al. 2007; Ramirez et al. 2008). The Pcf11 protein directly tethers CF IA to the RNAP II CTD via an N-terminal CTD interaction domain (CID) (Amrani et al. 1997; Sadowski et al. 2003; Meinhart and Cramer 2004; Zhang et al. 2005).
In vitro systems were instrumental to dissect the machineries and mechanisms involved in transcription and pre-mRNA 3′ end formation. Yeast transcription was studied in vitro with extracts and G-less reporter constructs to analyze the mechanisms of initiation (Lue et al. 1989; Woontner and Jaehning 1990; Woontner et al. 1991) and elongation (Rondon et al. 2003, 2004). In contrast, 3′ end formation reactions with mammalian nuclear extracts or yeast extracts are usually supplemented with synthetic, radioactively labeled precursor molecules (Moore and Sharp 1985; Butler and Platt 1988). Since optimal biochemical conditions for transcription and processing reactions in vitro can vary substantially, the establishment of coupled systems was achieved so far only with labor intensive nuclear extracts obtained from mammalian sources (Tran et al. 2001; Adamson et al. 2005; Kazerouninia et al. 2010) and yeast (Hyman and Moore 1993). A coupled system on the basis of whole-cell yeast extracts was previously introduced but remained largely uncharacterized (Bucheli and Buratowski 2005).
Here, we describe a highly efficient yeast transcription system that supports pre-mRNA 3′ end formation. The reactions are based on whole-cell extracts (WCEs) and G-less reporter constructs that are driven by a Gal4-VP16 transcriptional activator. With CF IA depletion and reconstitution experiments, we find that the CID of Pcf11 is required for in vitro termination efficiency but not 3′ end formation. Analysis of mutant extracts and chemical inhibition of 5′-3′ exonuclease activity supports a role for the Rat1 exonuclease in in vitro termination. Thus, this coupled in vitro transcription/processing system recapitulates hallmarks of RNA synthesis in vivo. We expect this approach to be useful for the further dissection of protein factors mediating the functional coupling of transcription and pre-mRNA processing.
RESULTS AND DISCUSSION
An improved G-less cassette transcription system
Yeast WCEs were previously used to study transcription initiation (Lue et al. 1989; Woontner et al. 1991) and elongation (Rondon et al. 2004). We adapted and modified these approaches in order to establish a coupled system that reproduced an entire transcription cycle and associated 3′ end formation reactions with WCEs that were supplemented with supercoiled plasmid templates and the Gal4-VP16 transcriptional activator. Transcription reactions with yeast extracts are frequently accompanied by the accumulation of unspecific reaction products (Lue et al. 1989; Woontner and Jaehning 1990). To allow the direct analysis of radioactive transcription products on gels, we chose therefore to analyze templates containing stretches devoid of G residues (G-less cassettes) (Lue et al. 1989). In vitro transcription products are treated with RNase T1 that cleaves 3′ of guanosines, leaving only RNase T1-resistant G-less RNAs intact, which can then be resolved on a denaturing gel. Figure 1A depicts the features of the analyzed template on which transcription was driven by a GAL4-CYC1 hybrid promoter. The encoded transcript carries five G-less stretches with variable length (84, 100, 120, 131, and 145 bp). The 84 cassette is placed right at the transcription start, and its relative abundance compared with the 100 cassette gives a measure for the efficiency of transcription elongation (Rondon et al. 2003). The relative abundance of downstream cassettes (120, 131, and 145) compared with the transcription of the 100 and 84 cassettes, respectively, is influenced by termination of RNAP II transcription. Furthermore, degradation of the downstream products arising from 3′ end cleavage of pre-mRNA transcripts may be promoted through interaction of the 5′-3′ exonuclease Rat1 with the 3′ end formation machinery (Luo et al. 2006).
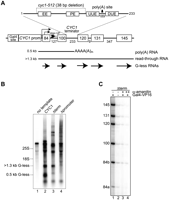
In vitro transcription/processing with yeast whole-cell extracts. (A) Schematic presentation of transcription templates used to study the transcription/processing in vitro. The main features of the construct include Gal4 binding sites, a CYC1 promoter, and five G-less cassettes. Numbers indicate the length of the cassettes and distances separating those, respectively. CYC1 terminator sequences were inserted between the 100 and 120 cassettes; also indicated are specific sequence elements (EE, the efficiency element; PE, positioning element; UUE, upstream U-rich element; DUE, downstream U-rich element; and the poly(A) site). The cyc1-512 mutation encompasses a 38-bp deletion of sequence elements as indicated. The products of in vitro transcription are ∼0.5 kb in length in case of polyadenylated RNA and >1.3 kb in case of read-through transcripts. Between 84 and 100 G-less cassettes, the site of complementarity for oligo UP (arrow tail) is indicated that was used for linker-mediated 3′ end analysis (see Fig. 3D). (B) RNAs obtained from in vitro transcription reactions with wild-type extract and Gal4-VP16 activator were separated on 1.2% denaturing formaldehyde agarose gel, transferred to Hybond N+ membrane, and exposed to a Fujifilm imaging plate. Supercoiled plasmid template carrying reporter construct with the CYC1 terminator (lane 2), no terminator (lane 3), or no GAL4-CYC1 promoter (lane 4) was analyzed; template was omitted in lane 1. (C) In vitro transcription reaction with wild-type extract, Gal4-VP16 activator, and a supercoiled plasmid template carrying the reporter construct without terminator (lane 1). RNase T1 digestion of transcription products released G-less RNAs, which were analyzed by denaturing gel-electrophoresis. The length of the RNAs is indicated on the left. The Gal4-VP16 transcriptional activator was omitted in the reaction shown in lane 2. Reactions analyzed in lanes 3,4 contained 10 and 20 ng/μL α-amanitin, respectively.
Initially, we optimized reaction conditions in order to support both transcription and processing activities associated with our extracts. Since 2% (w/v) polyethylene glycol 8000 (PEG 8000) is important for efficient in vitro 3′ end processing (Butler and Platt 1988; Minvielle-Sebastia et al. 1994), we included this reagent in the reactions. Furthermore, we found that substitution of KCl (80–120 mM, as was used by Rondon et al. 2003) by 125 mM K-glutamate/5 mM KAc enhanced in vitro transcription. The combined adjustments of reaction conditions increased transcriptional activity of the extracts more than threefold compared with the initially tested conditions (data not shown). Figure 1B shows products of a typical transcription reaction before RNase T1 digestion. The template carrying the CYC1 terminator sequence (Fig. 1B, lane 2) gave rise to the expected 0.5-kb transcript and an additional 1.3-kb RNA that most likely resulted from transcriptional read-through at the CYC1 terminator because it was also observed with a construct lacking terminator sequences (Δterm; lane 3). Additional unspecific and mostly high-molecular-weight RNAs can be observed in the absence of an added template (lane 1) or with a construct lacking promoter sequences (lane 4). This demonstrated the necessity for RNase T1 digestion to allow the specific analysis of G-less RNAs. Figure 1C shows the RNase T1–resistant products obtained with the construct lacking terminator sequences. We observed the accumulation of six RNAs that were derived from the five G-less cassettes (lane 1). The 84 cassette gave rise to two signals (84a and 84b), whereby the shorter RNA resulted from alternative initiation of RNAP II within the cassette (Hahn et al. 1985; Lue et al. 1989). Efficient transcription required the presence of the Gal4-VP16 transcriptional activator (lane 2), and the reactions were sensitive to the RNAP II inhibitor α-amanitin (lanes 3, 4). Thus, transcription of all cassettes resulted from RNAP II initiation at the GAL4-CYC1 hybrid promoter. In this work, we have not determined the number of transcripts that was obtained from each template, but the Jaehning laboratory previously reported the synthesis of 0.018 transcripts per template within 30 min under comparable conditions (Woontner et al. 1991). However, the contribution of RNA degradation was not analyzed in these studies, and we showed that RNA stability significantly affected the accumulation of products (see Fig. 5 below). Thus, steady-state in vitro analyses may have underestimated the number of initiation events per template, and it remains a possibility that in vitro transcription may support multiple rounds of initiation from the same template.
In vitro transcription coupled to 3′ end formation
Next, we analyzed kinetics of G-less transcription of the Δterm construct with wild-type WCE (Figure 2A, lanes 17–24). Interestingly, we observed that the ratio of 100/84 cassettes increased from 40% to 100% during the first 60 min of the time-course (Figure 2B, right-hand bars). Assuming an elongation rate of 1–2 kb/min that is typically measured for RNAP II in vivo (Mason and Struhl 2005; Boireau et al. 2007), we would have expected that RNAP II completed the transcription of both cassettes (311 nt distance) within the first 5 min of the reaction. The synthesis of the first 311 nt of the transcript may therefore occur with a reduced efficiency, and we speculate that this may be due, for example, to RNAP II pausing. Our finding that G-less RNAs do not carry a m7G-cap (see Fig. 5, below) may affect early elongation and thus may be related to this observation. In contrast, the 120/100 and 131/100 ratios, and to a lesser extent the 145/100 ratio, remained constant during the time-course. Thus, early elongation may have a limited transcription efficiency, and the rate of transcription may vary considerably along the template. In an alternative scenario, RNA degradation may restrict the accumulation of G-less cassettes and, in combination with increasing processivity of RNAP II during the time-course (i.e., the increased ability of the enzyme to remain associated with the template), could also positively affect the ratio of the 100/84 cassettes. Thus, the possibility remains that early transcribed RNAs (that were synthesized at lower processivity) are already largely degraded when RNA synthesis takes place with higher processivity at the later time points. We do not favor this explanation for two reasons: (1) low processivity of RNAP II transcription would be expected to result in dissociation of the enzyme also within G-less cassettes and should therefore produce a smear of G-less signals that is clearly not observed in our experiments, and (2) it is unclear why the properties of RNAP II (i.e., its processivity) would change during the time-course.
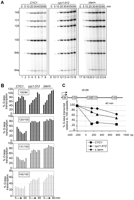
In vitro termination is dependent on functional poly(A) signals. (A) Time-course of in vitro transcription reactions with wild-type extracts and templates carrying wild-type CYC1, mutant cyc1-512, or no terminator sequences (Δterm) as indicated. (B) Quantification of the gels shown in A. The obtained signals were normalized to uridine content of the cassettes and presented as a percentage of G-less transcription. Transcriptional elongation efficiency is indicated by the 100/84 ratio. Termination and 3′ end formation is reflected by the 120/100, 131/100, and 145/100 signals. (C) Presentation of the 40-min time point of the time-course experiments shown in A as a function of the distance of G-less transcription relative to the site of poly(A) addition, which has been fixed at “0” bp. The signal obtained with the 100-bp cassette was fixed at 100%; the 120/100, 131/100, and 145/100 ratios provide the other data points.
We also observed an overall reduction of G-less transcription with the increasing length of the RNA. About 80% of polymerases that reached the 100 cassette continued synthesis of the 120 and 131 cassettes, while only 60% of those polymerase molecules made it past the 145 cassette. This apparent tendency of RNAP II to dissociate from the template may reflect in vitro transcription conditions and contrasts the high processivity observed with RNAP II in vivo (Mason and Struhl 2005).
Introduction of terminator sequences from the well-studied iso-1-cytochrome c (CYC1) gene between the 100 and 120 cassettes (Fig. 1A) resulted in the reduced accumulation of G-less cassettes originating from sequences downstream from the terminator (Fig. 2A, lanes 1–8), suggesting that 3′ end formation and termination occurred in vitro. Typically, the amount of downstream 120, 131, and 145 cassettes observed was ∼25%–40% relative to the 100 cassette (Fig. 2B, left-hand bars; C). The cyc1-512 mutation carries a 38-bp deletion, including efficiency and positioning elements involved in 3′ end formation (Fig. 1A); this mutation is known to confer both defective 3′ end formation in vitro (Butler and Platt 1988) and transcriptional read-through in vivo (Zaret and Sherman 1982). To test whether the reduction of G-less transcripts downstream from the CYC1 terminator was due to 3′ end formation and/or poly(A) driven termination, we analyzed constructs that carried a mutant cyc1-512 terminator. As shown in Figure 2A, this construct behaved similar to the Δterm construct, indicating that the 3′ end formation/termination was indeed defective (lanes 9–16). However, downstream cassettes' levels were somewhat reduced compared with the Δterm construct (Fig. 2C), a finding that is consistent with the previous observation that some residual termination activity remains associated with the cyc1-512 allele (Zaret and Sherman 1982).
In vitro 3′ end formation/termination depends on poly(A) factors
Next, we wanted to demonstrate the requirement of poly(A) factors for in vitro 3′ end formation/termination. For this purpose, we produced extracts from strains expressing Rna15 and Pfs2 that are fused at the amino terminus to a ProtA-tag and that stably associate with CF IA and CPF, respectively. The ProtA-fusion proteins were depleted from the extracts by two consecutive rounds of adsorption to IgG-Sepharose; the bound factors were retrieved by tobacco etch spot virus (TEV) protease cleavage and used for complementation analyses (Fig. 3A). Western blot analysis of extracts before and after depletion revealed a substantial removal of the ProtA-fusion proteins (estimated >90%) (Fig. 3A). In vitro transcription reactions with nondepleted extracts had low levels of downstream cassettes with the wild-type CYC1 terminator (Fig. 3B, lanes 1, 7) but not with the cyc1-512 mutant (lanes 2, 8), as expected. In contrast, both extracts depleted for the ProtA-tagged proteins displayed the prevailing signal strength associated with downstream 120, 131, and 145 cassettes (lanes 3, 9). This effect was a direct consequence of the removal of the 3′ end formation factors since add-back of partially purified CF IA and CPF, respectively, to the depleted extracts restored the activity (Fig. 3B, lanes 4–6, 10–12).
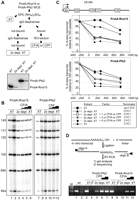
Requirement for 3′ end formation factors for coupled in vitro transcription and processing. (A) Scheme of whole-cell extract (WCE) preparation and factor depletion employed in this work for CF IA–associated ProtA-tagged Rna15 and CPF-associated ProtA-tagged Pfs2, respectively. Also shown is a Western blot of ProtA-tagged Rna15 and ProtA-tagged Pfs2 proteins to control the efficiency of factor depletion. (B) In vitro transcription/processing reactions with constructs carrying the wild-type CYC1 terminator and with extracts before (lanes 1,7) and after (lanes 3–6,9–12) depletion of the indicated ProtA-tagged proteins as described in A. One, two, and four microliters of CF IA and CPF factor, respectively, was added back to depleted extracts (lanes 4–6,10–12). For control, reactions were also done with nondepleted extracts on templates carrying the mutant cyc1-512 terminator (lanes 2,8). (C) Quantification of results obtained in B. (D) Schematic representation of the procedure to analyze 3′ end formation. Nonradioactive in vitro transcription reactions were performed, and the obtained RNAs were used to add a 5′ phosphorylated DNA oligonucleotide linker with T4 RNA ligase. The ligation products were reverse transcribed and amplified by PCR. The employed PCR primers were oligo UP (complementary to region between the 84 and 100 cassette; see Fig. 1A) and oligo B, which is complementary to the DNA linker. The amount of PCR product obtained with this method reflects the efficiency of pre-mRNA 3′ end cleavage. Analyzed were a wild-type extract on the CYC1 terminator (lane 1) and cyc1-512 mutant (lane 2) templates. ProtA-tagged Pfs2 and ProtA-tagged Rna15 extracts were analyzed before (lanes 3,4,8,9) and after (lanes 5–7,10–12) factor depletion. Two and four microliters of CPF and CF IA factor, respectively, was added back to depleted extracts (lanes 6,7,11,12). To ensure that signals were derived from RNA, reverse transcriptase enzyme was omitted from reactions analyzed in lanes 4,9.
To correlate the defects observed in the absence of 3′ end formation factors with 3′ end cleavage and polyadenylation, we analyzed RNA obtained from nonradioactive in vitro transcription reactions, using a ligation-based RT-PCR technique as outlined in Figure 3D; this procedure will be described in detail elsewhere (RA Alexander, M Kos, MC Robert, B Dichtl, JD Barrass, T Obtulowicz, M Koper, I Karkusiewicz, L Mariconti, D Tollervey, et al., in prep.). The protocol starts with the attachment of a 5′ phosphorylated DNA oligonucleotide linker to the available 3′ OH groups by T4 RNA ligase. The resulting ligation products are then reverse transcribed using a primer that anneals to the linker oligonucleotide, and amplified by PCR with primers that anneal upstream of the terminator (oligo UP) (Fig. 1A) or to the linker sequence. With this approach, the efficiency and the site of 3′ end cleavage as well as the length of the added poly(A) tail can be determined. RT-PCR products obtained from in vitro transcription of the construct carrying the CYC1 terminator gave the expected DNA fragment of ∼500 bp length (Fig. 3D, lane 1). DNA sequencing of 12 independent 3′ ends revealed that 3′ end cleavage in vitro occurred in 11 cases between the C↓A at position 504 relative to the CYC1 translational start codon and thus at the same position as in cells (Guo et al. 1995). All 3′ ends also carried poly(A) stretches that varied in length between 16 and 68 adenosine residues, showing that polyadenylation and poly(A) length control occurred efficiently in our in vitro system (see also Fig. 6B, below). The cyc1-512 construct gave only very small amounts of amplified product with slightly reduced length due to the 38-bp deletion within the poly(A) signal sequences (Fig. 3D, lane 2). This indicated that some residual cleavage occurred at the mutant terminator in vitro. Extracts depleted for ProtA-tagged Pfs2 and ProtA-tagged Rna15 gave reduced amounts of PCR product (Fig. 3D, cf. lanes 3, 5, as well as lanes 8, 10), reflecting loss of the 3′ end cleavage activity. Likewise, the add-back of CPF and CF IA factors reestablished the accumulation of PCR product (lanes 6, 7 and 11, 12, respectively).
rat1-1 extracts are deficient for termination but proficient for 3′ end cleavage
According to the torpedo model of termination, 3′ end cleavage produces an entry site for a 5′→3′ exonuclease to promote efficient release of RNAP II from the transcription template. It has been shown that the 5′→3′ exonuclease Rat1 plays a role for termination in vivo (West et al. 2004; Kim et al. 2004; Luo et al. 2006; Kaneko et al. 2007), but Rat1 and its interaction partners Rai1 and Rtt103 were not sufficient to terminate immobilized RNAP II in a highly defined in vitro situation (Dengl and Cramer 2009). We initially produced extracts from rat1-1 mutant strains and performed in vitro transcription reactions. Figure 4A shows a typical time-course experiment with the CYC1 and cyc1-512 constructs. Quantification revealed an apparent increase of transcriptional read-through with rat1-1 extracts since the levels of downstream 120, 131, and 145 cassettes remained at 60% with the wild-type terminator (Fig. 4B); notably, these values were ∼30% with wild-type extracts (Fig. 2C). Furthermore, the 120 and 131 cassette transcription remained close to 100% with the mutant terminator, suggesting that the termination defect of the cyc1-512 allele was exacerbated with the mutant extract.
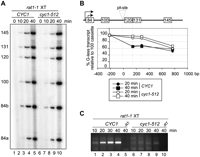
Analysis of rat1-1 extracts in coupled in vitro transcription/processing. (A) Time-course of in vitro transcription/processing with rat1-1 mutant extracts with templates carrying wild-type CYC1 (lanes 1–5) and mutant cyc1-512 (lanes 6–10) terminators, as indicated. (B) Quantification of results obtained in A. (C) 3′ end analysis as outlined in Figure 3D, of time-course obtained with rat1-1 in vitro transcription/processing reactions. Minus reverse transcriptase (−RT) controls were included for 40 min time points (lanes 5,10).
RT-PCR analysis of 3′ends revealed that 3′ end cleavage occurred efficiently with the rat1-1 extracts and the wild-type CYC1 terminator (Fig. 4C, lanes 1–5), consistent with previous results (Kim et al, 2004). In contrast, cleavage was strongly reduced with the mutant terminator, as expected (lanes 6–9). Taken together, our analyses support the idea that Rat1 contributed to termination in the coupled transcription/processing assay and that increased transcriptional read-through occurred independently of defects in 3′ end cleavage.
pAp-mediated inhibition of 5′-3′ exonuclease activity increases transcriptional read-through
We previously showed that the metabolite adenosine 3′,5′ bisphosphate (pAp), a side-product of sulfate assimilation, efficiently inhibits 5′→3′ exonuclease activity in yeast cells (Dichtl et al. 1997). In vitro analysis showed, furthermore, that the presence of 0.4–1 mM pAp resulted in inhibition of up to 80% of Rat1 activity (Dichtl et al. 1997). Therefore, we evaluated the role of exonuclease activity in termination using this potent inhibitor in our in vitro transcription system. Figure 5A shows that the presence of up to 4 mM pAp did not interfere with the efficiency of in vitro transcription. Furthermore, the signals of downstream 120, 131, and 145 cassettes were clearly enhanced in the presence of increasing concentrations of the metabolite. Quantification of the bands confirmed that the levels of downstream cassettes were increased from ∼30% in the absence of pAp to ∼60% in the presence of 2 and 4 mM pAp, respectively (Fig. 5B). Since these values compare well with the levels of downstream cassettes in the rat1-1 mutant, it appears that exonuclease activity of Rat1 contributed to the apparent termination in our assay. To exclude that this effect was due to reduced 3′ end cleavage, we analyzed 3′ ends of RNA synthesized in the presence of pAp. We found that 3′ end cleavage was comparable in the absence and presence of the metabolite (Fig. 5C).
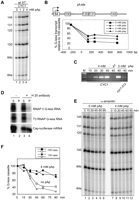
Effects of 3′,5′ adenosine bisphosphate (pAp) on in vitro transcription/processing with wild-type extracts. (A) In vitro transcription/processing with wild-type extracts with template carrying wild-type CYC1 terminator in the presence of increasing amounts of pAp, as indicated. (B) Quantification of results obtained in A. (C) 3′ end analysis as outlined in Figure 3D, of time-course of in vitro transcription/processing reactions in the absence and presence of 4 mM pAp. For control, a reaction lacking reverse transcriptase (−RT) was included for the 40-min time point, and the mutant cyc1-512 terminator was analyzed in the absence of pAp. (D) Immunoprecipitation of RNAs obtained from RNAP II and T3 RNAP-dependent transcription reactions, respectively. Luciferase mRNA served as positive control and was capped using the T7 Ribomax kit from Promega. Note that in vitro capping of the later RNA is not complete, accounting for the nonbound luciferase mRNA that is found in the supernatant (lane 3). RNAs bound to protein A–Sepharose in the presence and absence of anti-m7G antibody H 20 were separated into unbound (S) and bound fractions (P) and analyzed as described in the legend of Figure 1B. (E) Decay of G-less RNAs was analyzed following the in vitro transcription of the CYC1 terminator template with wild-type extracts. After 30 min of reaction time, RNAP II was inhibited by adding 20 ng/μL α-amanitin together with H2O (lanes 1–6) or 4 mM pAp (lanes 7–12). Aliquots were removed from the reaction at the indicated times and analyzed as shown in Figure 1C. (F) Quantification of 100 and 130 G-less cassettes from E.
Interestingly, the presence of pAp also resulted in an apparent increase of 84a, 84b, and 100 cassettes (Fig. 5A), indicating that the in vitro transcripts were also attacked by 5′-3′ exonucleases from the very 5′ end. This observation was surprising since these transcripts were expected to be protected by the m7G-cap structure. We used monoclonal H 20 antibodies that bind the m7G-cap with high affinity (Bochnig et al. 1987) in immunoprecipitation experiments to test for the presence of a m7G-cap on our in vitro transcripts. Figure 5D shows that G-less transcripts made by RNAP II were not precipitated by the H 20 antibody, just like G-less transcripts that were produced in the extracts by supplemented T3 RNA polymerase (T3 RNAP) (see Fig. 6) and that were not expected to carry a cap. In contrast, a capped luciferase transcript that was obtained by in vitro transcription with the T7 Ribomax kit from Promega was bound efficiently. We conclude that G-less transcripts made by RNAP II in our in vitro system were largely if not completely devoid of a m7G-cap structure. G-less mRNAs were therefore susceptible to 5′-3′ degradation, similar to the recently reported Rat1-dependent degradation of uncapped mRNAs in vivo (Jimeno-Gonzalez et al. 2010). It remains to be determined in future experiments whether the in vitro transcription system did not support capping or whether capped transcripts were rapidly decapped in the WCEs.
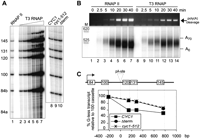
In vitro transcription/processing with T3 RNA polymerase. (A) In vitro transcription/processing reactions with wild-type extracts and templates carrying the CYC1 terminator driven by endogenous RNAP II (lane 1) or with increasing amounts of added T3 RNAP (lanes 2–7). The efficiency of termination/3′ end formation in T3 RNAP–dependent reactions was compared on templates carrying wild-type CYC1 (lane 8), mutant cyc1-512 (lane 9), or no terminator (lane 10). (B) 3′ end analysis as outlined in Figure 3D, of time-course of in vitro transcription/processing reactions dependent on extract endogenous RNAP II and T3 RNAP, as indicated. The upper panel shows nonradioactive PCR reactions that were separated on 1% agarose gels. The lower panel shows reactions where PCR was performed in the presence of 5′-32P-labelled primer B. Those reaction products were precipitated and resolved on denaturing 8.3 M urea/6% polyacrylamide gels. The approximate migration of 3′ ends carrying no or 70 adenosine residues, respectively, are indicated. (C) Quantification of results obtained in A.
We wanted to further characterize the influence of RNA degradation on the steady-state accumulation of G-less cassettes. For this purpose, we performed in vitro transcription and analyzed the decay of accumulated RNAs following α-amanitin inhibition of RNAP II in the WCEs (Fig. 5E, lanes 1–6). Interestingly, we found that G-less RNAs located upstream of (100 cassette) and downstream from (130 cassette) the poly(A) site showed a very similar decay profile (Fig. 5F). This is consistent with the observation that G-less RNAs containing upstream cassettes did not carry a m7G-cap that would have increased their stability. The contribution of 5′-3′ exonucleases to degradation was evaluated by addition of 4 mM pAp at the time of RNAP II inhibition (Fig. 5E). This resulted in strong stabilization of the RNAs, suggesting that 5′-3′ exonucleases were responsible for most of the observed degradation activity. Importantly, these experiments did not reveal a possible preferential degradation of transcription products in this in vitro system. Thus, the apparent accumulation of G-less cassettes that we measure at steady-state may produce a faithful picture of transcription elongation (Fig. 2B) and termination (Figs. 3C, 4B, 5B).
T3 RNAP does not terminate transcription at the CYC1 terminator
We show that both pre-mRNA 3′ end formation and transcription termination can be reproduced in a coupled transcription/processing assay in vitro. A heterologous RNA polymerase lacking the CTD is, however, not expected to support such coupling and should reveal the extent of post-transcriptional RNA processing that is associated with our assays. To test this, we placed our G-less reporter constructs under control of the promoter specific for the phage T3 RNAP and complemented the extracts with commercially available T3 RNAP enzyme. To avoid saturation of the processing capacities associated with the extracts, we adjusted the transcriptional output by T3 RNAP to signals obtained with extracts containing RNAP II (Fig. 6A, lanes 1–7). 3′ end analysis of the time-course experiments revealed that 3′ end formation occurred with the transcripts made by both RNAP II and T3 RNAP (Fig. 6B). We used sequencing to determine the site of poly(A) addition on 12 independent T3 transcripts and found that poly(A) addition occurred faithfully at the C↓A position 504 relative to the CYC1 translational start codon and included 36–66 adenosine residues. A time-course experiment revealed that 3′ end formation coupled to RNAP II occurred with higher efficiency compared with the T3 RNAP reaction (Fig. 6B, upper panel). Since neither RNAP II nor T3 RNAP transcripts carry m7G-cap, this difference is unlikely to result from differential stability. High-resolution analysis of radioactively marked PCR products on acrylamide gels suggested, however, that the distribution of poly(A) was comparable in both cases, consistent with our sequencing results (Fig. 6B, lower panel). The appearance of shorter poly(A) species with increasing time likely results from deadenylation activities in the extracts.
Next, we compared in vitro transcription with T3 RNAP on constructs differing in terminator sequences (Fig. 6A, lanes 8–10). G-less transcripts obtained with the Δterm construct indicated some gradual loss of polymerase activity along the template (∼80% signal at the 120 and 131 cassettes and ∼60% signal at the 145 cassette) similar to what we observed with endogenous RNAP II (Fig. 2C). Transcription of cyc1-512 gave virtually identical results. The wild-type CYC1 terminator reduced downstream cassette signals to ∼60% relative to the 100 cassette. Taken together, we conclude that transcription with T3 RNAP cannot support efficient 3′ end formation and termination as observed with RNAP II.
Efficient termination requires the CID of Pcf11
Next, we tested the role of the Pcf11 CID in pre-mRNA 3′ end formation and termination. Recombinant CF IA factor (recCF IA) was assembled entirely from Pcf11ΔN288 (lacking the CID), Clp1, Rna14, and Rna15 proteins that were expressed in Escherichia coli (see Materials and Methods; Fig. 7A). Attempts to produce recCF IA factor that included full-length Pcf11 were not successful due to the limited solubility of this protein. To circumvent this problem, we isolated CF IA from yeast via ProtA-tagged Rna15 (scCF IA). Initially, we tested 3′ end cleavage activity of recCF IA and found that the factor complemented the ProtA-tagged Rna15-depleted extract with an efficiency comparable to scCF IA (Fig. 7B). Next, we used the same ProtA-tagged Rna15-depleted extracts and CF IA factors and analyzed transcription of our G-less reporter constructs (Fig. 7C). Quantification revealed that the 120/100 and 131/100 cassette ratios were elevated from ∼40% to 80% following depletion of ProtA-tagged Rna15 (Fig. 7D, cf. lanes 1 and 3), as was shown above (Fig. 3C). Addition of scCF IA resulted in full complementation of this defect (Fig. 7D, lanes 5, 6), while recCF IA carrying the mutant Pcf11 protein was only partially active to reduce the 120/100 and 131/100 ratios to ∼60% (Fig. 7D, lanes 8, 9). We included 4 mM pAp in some of those reactions to control for the contribution of exonuclease-mediated degradation of G-less cassettes to the apparent phenotype. We observed for both the scCF IA and the recCF IA complemented reactions that pAp enhanced the levels of downstream cassettes (Fig. 7D, cf. lanes 6, 7 and 9, 10). Thus, the elevated levels of downstream cassettes observed with recCF IA are likely to result from defective termination and not because of increased G-less cassette stability. We conclude that deletion of the Pcf11 CID did not interfere with the 3′ end cleavage but resulted in enhanced transcriptional read-through. It remains possible, however, that differences between recCF IA and scCF IA may also arise due to potential post-translational modifications that would be absent on the recombinant factor. Taken together, these observations are consistent with a role for Pcf11 in RNAP II termination independent of its role in pre-mRNA 3′ end cleavage (Zhang et al. 2005; Sadowski et al. 2003).
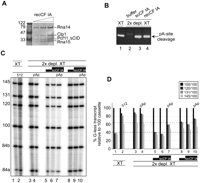
In vitro transcription/processing with recombinant CF IA factor (recCF IA. (A) Increasing amounts of recCF IA reconstituted from Pcf11ΔN288 (Pcf11 ΔCID), Clp1, Rna14, and Rna15 proteins were analyzed by SDS-PAGE and colloidal Coomassie G-250 staining. Molecular weight standards and their size in kDa are shown on the left. (B) 3′ end analysis as outlined in Figure 3D, of in vitro transcription/processing reactions with ProtA-tagged Rna15 extracts before (lane 1) and after (lanes 2–4) IgG-Sepharose depletion as described in Figure 3A. Reactions were complemented with CF IA factor purified from yeast extract (lane 3) or with reconstituted CF IA factor (lane 4). (C) In vitro transcription/processing reactions with constructs carrying the wild-type CYC1 terminator and with extracts before (lanes 1,2) and after (lanes 3–10) depletion of ProtA-tagged Rna15 protein. Two and four microliters of scCF IA and recCF IA factor, respectively, was added to depleted extracts as indicated. For control, reactions were also done with nondepleted extracts on templates carrying the mutant cyc1-512 terminator (lane 2) and in the presence of 4 mM pAp (lanes 4,7,10). (D) Quantification of results obtained in C.
In summary, we present an extract-based coupled transcription/processing system that reproduces hallmarks of RNAP II transcription and of pre-mRNA 3′ end formation. The possibility to analyze extracts prepared from widely available mutant yeast strains and to biochemically manipulate extracts by protein depletion and reconstitution of activities invite future in vitro analyses of factors that have previously been implicated in these processes based on genetic or other in vivo data. We believe that the assay system presented here will be a valuable methodological alternative to foster the analysis of transcription and associated processes.
MATERIALS AND METHODS
Yeast strains and plasmid constructs
Strains analyzed in this work were as follows: “Wild-type” W303 (MAT a ade2 leu2 ura3 trp1-1 his3), ProtA-RNA15 (Mata ura3-1 trp1-1 ade2-1 leu2-3,112 his3-11,15 rna15::TRP1 [ProtA-RNA15-LEU2-CEN]; Dichtl et al. 2002), ProtA-PFS2 (Mata ura3 ade2-1 leu2,3-112 his3-11,15 trp1 pfs2::TRP1 [ProtA-PFS2-LEU2-CEN]; Ohnacker et al. 2000), and rat1-1 (Mat alpha ura3-52 leu2Δ1 his3Δ200 rat1-1; Amberg et al. 1992).
Plasmids carrying G-less reporters that were constructed in this study are shown in Table 1. The CLP1 open reading frame was fused to an N-terminal hexahistidine tag in vector pGM10, resulting in pBD137. For a bicistronic expression construct encoding Rna14 and Rna15 proteins, the gene of RNA14 was cloned into pET28b (GE Healthcare) using oligos Rna14_for 5′-GCATGCCATGGCGATGTCCAGCTCTACGACTC-3′ and Rna14_rev 5′-CTCCCAAGCTTTTAACCTGACTTGGTGCTC-3′. RNA15 was amplified with a 5′ primer introducing a HindIII site, a ribosome binding site, and a start codon (5′-CCCAAGCTTAATAATTTTGTTTAACTTTAAGAAGGAGATATACATATGAATAGGCAGAGCGGTG-3′) and a 3′ primer (5′-AAGTTTAGCGGCCGCAAATGCACCAAATTCTCCC-3′) and ligated into the HindIII/NotI sites of the pET28a-RNA14 expression construct in frame with a C-terminal hexahistidine tag. A PCF11 fragment (PCF11ΔN288) lacking the CID-interacting domain and the Q-rich linker was amplified with the primers Pcf11_for 5′-CGAGGATCCTCCTCTCTTTTTGGTAATATTTCTG-3′ and Pcf11_rev (5′-CATAGTTAGCGGCCGCTTATTTTGTGACCAATTTCTTTAAGTCATCC-3′) and cloned into pGEX-4T (GE Healthcare), leading to an amino-terminal GST fusion. Correct nucleotide sequences were verified by DNA sequencing on both strands.
Plasmids used for G-less transcription
Extract preparation
Whole-cell yeast extracts were produced according to the method described by Schultz et al. (1991) with modifications. One and a half liters of yeast culture was grown in YPD to an OD600 of 2.5–5.0 and harvested. The cell pellet was washed twice with ice-cold ddH2O, resuspended in 10 mL extraction buffer (ET; 200 mM Tris-HCl at pH 7.5, 0.39 M (NH4)2SO4, 10 mM MgSO4, 10% [v/v] glycerol, 1 mM EDTA, and 1 mM DTT), and frozen as drops in liquid nitrogen. Cells were disrupted with three 4-min bursts (to avoid thawing of the material the chamber was shortly returned to liquid nitrogen between individual bursts) in a Mixer Mill MM301 using the 50-mL chamber and a single metal ball with 2-cm diameter (Retsch). The obtained cell powder was transferred to a 50-mL Falcon tube and exposed to a stream of cold running water until the material was thawed (after ∼30 min). ET (supplemented with one tablet complete mini protease inhibitors [Roche] and 1 mM PMSF) was added to a final volume of 45 mL, and the lysate was centrifuged at 10 krpm for 30 min at 4°C in 15-mL Corex glasses in a Sorvall SS-34 rotor. Following careful removal of the upper lipid layer, the lysate was further cleared by centrifugation at 32 krpm for 2 h at 4°C in a SW40 rotor. Then 337 mg (NH4)2SO4 was added for each milliliter of the cleared lysate and carefully stirred in a 50-mL Falcon tube on ice overnight. Precipitated protein was collected by centrifugation at 15 krpm for 60 min at 4°C in 15-mL Corex glasses in a SS34 rotor; the obtained pellet was dissolved in 500 μL dialysis buffer (20 mM HEPES-KOH at pH 7.5, 50 mM KCl, 10 mM MgSO4, 10 mM EGTA, 20% [v/v] glycerol, 5 mM DTT, 1 mM PMSF) and dialyzed during 6 h against three changes of 1.5 L dialysis buffer. The resulting lysate was collected, cleared by centrifugation at 14 krpm for 15 min in an Eppendorf 5417R table-top centrifuge at 4°C, and stored at 80°C.
Three milliliters of lysate obtained from ProtA-tagged Pfs2 and ProtA-tagged Rna15 expressing strains was supplemented to reach final concentrations of 120 mM KCl, 0.01% (v/v) NP-40, 1 mM PMSF and adsorbed overnight at 4°C on 300 μL pre-equilibrated IgG-Sepharose. The beads were then washed three times for 1 h in dialysis buffer and once for 15 min in cleavage buffer (10 mM Tris-HCl at pH 8.0, 150 mM NaCl, 0.1% [v/v] NP-40, 0.5 mM EDTA, 1 mM DTT). Then one volume of cleavage buffer was added to the beads (∼300 μL), and elution was started by addition of 70 U AcTEV protease (Invitrogen) following incubation on a rotating wheel for 3 h at 18°C. The supernatant was collected and contained partially purified scCF IA and scCPF, respectively. Protein concentrations were estimated to correspond to 5 ng/μL (scCPF) and 20 ng/μL (scCF IA) for each band based on intensities following silver staining.
In vitro transcription/processing with WCEs
In vitro reactions with WCEs were performed according to the method described by Rondon et al. (2003), with modifications. Extract (usually 50–100 mg/mL protein) containing 200 μg of protein were combined with 100 ng Gal4-VP16 activator in a 19 μL reaction containing 40 mM HEPES-KOH (pH 7.8), 10% (v/v) glycerol, 250 mM K-glutamate, and 10 mM K-acetate. Then 19 μL of 2× transcription mix (4% [w/v] PEG 8000, 80 mM HEPES-KOH at pH 7.5, 10 mM Mg-acetate, 10 mM DTT, 2 mM ATP, 2 mM GTP, 2 mM CTP, 0.2 mM UTP, 80 mM phosphocreatine, 30 μg creatine kinase, 12 U RNase Out) was added. Following preincubation for 20 min at 25°C, 1 μg of supercoiled plasmid was added together with 0.25–0.5 μL α-32P-UTP (3000 Ci/mmol). Unless indicated otherwise, reactions proceeded for 40 min at 25°C and were terminated with 200 μL stop buffer (10 mM Tris-HCl at pH 7.5, 0.3 M NaCl, 5 mM EDTA, 300 U RNase T1). The T1 digest was done for 45 min at 45°C and terminated by addition of 12 μL 10% (v/v) SDS and 20 μg proteinase K, followed by a 30-min incubation at 37°C. Nucleic acids were extracted with acid phenol/chloroform, precipitated, washed with 70% EtOH, and dried under vacuum. RNAs were resolved on 40 cm 6% polyacrylamide/8.3 M urea gels. Dried gels were exposed to BAS-MS imaging plates (Fujifilm) and scanned on a FLA 7000 Imaging System (Fujifilm), and quantification was done with ImageGauge V4.22 software. For numerical analysis, the uridine content (Us) of the individual G-less cassettes was considered as follows: 84a (18 Us), 84b (24 Us), 100 (29 Us), 120 (36 Us), 131 (40 Us), and 145 (48 Us).
3′ end and m7G-cap analysis
A detailed protocol for the ligation-mediated RT-PCR for 3′ end analysis will be described elsewhere (R.A. Alexander, M. Kos, M.C. Robert, B. Dichtl, J.D. Barrass, T. Obtulowicz, M. Koper, I. Karkusiewicz, L. Mariconti, D. Tollervey, et al., in prep). To perform the procedure, in vitro transcription reactions were not treated with RNase T1, but instead, RNA was immediately extracted using the Qiagen RNeasy Micro Kit according to manufacturer's instructions.
Immunoprecipitation with monoclonal H 20 antibody (Bochnig et al. 1987) was done essentially as described (Kwan et al. 2000). Twenty-five microliters protein A–Sepharose CL 4B was prebound to 10 μL H2O or H 20 antibody, respectively, at 4°C overnight in a total volume of 200 μL IPP150 (10 mM Tris-HCl at pH 8.0, 150 mM KCl, 0.01% NP-40). RNA isolated from in vitro transcription reactions was purified with the Qiagen RNeasy Micro Kit and incubated with the protein A-Sepharose matrix in the presence of 50 U RNasin for 1 h at 4°C. RNA from unbound supernatant and pellet fractions was phenol extracted, precipitated, and resolved on 1.2% denaturing formaldehyde gels, transferred on Hybond N+ membrane, and exposed to a Fujifilm imaging plate.
Expression and purification of recombinant proteins
His-Clp1, Rna14/His-Rna15, and GST-Pcf11ΔN288 were overexpressed in E. coli strain BL21(DE3)-RIL (Stratagene). Cells carrying the plasmid for Rna14/His-Rna15 or GST-Pcf11ΔN288, respectively, were cultured in 4 L of LB-media, whereas cells carrying the plasmid for His-Clp1 were cultured in 2 L of LB-Media at 37°C until they reached an OD600 of 500 and subsequently cooled to 20°C. Protein expression was induced with 0.5 mM isopropyl-β-D-thiogalactopyranoside and continued overnight with vigorous shaking. Cells were harvested by centrifugation (SLC-6000, 20 min, 5500 rpm, 4°C), and the obtained cell pellets were resuspended in 10 mL per gram of wet cells in the respective buffer (see below). Cells disruption was done by sonication, and the supernatant was cleared by centrifugation for 1 h in a SS34 rotor at 13 krpm, 4°C.
His-Clp1 was resuspended in buffer A (50 mM Tris-HCl at pH 8.0, 300 mM KCl, 10 mM β-mercaptoethanol) and purified on Ni2+-NTA (Qiagen) packed in a column with 1 mL volume. Prior to protein loading, the column was equilibrated with buffer A. An high-salt wash with buffer A and additional 700 mM KCl was followed by 1 column volume (cv) of buffer A. His-Clp1 was eluted with buffer A and 250 mM imidazole in a total volume of 6 mL. Rna14/His-Rna15 was resuspended in buffer B (50 mM Tris-HCl at pH 8.0, 100 mM KCl, 10 mM β-mercaptoethanol). The subcomplex was loaded on a column packed with 1 mL Ni2+-NTA equilibrated with buffer B. After loading, the column was washed with 1 cv buffer B. Elution was done in 6 mL of buffer B containing 250 mM imidazole. GST-Pcf11ΔN288 was resuspended in buffer C (50 mM Tris-HCl at pH 7.3, 150 mM KCl, 5 mM dithioerythritol [DTE], 100 μM ZnCl2). The protein was loaded on a column packed with 8 mL GSH-Sepharose FF (GE Healthcare). The protein flow was adjusted such that the load was completed after 2 h. A high-salt wash with buffer C and 1 M KCl was performed, and afterward, the column was set back to buffer C in order to perform the reconstitution of the CF IA. Obtained Rna14/His-Rna15 and His-Clp1 proteins were diluted in buffer C to a final volume of 40 mL and loaded for 2 h on the column with immobilized GST-Pcf11ΔN288. The column was washed with 1 cv buffer C, and assembled CF IA was eluted with buffer D (50 mM Tris-HCl at pH 7.3, 200 mM KCl, 5 mM DTE, 100 μM ZnCl2) containing 20 mM reduced glutathione (Sigma-Aldrich). For removal of the GST-tag from GST-Pcf11ΔN288, eluted GSH-Sepharose fractions were pooled, diluted to 30 mL with buffer D containing 2 mM CaCl2, and dialyzed in the presence of 160 U thrombin (Sigma-Aldrich) overnight at 4°C. The assembled CF IA was loaded on a MonoQ column (cv 8 mL; GE Healthcare) equilibrated with buffer E (50 mM Tris-HCl at pH 8.0, 5 mM DTE, 100 μM ZnCl2). Elution was performed in a gradient from buffer E to 60% of buffer F (50 mM Tris-HCl at pH 8.0, 1 M KCl, 5 mM DTE, 100 μM ZnCl2) over 20 cv. Final purification was performed on a Superose 6 column (cv 23 mL; GE Healthcare) equilibrated with 50 mM HEPES-NaOH (pH 7.5), 200 mM KCl, and 5 mM DTE. Prior to loading, the protein sample was concentrated on an Amicon-Ultra device (Millipore Bioscience; 30-kDa cut-off). The final yield of highly pure CF IA is 100 μg. All purification steps were monitored by SDS-PAGE, and protein concentrations were determined spectroscopically at 280 nm. Correct molecular weight of the single subunits of CF IA was confirmed by MALDI-TOF mass spectrometry.
Recombinant Gal4-VP16 fusion protein was isolated from strain XA-90 (kindly provided by J. Jaehning) as described (Woontner and Jaehning 1990).
ACKNOWLEDGMENTS
We thank J. Jaehning (University of Colorado at Denver), A. Aguilera (University of Seville, Spain), and H. Martinson (UCLA) for constructs; A. Rondon for useful advice on extract preparation and in vitro transcription; and S. Holbein for critically reading the manuscript. We thank J. Eschenbach for HPLC analysis and Robert L. Shoeman and I. Schlichting for continuous encouragement and support. This work was supported by the University of Zürich and by grants of the German Research Foundation to A.M. (ME3135/1-1), the EU grant LSHG-CT-2005-518280 to B.D., and grants of the Swiss National Science Foundation to B.D. (PP00A-102941 and PP00A-120490/1).
Footnotes
-
Reprint requests to: Bernhard Dichtl, Institute of Molecular Life Sciences, University of Zürich, Winterthurer Strasse 190, CH-8057 Zürich, Switzerland; e-mail: Bernhard.Dichtl{at}imls.uzh.ch; fax: 41-44-635-6811.
-
Article published online ahead of print. Article and publication date are at http://www.rnajournal.org/cgi/doi/10.1261/rna.2172510.
- Received March 12, 2010.
- Accepted July 28, 2010.
- Copyright © 2010 RNA Society




