


The impact of read depth and read length on RNA-seq splicing analysis
- 1Department of Bioinformatics, Theodor Boveri Institute, Julius Maximilian University Würzburg, 97074 Würzburg, Germany
- 2Cluster for Nucleic Acid Sciences and Technologies—NUCLEATE, Institute for Molecular Infection Biologie (IMIB), 97080 Würzburg, Germany
- Corresponding authors: melina.klostermann{at}uni-wuerzburg.de; kathi.zarnack{at}uni-wuerzburg.de
-
Handling editor: Mihaela Zavolan
Abstract
Alternative splicing (AS) is a key layer of regulation in eukaryotic gene expression that is investigated in all areas of life sciences. Differences in AS between conditions can be quantified from transcriptome-wide short-read RNA sequencing (RNA-seq) data with designated computational tools. However, not all short-read RNA-seq data are equally suited for AS analysis. Here, we perform an exemplary AS analysis to showcase the impact of the RNA-seq library characteristics on the obtained results. Using two standard ENCODE data sets with widespread AS changes, we modulate read length and read depth and compare their influence on the detection, quantification, and classification of AS events with the state-of-the-art AS algorithm MAJIQ. We find that both longer reads and higher read depth are effective measures to improve the sensitivity and precision of the AS analysis. Our results provide valuable insights to help researchers make informed decisions when choosing the short-read RNA-seq library specifications for AS analysis.
Keywords
INTRODUCTION
Splicing is a universal process of RNA maturation in eukaryotes. During splicing, the noncoding introns are excised, and the remaining exons are fused to obtain a mature RNA. Intriguingly, most pre-RNAs can be spliced in multiple ways in a process called alternative splicing (AS), resulting in alternative RNA isoforms that utilize distinct exons or exon parts. Changes in AS play important roles in the regulation of gene expression, for instance, during stem cell differentiation or cellular stress responses, and critically contribute to many human diseases, including cancer (Jiang and Chen 2021). The detection of AS changes in various conditions has therefore become a topic of wide interest.
Different types of AS events can be discriminated based on the 3′ or 5′ splice sites being used and their combination (Fig. 1A). In the case of cassette exons, a complete alternative exon is included or skipped from the mature RNA, whereas in intron retention, an intron can be retained or removed. Alternative 3′ or 5′ splice sites result in a lengthening or shortening on either side of an exon, while alternative first and last exons rely on the usage of alternative transcription start sites and lead to alternative polyadenylation sites, respectively. Finally, mutually exclusive refers to two or more cassette exons that are used in exchange. In more complex transcriptomes such as in human, AS events are often not binary but occur in complex combinations, resulting in more than two possible splicing outcomes (Park et al. 2018).
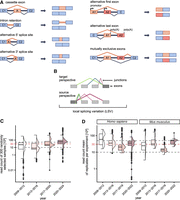
Exon-centric alternative splicing (AS) analysis and distribution of commonly used read depth in RNA-seq. (A) Different types of AS events. Schematic displays pre-mRNA (left) and splice product(s) (right). pre-mRNAs include exons (rectangles), introns (thick lines), and splice junctions (thin lines). Blue elements always remain in the mature mRNA (constitutive [C]), while orange and red elements are alternative (A). (B) Concept of local splice variation (LSV). An LSV describes a reference exon (dark gray) in the splice graph at which splice junctions (colored) can start (source exon) or end (target exon). Exons are displayed as rectangles. (C,D) Read depth of RNA-seq experiments submitted to (C) SRA or (D) ENCODE. Shown are (C) 300 random RNA-seq samples from human cells or tissues per year and (D) all H. sapiens (left) and M. musculus (right) data sets from the ENCODE categories “total RNA-seq,” “polyA plus RNA-seq,” and “shRNA RNA-seq.” Samples are grouped by years (white to dark rose). Plots are depicted as half box plot (left) and half violin plot (right). Box plots depict the median and interquartile range, with whiskers extending to the most extreme data points within 1.5x interquartile range from the quartiles and individual outliers shown as dots. The dashed lines mark 10, 30, and 50 M reads. Note that y-axis is log10-transformed.
Short-read RNA sequencing (RNA-seq) is a popular experiment to elucidate AS in a transcriptome-wide manner. Depending on the sequencing strategy employed, read lengths vary between 25 and 250 nt, with sample sizes ranging up to 200 million (M) reads. As of February 2024, the database of the Encyclopedia of DNA Elements Consortium (ENCODE) offers more than 1700 short-read RNA-seq samples from human cell lines (Luo et al. 2020). Although many of these data sets were not originally generated for AS analysis, they are routinely used for this purpose—both for examining specific biological conditions and for training large-scale predictive models of splicing (Zhang et al. 2019; Van Nostrand et al. 2020). A series of computational tools are available for AS analysis, and several benchmarking studies have compared their performance (Mehmood et al. 2020; Britto-Borges et al. 2021; Jiang and Chen 2021). The detection of AS events usually relies on junction-spanning reads, that is, RNA-seq reads that span across the exon–exon junctions and thereby directly inform on the splicing status of the sequenced RNA molecule. As an example, the widely used algorithm Modeling Alternative Junction Inclusion Quantification (MAJIQ; Vaquero-Garcia et al. 2016, 2023) uses a splice site–centric approach based on local splicing variations (LSVs). In an LSV, all exon–exon junctions starting (source perspective) or ending (target perspective) in the same reference exon are conjointly quantified (Fig. 1B). This is particularly relevant for complex AS patterns with multiple overlapping AS events, reflected in a high ranking in previous benchmarking studies (Mehmood et al. 2020; Britto-Borges et al. 2021). Irrespective of the tool chosen, its performance is influenced by the characteristics of the RNA-seq data. An early study estimated that accurate quantification of splicing levels for 80% of genes would require ∼200 M reads (Blencowe et al. 2009). To date, most RNA-seq experiments will be performed with read lengths of 50–150 nt. The chosen experimental setup of read length and depth defines how much information content can be extracted. In this context, information content refers to how many reads overlap splice junctions to inform their detection and quantification. As longer reads contain more information that can be used for a splicing analysis, likely fewer reads will be needed to gain a similar coverage of splicing detection. Splicing effects may be overlooked when an experiment is set up with insufficient read depth and/or length. A careful consideration of the experimental design is therefore essential for the reliable detection of AS changes.
RESULTS
A high number of published data sets employ limited read depths
As small RNA-seq data sets may have limited power of AS analysis, we first asked what read depths are commonly generated in current RNA-seq studies in general and specifically from ENCODE. Therefore, we performed a meta-analysis of short-read RNA-seq data sets submitted to the Sequence Read Archive (SRA; Leinonen et al. 2011) between 2009 and 2024, as well as RNA-seq data sets released by ENCODE. This included experiments irrespective of whether they were originally intended for splicing analysis. For Homo sapiens, the median number of reads per sample was 23.8 million (M) in SRA and 32.7 M in ENCODE, whereas read numbers for Mus musculus were generally lower (median 15.9 M; Fig. 1C,D). Notably, no consistent upward trend is observed in ENCODE, while the average read depth per replicate in SRA submissions started to increase in recent years. Still, some experiments used limited read depths, with the lower quartile remaining below 30 M. Thus, relatively small RNA-seq libraries continue to be generated in current research.
In light of the observation that many studies rely on read depths below 30 M reads, we decided to evaluate how AS detection is affected by the library characteristics of RNA-seq data sets of this typical size. For this, we selected two standard short-read RNA-seq data sets from ENCODE generated upon knockdown (KD) of the RNA-binding proteins U2AF2 and UPF1 in the immortalized human leukemia cell line K562. Both proteins broadly regulate splicing, and their depletion triggers widespread AS changes in the transcriptome (Zarnack et al. 2013; Kim and Maquat 2019). Each data set comprised two replicates per condition (KD and control), with an average of 25.6 M (U2AF2) and 40.2 M (UPF1) paired-end (PE) reads per replicate. To systematically evaluate the effect of read depth, we generated eight subsampled versions with different read depths of each data set by randomly subsampling the mapped 100 nt reads to 1–30 M PE reads per replicate. In addition, we tested four different read lengths (36–100 nt; Fig. 2A) to evaluate the extent to which longer reads improve AS detection.
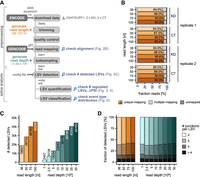
Longer reads and a higher read depth allow for better detection of LSVs. (A) Workflow of preprocessing and AS analysis. First, the raw sequencing data were downloaded from ENCODE (fastq-dump), trimmed (Trimmomatic), checked for quality (FastQC), and then mapped to the human genome (STAR) with GENCODE gene annotation. Subsampling the resulting BAM files simulated different sequencing depths (samtools view). AS analysis was performed using MAJIQ. Workflow includes work steps (light gray boxes), databases (dark gray boxes), and file formats (next to arrows). Colored bullets indicate in silico variation in read length (orange) and sequencing depth (sea green). Magnifiers mark stages where the influence of RNA-seq characteristics was tested. (B) Longer reads show slightly better mappability. Proportion of uniquely mapped, multimapped, and unmapped reads for four different read lengths (36–100 nt, light to dark orange) of the KD and control replicates of the U2AF2 KD experiment. (C) Number of LSVs detected by MAJIQ for different read lengths (36–100 nt, light to dark orange) and read depths (1–30 M reads, light to dark sea green). (D) LSV complexity. Fraction of LSVs with a given number of junctions therein for different read lengths (36–100 nt, light to dark orange) and read depths (1–30 M reads, light to dark sea green).
Read length marginally affects alignment efficiency
As a first step in the workflow, the raw reads were trimmed to four different read lengths (36–100 nt) and then aligned to the human reference genome using the splice-aware alignment algorithm STAR (Fig. 2A; Dobin et al. 2013). We found that the fraction of uniquely mapping reads was almost identical for 100 and 75 nt reads (89.6% and 90.4%, respectively), whereas shortening the reads to 36 nt reduced their mappability to 84.8% (mean over all replicates from U2AF2 KD experiment; Fig. 2B). Although all read lengths consistently achieved ≥80% uniquely mapped reads, the fraction of junction-spanning reads—which directly inform on splicing—went down for shorter reads (Table 1).
Mean fraction and mean absolute number of junction-spanning reads among uniquely mapping reads over all replicates from U2AF2 KD experiment
Read length and depth are critical for detecting alternative splicing for subsequent quantification
To analyze AS changes, we employed the widely used algorithm MAJIQ and the associated visualization tool VOILA (Vaquero-Garcia et al. 2016). In brief, the MAJIQ Builder first constructs a unified graph representation of splice junctions observed in the data (splicegraph). From this, it defines all detected LSVs, that is, the collection of two or more alternative splice junctions and/or intron retention starting from or ending in the same reference exon (LSV detection; Fig. 2A). Next, the MAJIQ Quantifier estimates the relative abundance of each junction per LSV, expressed as percent selected index (PSI), that is, the percent usage of the junction compared to all other junctions in the same LSV. To compare AS between conditions, the expected difference in PSI values for each junction (ΔPSI) is computed together with the associated Bayesian posterior probability (P(ΔPSI); here termed LSV quantification). Lastly, the VOILA Modulizer (Vaquero-Garcia et al. 2023) decomposes the complex LSVs into individual AS event types that are contained therein (LSV classification). Using the U2AF2 KD experiment as a test case, we performed individual MAJIQ analyses on a total of 12 data set variants, comprising four read length and eight read depth variants, and compared the outcome at the three stages.
As a first metric, we assessed differences in LSV detection. MAJIQ uses user-provided isoform annotations but also detects LSVs de novo from the RNA-seq reads. In both cases, LSVs are identified based on the junction-spanning reads in the data. We found that read length had a considerable impact on LSV detection (Fig. 2C, left). The number of LSVs steadily increased, rising from 36 to 100 nt reads by 26,332 additional LSVs, which corresponds to a 2.4-fold increase. This trend reflects that longer reads are more likely to span exon–exon junctions. Consistent improvements were also observed for intermediate read lengths: 50 and 75 nt reads showed 1.5- and 2.1-fold increases, respectively, relative to the next shorter read length. In contrast, the increase from 75 to 100 nt reads was only modest (1.1-fold), potentially suggesting that LSV detection begins to plateau at 100 nt reads and might reach saturation at longer read lengths. This might be explained by a typical exon length of ∼150 nt, meaning that most reads of 100 nt or longer would span at least one of the neighboring exon–exon junctions.
Varying the read depth displayed a comparable trend, with 30 M reads leading to 1.9-fold more detected LSVs than 1 M reads (Fig. 2C, right). Here, no onset of saturation was observed, even with the largest samples. Moreover, increasing read length or depth led to a progressive rise in LSV complexity, reflected by the growing number of alternative junctions associated with each LSV (Fig. 2D). Repeating the analyses for the UPF1 KD experiment yielded very similar results, with twofold more detected LSVs as read lengths increased from 36 to 100 nt (Supplemental Fig. S1).
Overall, these observations show that LSV detection is strongly influenced by both the number and length of RNA-seq reads, as longer reads or a higher read depth provide more information. Importantly, the set of LSVs detected in the initial step defines the upper limit for all subsequent analyses as only AS events present in the splicegraph can later be identified as differentially regulated splicing.
Higher information content allows for more local splice variations to reach significance
Next, we focused on LSVs that exhibited differential splicing between conditions. To define significantly regulated LSVs, we asked for a minimum change in junction usage of 5% (ΔPSI ≥ 0.05) with a minimum probability of 90% (probability changing, P(|ΔPSI| > 0.05) ≥ 0.9—hereafter called “regulated LSVs”; Fig. 3A). Note that due to MAJIQ's ΔPSI prior that pushes values toward zero and limited read support, changes as small as 5% rarely reach this significance threshold. When applying these thresholds, longer reads enabled the detection of a greater number of regulated LSVs, and these generally overlapped between read lengths, indicating a consistent increase in sensitivity with increasing read length (Fig. 3B,C). This was corroborated in the UPF1 KD experiment (Supplemental Fig. S2).
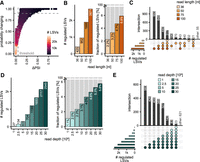
Higher information content leads to a greater sensitivity in the identification of significantly regulated LSVs. (A) Maximum ΔPSI values are plotted against maximum probability changing [P(|ΔPSI| > 0.05)] for each LSV in the U2AF2 KD data set. Dashed gray lines show thresholds for an LSV to be considered regulated [significance threshold: ΔPSI ≥ 0.05 and P(|ΔPSI| > 0.05) ≥ 0.9]. Color refers to the point density. (B–E) Impact of read length (36–100 nt, light to dark orange) and read depth (1–30 M reads, light to dark sea green) on the identification of regulated LSVs. (B,D) Absolute number (left) and fraction (right) of regulated LSVs retrieved for different read lengths (B) and read depths (D). Note that the scale in the right panels is capped at 6%. (C,E) UpSet plot shows overlap of regulated LSVs between test data sets.
Interestingly, we observed an improvement not only in absolute numbers, but also at relative levels normalized to the total LSVs detected. For instance, 50 nt reads yielded 952 regulated LSVs, corresponding to 3.3% of all LSVs detected in this data set, whereas 100 nt reads identified 2671 regulated LSVs, equaling 5.9% of LSVs detected. A similar trend was observed when increasing read depth (Fig. 3D,E). While data sets with up to 5 M reads yielded hardly any regulated LSVs, the fraction of regulated LSVs steadily rose from 3.1% to 5.8% when moving from 10 to 30 M reads.
These observations indicate that although many LSVs were nominally detected in the low-coverage data sets, they did not achieve sufficient support to reach statistical significance. This reflects MAJIQ's internal workflow, in which LSVs must first be classified as “reliably detected” and then as “quantifiable,” such that only LSVs with sufficient read support can eventually reach statistical significance. Altogether, these findings demonstrate that the sensitivity for identifying regulated LSVs improves markedly with both longer reads and higher read depths.
MAJIQ returns conservative estimates for alternative splicing changes in scarce data
We next examined how the RNA-seq library characteristics influence the quantitative estimates of splicing changes between conditions. Given that each LSV contains multiple junctions, we considered the maximum ΔPSI for each LSV. A comparison of absolute changes (|ΔPSI|) highlighted a trend in which longer reads and higher read depths resulted in slightly larger absolute ΔPSI values (Fig. 4A,B; Supplemental Fig. S3A). This behavior arises from the Bayesian framework employed in the “majiq deltapsi” algorithm, which shrinks the ΔPSI estimates toward zero as read support is low. MAJIQ offers an alternative, nonparametric test (“majiq heterogen”) for larger sample numbers, which would not be subject to this shrinkage effect.
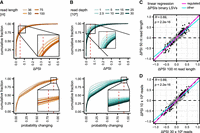
Quantitative estimates are downgraded for nonregulated LSVs. (A,B) Shorter or less reads lead to smaller ΔPSI estimates. Cumulative fraction of ΔPSI and probability changing values for different read lengths (36–100 nt, light to dark orange) and read depths (1–30 M reads, light to dark sea green). For each LSV, the maximum ΔPSI and probability changing were considered. (C,D) Estimated changes for regulated LSVs are well reproducible. Exemplary comparison of ΔPSI values for shared LSVs between the 100 and 50 nt read data sets (C) and the 30 and 10 M read data sets (D). LSVs that are regulated in both data sets are shown in black. Magenta and cyan lines represent linear regression of ΔPSI values for regulated and all LSVs, respectively.
Importantly, direct comparisons of LSVs shared between data sets showed that the reduction in quantitative measurements mainly affected nonregulated LSVs, while regulated LSVs stayed centered near the diagonal (Fig. 4C,D; Supplemental Fig. S3B, cyan vs. magenta linear regression line). This was consistently observed for both experiments and across the different read lengths and read depths. Moreover, the ΔPSI values were highly correlated for both nonregulated and regulated LSVs, indicating that although the global shrinkage reduced absolute magnitudes, it preserved the relative ordering of events. Thus, the “majiq deltapsi” algorithm produces more conservative estimates of splicing changes and probabilities under conditions of limited information content, yet still maintains high precision for the regulated LSVs that pass significance thresholds.
Higher information content is required for alternative splicing in lowly expressed genes
To assess how gene expression influences the likelihood of detecting AS changes, we assessed the expression levels (transcripts per million [TPM]) of genes harboring regulated LSVs in the different data set variants. Of note, regulated LSVs in highly expressed genes (TPM > 100) were efficiently detected with just 1 M reads per sample, whereas hardly any regulation was picked up in lowly expressed genes (TPM ≤ 25; Fig. 5A–D). Moreover, at least 10 M reads were required to identify regulated LSVs in genes with TPM ≤ 5. These results illustrate how RNA-seq library requirements strongly depend on the expression level of the target transcripts and can help to guide experimental design when low-abundance RNAs are of interest.
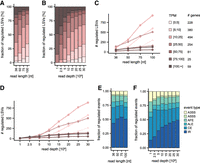
Detection of LSVs in lowly expressed genes requires data with higher information content. AS events involving three or more junctions benefit most from more complex data sets. (A–D) Fraction (A,B) and absolute number (C,D) of regulated LSVs falling in bins with different TPM values for different read lengths (36–100 nt) (A,C) and read depths (1–30 M reads) (B,D), ranging from light pink for low to brown for high TPM values. The number of genes in each bin is indicated beside the legend. (E,F) Fraction of regulated AS event types: alternative 3′ splice site (A3SS, yellow), alternative 5′ splice site (A5SS, light green), alternative first exon (AFE, green), alternative last exon (ALE, sea green), cassette exon (CE, petrol), and intron retention (IR, blue) for different (E) read lengths (36–100 nt) and (F) read depths (1–30 M reads).
Detection of different splicing event types depends on information content
Building on our previous findings, we further investigated the impact of the RNA-seq characteristics on the different types of AS events. The VOILA Modulizer decomposes LSVs into one or more AS events that are contained therein, such as cassette exons (CEs), alternative splice sites (A5SS, A3SS), or intron retention (IR; Fig. 1A). Evaluating the reported regulated AS events, several event types including A5SS or IR benefited from higher information content in the data, with both longer reads and greater read depth increasing their likelihood of detection as regulated (Fig. 5E,F).
Combined effects of read depth and length on quantification of splice junctions
A previous study estimated that, with 35 nt reads, ∼200 M reads would be required to quantify AS in 80% of splice junctions in RNA-seq data for a human cell line (Blencowe et al. 2009). To place our study in context with this recommendation, we computed the number of quantifiable splice junctions in a deep RNA-seq data set from HEK293 cells consisting of ∼380 M 150 nt reads (paired-end; Espinosa et al. 2022). While the early study assumed that at least 20 reads per splice junction were necessary for reliable quantification, the “majiq deltapsi” algorithm provides higher sensitivity and requires only 10 reads per splice junction to be quantifiable. We therefore adopted a threshold of at least 10 reads per splice junction in our analysis. The highest number of quantifiable splice junctions observed was 985,655 using 200 M reads and 125 nt reads, corresponding to 76% of all possible splice junctions.
Overall, our results show that both higher read depths (up to 250 M reads) and read lengths (up to 150 nt) increased the number of quantifiable splice junctions (Fig. 6). The number of quantifiable splice junctions rose steeply between 1 and 50 M reads, after which the rate of increase declined (Supplemental Fig. S4A). In contrast, the number of quantifiable splice junctions increased nearly linearly with read lengths from 36 to 150 nt (Supplemental Fig. S4B). When jointly considering read length and read depth, it becomes evident that different parameter combinations can be used to obtain similar results. For example, 50 M reads of 50 nt produced a comparable number of quantifiable splice junctions as either 15 M reads of 150 nt or 25 M reads of 100 nt (∼550,000; Fig. 6B; Supplemental Table S1). A read length of 150 nt with a depth of 30 M reads—as used by ENCODE—yielded ∼720,000 quantifiable splice junctions, which would be comparable to 50 M reads of 75 nt or 100 M reads of 50 nt. These results showcase that various combinations of read length and depth can achieve equivalent information content for AS analysis.
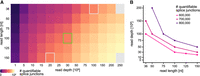
Theoretical estimation of quantifiable splice junctions in relation to read depth and read length. Subsampling of an RNA-seq sample in HEK293 cells, originally containing 380 M reads with a read length of 150 nt, is used to estimate the number of introns spanned by at least 10 reads, which we denote as quantifiable splice junctions. (A) The number of quantifiable splice junctions is shown in a heat map (color scale from dark purple—0—to yellow—1 M—quantifiable splice junctions) by read length (rows) and read depth (columns). Green box denotes ENCODE standard library characteristics resulting in ∼600,000 quantifiable splice junctions, and gray box denotes alternative selections of read length and read depth, resulting in a similar number. (B) Possible combinations of read length and read depth are displayed that result in 600,000 (pink), 700,000 (magenta), or 800,000 (purple) quantifiable splice junctions.
DISCUSSION
Understanding the impact of RNA-seq library characteristics on AS analysis is crucial for designing robust experiments and interpreting results accurately. Here, we used in silico variations of publicly available short-read RNA-seq data to showcase the impact of read length and read depth on differential splicing analysis. By applying these variations to representative data sets from the widely used ENCODE database, we demonstrate that increasing either parameter greatly benefits the detection of regulated AS events.
In the context of differential gene expression, several studies have explored sequencing depth requirements, with conclusions ranging from just 200,000 reads being sufficient when using nine replicates (Baccarella et al. 2018) to recommendations of at least 60 M reads (Bass et al. 2019). As AS detection relies specifically on junction-spanning reads, we anticipated that AS analyses would require higher information content than gene expression studies. Indeed, while 50 nt reads are often considered as sufficient for differential gene expression (Illumina Knowledge Base, https://knowledge.illumina.com/library-preparation/rna-library-prep/library-preparation-rna-library-prep-reference_material-list/000001243), our results indicate that reads of 100 nt or longer are advisable for AS analysis. This is consistent with a previous study showing that 100 nt paired-end reads substantially increase splice site detection (Chhangawala et al. 2015). We note that paired-end information is not explicitly utilized by MAJIQ but is typically used for transcript abundance estimation and relative isoform usage, as implemented in tools such as Salmon, Kallisto, or RSEM (Li and Dewey 2011; Bray et al. 2016; Patro et al. 2017).
The current ENCODE Guidelines and Best Practices for RNA-seq experiments recommend at least two biological replicates with 30 M mapped reads (or read pairs) per replicate (https://www.encodeproject.org/about/experiment-guidelines/). However, in our analyses, neither overall LSV detection nor the identification of regulated AS events approached saturation at this read depth, suggesting that this could be expanded in the future to exploit the full potential of AS analyses.
Another critical factor is the number of replicates used, as this directly affects reproducibility and statistical power. Many RNA-seq studies—including ENCODE data sets—use only two to four replicates. MAJIQ by default requires 51% of samples to support an LSV for it to be considered reliably detected, which safeguards reproducibility to some degree. Nevertheless, too few replicates increase the likelihood of both false positives and false negatives. Consistently, a previous benchmarking study using MAJIQ on GTEx data (Vaquero-Garcia et al. 2023) showed that AS reproducibility increased from ∼70% with three replicates to ∼90% with 15, underscoring the risks associated with small replicate numbers, particularly in biologically complex tissues.
The optimal library characteristics for AS analysis also vary depending on the organism and sample type. For instance, species with smaller genomes or less splicing complexity may be adequately covered with shorter reads or lower depths, whereas heterogeneous tissues or other samples with high biological variability may benefit from specialized algorithms, which are tailored for complex transcriptomes, such as MAJIQ HET (Vaquero-Garcia et al. 2023). In addition, confounding factors, including batch effects, should be carefully managed. Tools like MOCCASIN can be integrated into the MAJIQ workflow to correct for confounding influences and improve ΔPSI accuracy (Slaff et al. 2021).
Finally, our results show that increasing the information content in the RNA-seq data—through longer reads, higher read depth, or both—lowers the detection limit and enhances the identification of AS events, particularly in lowly expressed genes. This is relevant when studying regulatory genes with tightly controlled expression, such as transcription factors, which are often targeted by AS changes yet are typically expressed at TPM < 20 in most tissues (Lambert et al. 2018; Soto et al. 2022).
SUMMARY
Our analysis highlights several key factors that influence the detection and quantification of AS events in RNA-seq experiments. Specifically, we found that increasing read length (e.g., 100 nt or longer) improves splice site resolution, while higher read depths enhance the detection of splicing events in lowly expressed genes. Importantly, our results do not indicate a clear saturation point within the sequencing depths examined. When choosing RNA-seq library characteristics, researchers should consider the complexity of the transcriptome being studied, the biological variability of the samples, and the specific goals of the experiment. Overall, our findings provide insights into how RNA-seq library characteristics shape the outcome of AS analyses and provide guidance for interpreting results and choosing appropriate experimental settings, which should be tailored to the specific biological context.
MATERIALS AND METHODS
Meta-analysis of read depth in the databases SRA and ENCODE
Information on the RNA-seq sample files from the SRA database was obtained using the entrez_search() and entrez_fetch() functions of the R package rentrez (version 1.2.3; Winter 2017), specifying the SRA database (db = “sra”). entrez_search() was provided the search term “RNA-seq [STRA] AND Homo Sapiens [ORGN] AND 2024 [PDAT] AND TRANSCRIPTOMIC [SRC],” where 2024 in the term was adjusted for each year between 2009 and 2024. In addition, the parameter retmax = 300 had to be specified, which allows retrieval of a maximum of 300 samples per search, which is the maximum number allowed by NCBI. For entrez_fetch() retmode = “xml” was specified, and the xml data were then transferred to a data.frame with the xmlToDataFrame() function from the R package XML (version 3.99-0.18).
Information on the RNA-seq sample files from ENCODE was downloaded using the GET() function from the R package httr (version 1.4.7). The obtained information was transferred from JSON format using the fromJSON() function from the R package jsonlite (version 2.0.0). The GET() function was provided with the URL https://www.encodeproject.org/ and different query strings. To obtain metadata on the files including the read counts per sample, the experiment id, and the submission year, the string “search/?type = File&file_format = fastq&assay_title = shRNA%20RNA-seq&frame = object&limit = all” for the category shRNA RNA-seq was used. Similarly for the categories “polyA plus RNA-seq” and “total RNA-seq,” the same query string was used with an altered title “title = polyA%20plus%20RNA-seq” and “title = total%20RNA-seq,” respectively. In addition, the information on the organism and cell type was obtained using GET() and fromJSON() on the metadata of the experiment by changing the type in the query string to “type = Experiment.”
Box-and-whisker plots display the median, interquartile range, and potential outliers, with the box spanning the first to third quartiles, the line inside the box representing the median, and whiskers extending to the most extreme data points within 1.5× interquartile range from the quartiles.
Experimental data
All analyzed RNA-seq data sets were taken from ENCODE (Luo et al. 2020). Two experiments were for U2AF2 or UPF1 knockdown (KD) in the immortalized human leukemia cell line K562 (ENCODE IDs: U2AF2, ENCSR904CJQ; UPF1, ENCSR251ABP). In brief, the expression of U2AF2 and UPF1 was depleted using small hairpin RNAs (shRNAs). Nontargeting shRNAs served as controls (CTs). The experiments had two biological replicates for each condition. All samples were generated by Illumina short-read sequencing with 100 nt paired-end reads and contained on average 41.0 million read pairs per replicate.
Preprocessing and in silico variation of sequencing data
All RNA-seq data sets were downloaded in FASTQ format from the SRA database using fastq-dump (sra-toolkit version 3.0.0; https://github.com/ncbi/sra-tools/wiki). Trimmomatic (version 0.39; Bolger et al. 2014) was used to remove adapter sequences from the 3′ ends with ILLUMINACLIP:TrueSeq3-PE.fa:2:30:10:8:true (U2AF2 and UPF1 KD). Sliding window quality trimming was performed with ‐‐SLIDINGWINDOW:4:20. Reads with a length <100 nt were sorted out (‐‐MINLEN:100). To obtain different read lengths, all reads were then cropped to 100, 75, 50, and 36 nt (‐‐CROP:desiredLength).
All FASTQ files were subjected to quality control using FastQC (version 0.11.9; https://www.bioinformatics.babraham.ac.uk/projects/fastqc/). Then, the reads were aligned to the human reference genome (version GRCh38.p13) with GENCODE gene annotation (version 41; Frankish et al., 2019) using STAR (version 2.7.10a; Dobin et al. 2013). For mapping, the paired-end option (as collection) was used and ‐‐sjdbOverhang was set to read length−1. Only uniquely mapping reads (‐‐outFilterMultimapNmax 1) with up to 4% of mismatches per mapped read length (‐‐outFilterMismatchNmax 999 ‐‐outFilterMismatchNoverLmax 0.04) were processed further. Unaligned reads were excluded from the BAM output. To simulate different sequencing depths, the mapped reads of the U2AF2 KD data set were subsampled to 30, 25, 20, 15, 10, 5, 2.5, and 1 M reads using samtools view (version 1.6; Li et al. 2009).
Alternative splicing analysis
AS analysis was performed using MAJIQ (version 2.3; Vaquero-Garcia et al. 2016, 2023). First, the MAJIQ Builder was used for LSV detection (majiq build). We refer to these as detected LSVs. It was provided with the GENCODE gene annotation (version 41) in GFF3 format and a configuration file containing the BAM file paths, information on read length, strandedness (“reverse”), and the reference genome. The experiments were grouped based on the knockdown target U2AF2 or UPF1.
Next, the MAJIQ Quantifier (majiq deltapsi) was run for quantifying differences in junction usage (Δ percent selected index, ΔPSI) on the MAJIQ files obtained from the MAJIQ Builder. To visualize the outcome, the SQL file from the MAJIQ Builder, containing the splicegraph, and the VOILA files from the MAJIQ Quantifier were used as input for VOILA. voila tsv was executed with the following parameter settings: ‐‐show-all ‐‐threshold 0.05 ‐‐changing-between-group-dpsi 0.05 ‐‐non-changing-between-group-dpsi 0.05. We refer to LSVs with P(|ΔPSI| > 0.05) ≥ 0.9 as “regulated LSVs.”
For AS event classification, the VOILA Modulizer (voila modulize, also called voila categorize in newer versions) was run with the following parameter settings: ‐‐changing-between-group-dpsi 0.05 ‐‐non-changing-between-group-dpsi 0.05 ‐‐changing-between-group-dpsi-secondary 0.025 ‐‐show-all.
The output from voila tsv and voila modulize was then further analyzed in R, where we filtered for regulated LSVs (ΔPSI ≥ 0.05 and P(|ΔPSI| > 0.05) ≥ 0.9 probability changing; Figs. 3, 5). Since an LSV can have multiple junctions with different ΔPSI and probability changing values, we chose the maximum of these values for each LSV.
Regulated AS events (Fig. 5) with two splice junctions (A3SS, A5SS, AFE, ALE, and IR) were considered regulated if at least one junction met the regulation criteria. For cassette exons (CEs) with four splice junctions, we considered them as regulated if either both junctions originating from C1 or both junctions originating from C2 met the thresholds of ΔPSI ≥ 0.05 and P(|ΔPSI| > 0.05) ≥ 0.9 (Fig. 1A). The less common splicing events described—MAJIQ classifies more than 10 different types—were left out for simplicity.
Calculation of TPM values
HTSeq (htseq-count; version 2.0.2; Anders et al. 2015) was run to count the number of reads mapping to specific exons for the U2AF2 KD experiment (100 nt long reads). BAM files and gene annotation were passed with the following options: ‐‐stranded reverse -–type exon -–nonunique all. The resulting counts were averaged across all replicates in order to compute transcripts per million (TPM) values. First, mean counts are divided by gene lengths to obtain reads per kilobase (RPK) values. Subsequently, the RPK value was divided by the sum of all mean counts. The total length of all annotated, merged exons was used as gene length for the calculation (GenomicFeatures, version 1.54.4, exonsBy(), by = “gene”; GENCODE gene annotation version 41; GenomicRanges, version 1.54.1, reduce()). Only TPM values of genes with regulated LSVs were considered for analysis.
Computation of quantifiable splice junctions
We used one RNA-seq sample from HEK293 cells with over 250 M reads (paired-end data, 194.3 M Spots per pair in the raw FASTQ files, ctrl shRNA, SRR20828728; Espinosa et al. 2022) and computed the number of splice junctions. For this, reads were overlapped with annotated introns. The sample was subset into the read lengths of 36, 50, 75, 100, 125, and 150 nt, and the resulting samples were aligned to the genome as described above.
To compute the number of overlaps with each intron in the genome annotation, the aligned BAM files were turned into BED files using the bamtobed function from BEDtools (version v2.31.1; Quinlan and Hall 2010). The BED files were then loaded into R using import.bed() from the R/Bioconductor package rtracklayer (version 1.68.0; Lawrence et al. 2009). Each of the samples with the different read lengths was then also subsampled to obtain samples with 1–250 M reads per sample. Note that for read lengths of 36 and 150 nt, there were less than 250 M uniquely mapped reads (Supplemental Table S2). Therefore, the highest number of reads used for these two read lengths is 200 M reads.
Introns were obtained using the intronsByTranscripts() function of the R/Bioconductor package GenomicFeatures (version 1.60.0; Lawrence et al. 2013) on the GENCODE gene annotation version 41, which was imported using makeTxDbFromGFF() from the R/Bioconductor package txdbmaker (version 1.4.1; Pagès et al. 2025). The overlaps of the reads of each sample were then counted using the countOverlaps() function from the R/Bioconductor package GenomicRanges (version 1.60.0; Lawrence et al. 2013) with the parameter type = “within.” We deem a splice junction quantifiable if ≥10 reads overlapped.
Percentages regarding all possible splice junctions were calculated in the following way: We estimated that 34,037 genes were expressed (≥10 reads per gene), corresponding to a theoretical maximum of 1,288,547 splice junctions. With 36 nt reads and 200 M reads, we quantified 778,687 splice junctions (∼60% of all possible splice junctions). Note that this is lower than the previous estimation that 200 M reads with a read length of 35 nt would cover 80% of all splice junctions (Blencowe et al. 2009). However, our estimation does not consider that not all annotated transcript isoforms are expected to be expressed in HEK293 cells. Therefore, the true percentage of covered expressed splice junctions is likely higher.
DATA DEPOSITION
The analyzed RNA-seq data are available from ENCODE (https://www.encodeproject.org/) or SRA (https://www.ncbi.nlm.nih.gov/sra) with the following accession numbers: U2AF2 KD in human K562 (ENCODE ID: ENCSR904CJQ), UPF1 KD in human K562 (ENCODE ID: ENCSR251ABP), sample from HEK293 cells (SRA ID: SRR20828728). The computational code for this study is available on GitHub at https://github.com/ZarnackGroup/Ladwig_et_al_2026.
SUPPLEMENTAL MATERIAL
Supplemental material is available for this article.
ACKNOWLEDGMENTS
We thank Yoseph Barash and all members of the Zarnack group for valuable discussions and Mario Keller for help with MAJIQ. This work was funded through the Deutsche Forschungsgemeinschaft (DFG, German Research Foundation) via grants # ZA 881/2-3 and ZA 881/6-1 and through EXC 3113/1 (project ID 533767322), Cluster for Nucleic Acid Sciences and Technologies—NUCLEATE, to K.Z.
Author contributions: A.L. and M.K. analyzed data. M.K. and K.Z. designed studies and interpreted data. A.L., M.K., and K.Z. wrote the manuscript and made the figures.
Footnotes
-
Article is online at http://www.rnajournal.org/cgi/doi/10.1261/rna.080915.125.
-
Freely available online through the RNA Open Access option.
- Received December 17, 2025.
- Accepted March 7, 2026.
This article, published in RNA, is available under a Creative Commons License (Attribution-NonCommercial 4.0 International), as described at http://creativecommons.org/licenses/by-nc/4.0/.
REFERENCES
MEET THE FIRST AUTHOR

Meet the First Author(s) is an editorial feature within RNA, in which the first author(s) of research-based papers in each issue have the opportunity to introduce themselves and their work to readers of RNA and the RNA research community. Annika Ladwig is the first author of this paper, “The impact of read depth and read length on RNA-seq splicing analysis.” Annika is currently a PhD student in the Zarnack group at the Chair of Bioinformatics II, University of Würzburg. Her research is focused on bioinformatics approaches to study RNA biology, in relation to alternative splicing and RNA secondary structure.
What are the major results described in your paper, and how do they impact this branch of the field?
In this study, we investigated how RNA-seq library characteristics affect the analysis of alternative splicing. By systematically varying read length and sequencing depth in ENCODE data sets, we show that both parameters influence the detection and quantification of splicing events. Longer reads and higher read depth both improve the sensitivity for identifying regulated alternative splicing, particularly in lowly expressed genes. We further demonstrate that different combinations of read length and read depth can provide comparable information content. Together, our results provide insights that can help researchers better assess RNA-seq data sets and choose appropriate library characteristics for alternative splicing studies.
What led you to study RNA or this aspect of RNA science?
My interest in RNA started when I joined the Zarnack group in Frankfurt for a research internship and later for my bachelor's thesis. I had always been interested in biology and human health, but I also enjoyed mathematics, which eventually led me to bioinformatics. During my bachelor's thesis, I worked on alternative splicing and how factors like read length can influence the analysis. Working on such RNA-related questions made me realize how central RNA biology is for cellular regulation, especially with the rise of RNA-based technologies and the growing recognition that changes in processes like alternative splicing can contribute to many diseases.
If you were able to give one piece of advice to your younger self, what would that be?
If I could give one piece of advice to my younger self, it would be to be confident and not underestimate my abilities. I would also remind myself not to be afraid of making mistakes or doing something imperfectly. It's better to try and learn from it than to hold back because things might not work out. And as a researcher, it's also good to remember that you don't always need spectacular results—sometimes getting negative results is also important for the science.
Are there specific individuals or groups who have influenced your philosophy or approach to science?
One person who strongly influenced my approach to science is Dr. Melina Klostermann, who has been mentoring me since my bachelor's thesis. Through working with her, I learned the importance of creative and critical thinking in research. She always approached problems from different angles and encouraged exploring new ideas. This mindset shaped the way I approach scientific problems today. I was also greatly influenced by my supervisor, Professor Dr. Kathi Zarnack, and the Zarnack group in general. Being part of such a supportive research environment has been very valuable for me as an early-career researcher.
What are your subsequent near- or long-term career plans?
In the near future, my main focus is continuing to explore RNA biology through computational approaches in my PhD, which I have started recently. Since I'm also very interested in human health, I aim to work in areas where RNA biology and bioinformatics contribute to a better understanding of disease. I'm also generally interested in how broader, lifestyle-related factors such as nutrition might be connected to these processes.




