


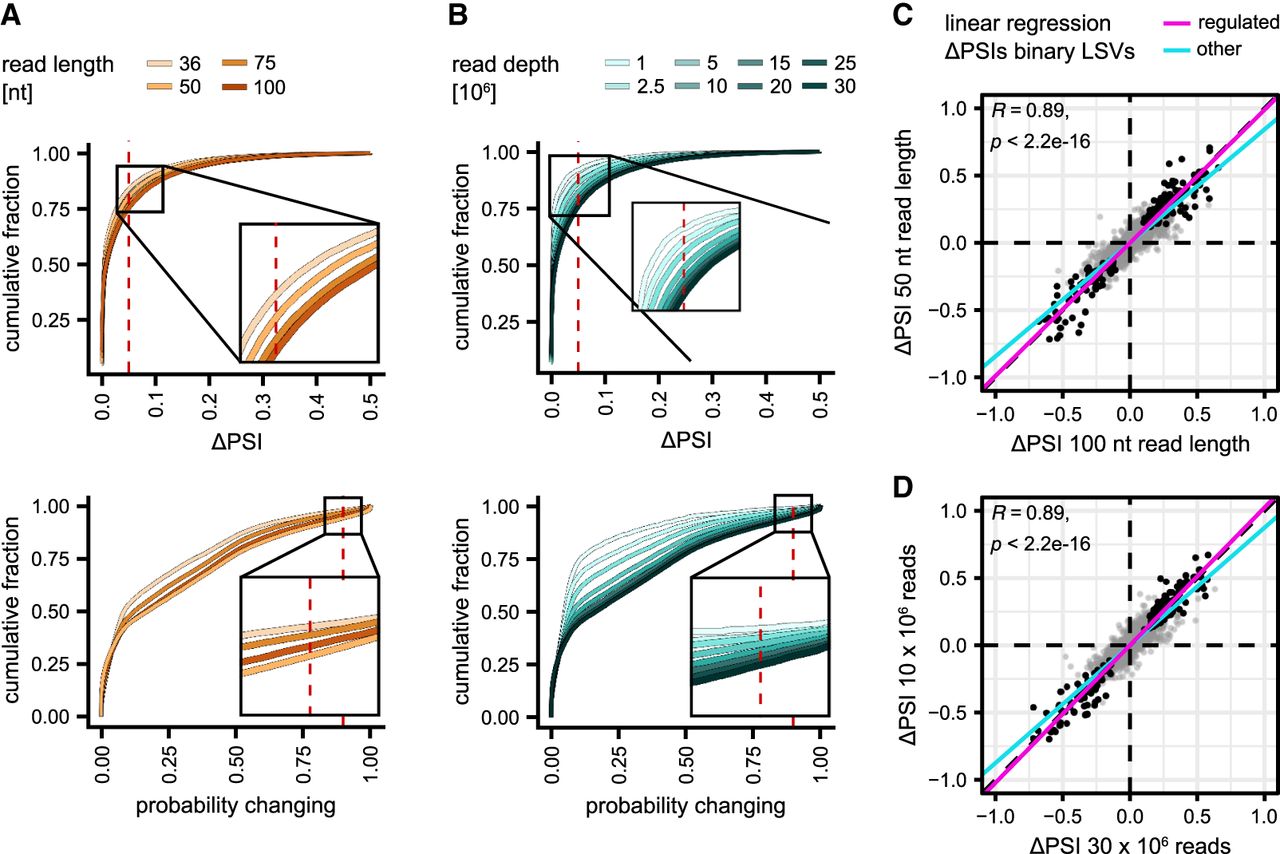
Quantitative estimates are downgraded for nonregulated LSVs. (A,B) Shorter or less reads lead to smaller ΔPSI estimates. Cumulative fraction of ΔPSI and probability changing values for different read lengths (36–100 nt, light to dark orange) and read depths (1–30 M reads, light to dark sea green). For each LSV, the maximum ΔPSI and probability changing were considered. (C,D) Estimated changes for regulated LSVs are well reproducible. Exemplary comparison of ΔPSI values for shared LSVs between the 100 and 50 nt read data sets (C) and the 30 and 10 M read data sets (D). LSVs that are regulated in both data sets are shown in black. Magenta and cyan lines represent linear regression of ΔPSI values for regulated and all LSVs, respectively.




