


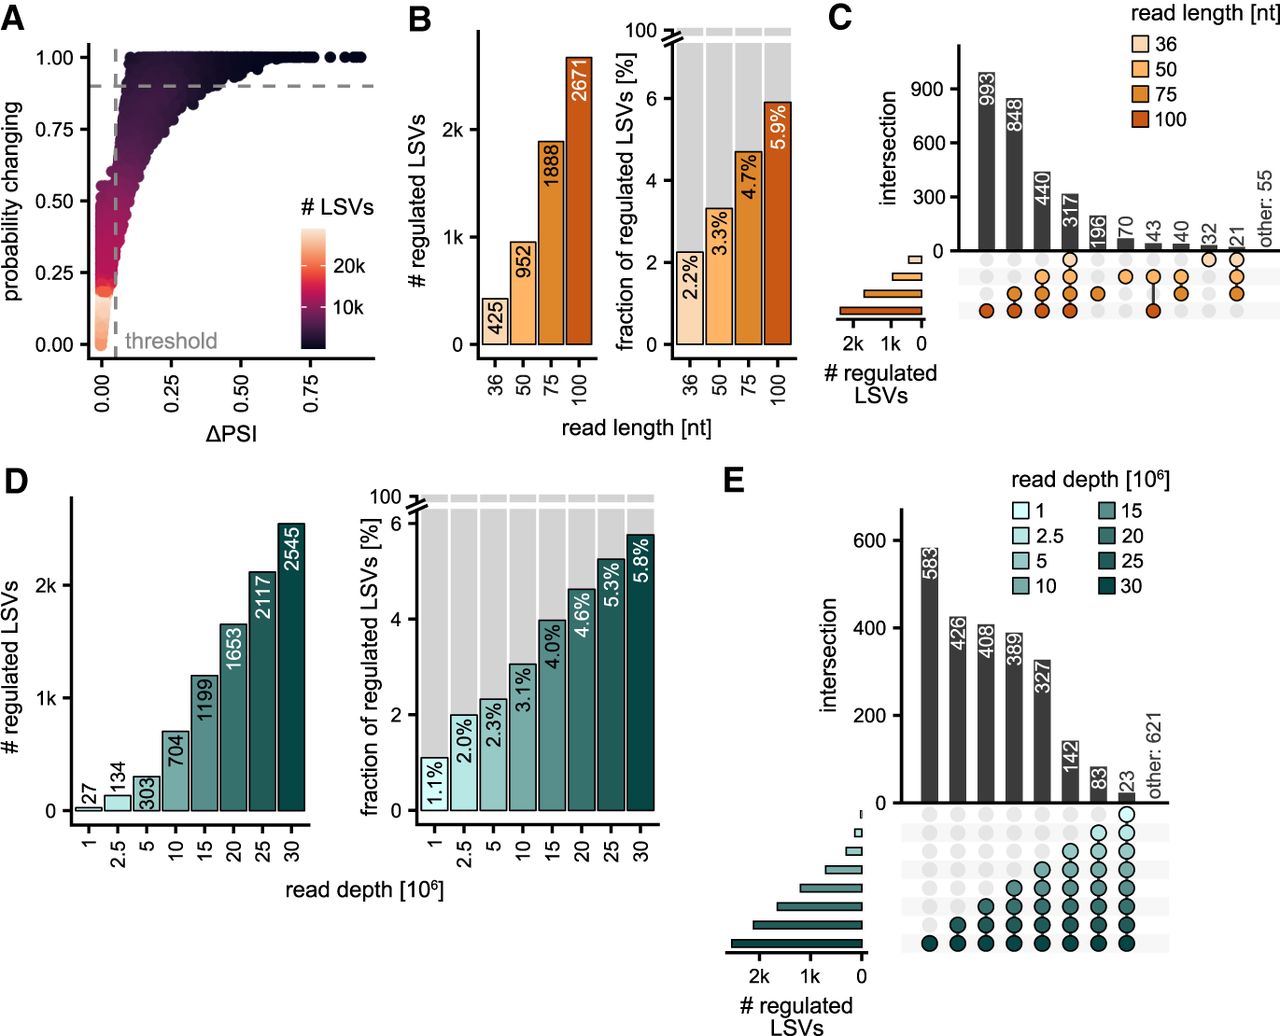
Higher information content leads to a greater sensitivity in the identification of significantly regulated LSVs. (A) Maximum ΔPSI values are plotted against maximum probability changing [P(|ΔPSI| > 0.05)] for each LSV in the U2AF2 KD data set. Dashed gray lines show thresholds for an LSV to be considered regulated [significance threshold: ΔPSI ≥ 0.05 and P(|ΔPSI| > 0.05) ≥ 0.9]. Color refers to the point density. (B–E) Impact of read length (36–100 nt, light to dark orange) and read depth (1–30 M reads, light to dark sea green) on the identification of regulated LSVs. (B,D) Absolute number (left) and fraction (right) of regulated LSVs retrieved for different read lengths (B) and read depths (D). Note that the scale in the right panels is capped at 6%. (C,E) UpSet plot shows overlap of regulated LSVs between test data sets.




