


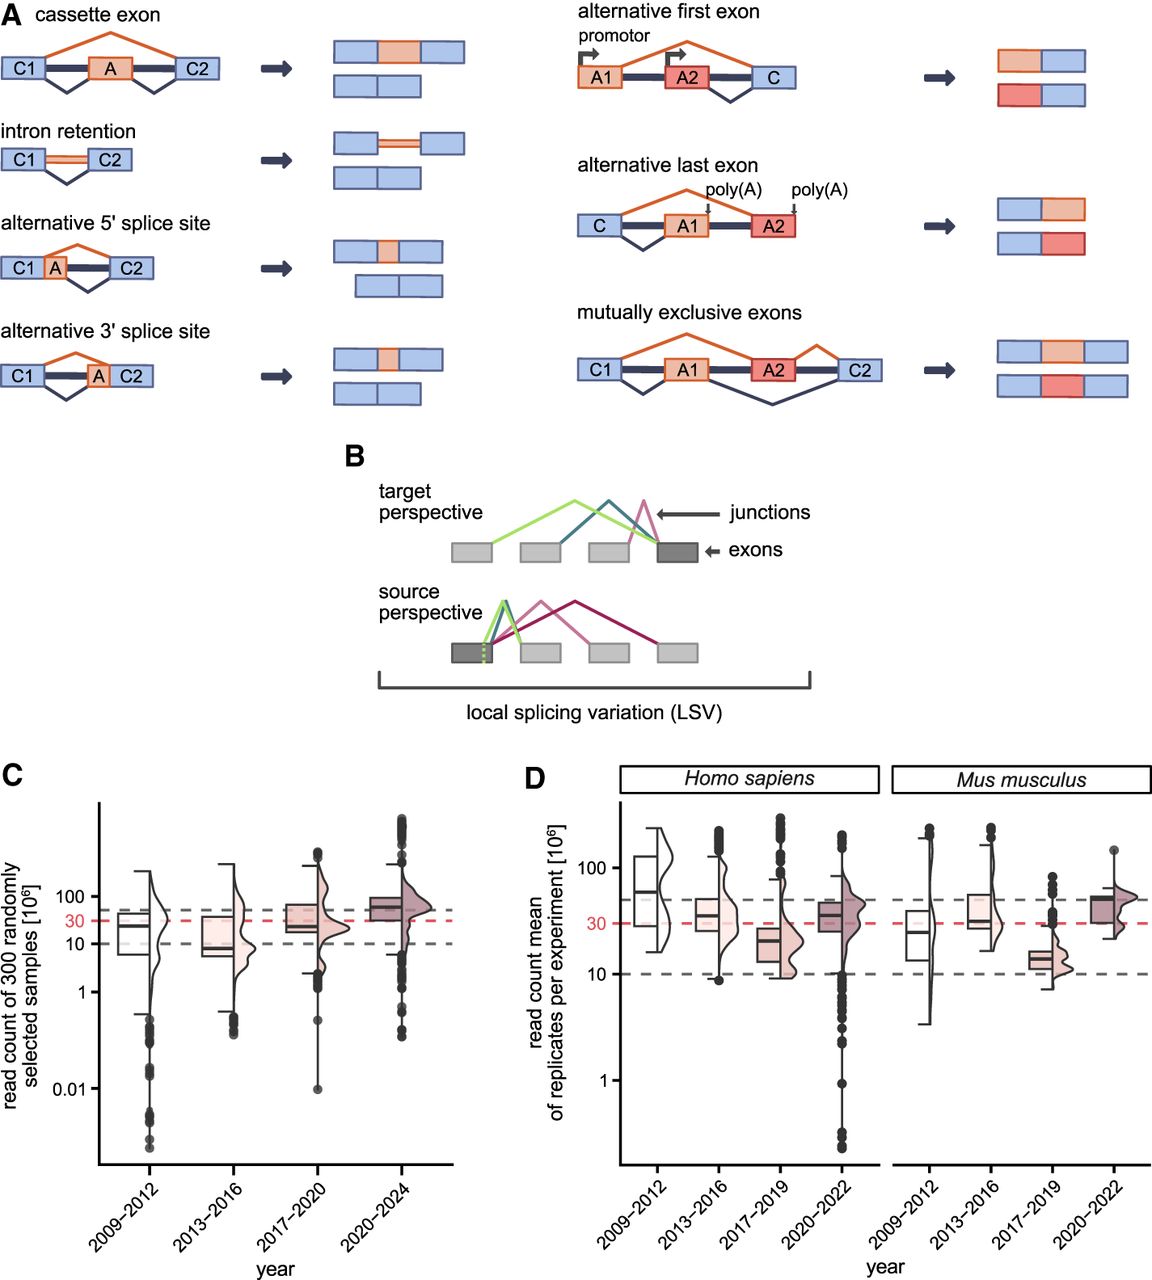
Exon-centric alternative splicing (AS) analysis and distribution of commonly used read depth in RNA-seq. (A) Different types of AS events. Schematic displays pre-mRNA (left) and splice product(s) (right). pre-mRNAs include exons (rectangles), introns (thick lines), and splice junctions (thin lines). Blue elements always remain in the mature mRNA (constitutive [C]), while orange and red elements are alternative (A). (B) Concept of local splice variation (LSV). An LSV describes a reference exon (dark gray) in the splice graph at which splice junctions (colored) can start (source exon) or end (target exon). Exons are displayed as rectangles. (C,D) Read depth of RNA-seq experiments submitted to (C) SRA or (D) ENCODE. Shown are (C) 300 random RNA-seq samples from human cells or tissues per year and (D) all H. sapiens (left) and M. musculus (right) data sets from the ENCODE categories “total RNA-seq,” “polyA plus RNA-seq,” and “shRNA RNA-seq.” Samples are grouped by years (white to dark rose). Plots are depicted as half box plot (left) and half violin plot (right). Box plots depict the median and interquartile range, with whiskers extending to the most extreme data points within 1.5x interquartile range from the quartiles and individual outliers shown as dots. The dashed lines mark 10, 30, and 50 M reads. Note that y-axis is log10-transformed.




