


Stalled translation on transcripts cleaved by RNase L activates signaling important for innate immunity
- Laboratory of Biochemistry and Genetics, National Institute of Diabetes and Digestive and Kidney Diseases, National Institutes of Health, Bethesda, Maryland 20892, USA
- Corresponding authors: nicholas.guydosh{at}nih.gov; karasik.8{at}osu.edu
-
Handling editor: Javier Caceres
Abstract
RNase L is an endonuclease that responds to infections by cleaving most host- and pathogen-derived single-stranded RNAs. This widespread RNA cleavage can lead to death of the infected cell via the ribotoxic stress response (RSR). An ongoing challenge is to understand how RNase L's endonuclease activity triggers cell death to benefit the host. To address this question, we used nanopore-based long-read sequencing to show that 3′ mRNA fragments in the cell were not fully degraded after RNase L activation and that these fragments were translated by ribosomes. We further asked whether ribosomes on mRNA fragments stall when they reach 3′ ends created by RNase L. We used ribosome profiling to capture footprints protected by these ribosomes, which can be identified by their short length (15–18 nt). We found that RNase L activation increased the number of stalled ribosomes at RNase L cleavage sites. Loss of the ribosome rescue factor PELO increased the number of short footprints derived from stalled ribosomes and augmented the RSR. Our work therefore establishes a role for fragmented mRNA in causing ribosome stalling that promotes innate immunity via the RSR.
Keywords
INTRODUCTION
When particularly widespread, endonucleolytic cleavage of mRNAs leads to inflammation and cell death (Castelli et al. 1997; Lin et al. 2007). An endonuclease known to have this role, ribonuclease L (RNase L), is an important factor in the innate immune response, especially in humans where it is linked to many diseases (Carpten et al. 2002; Silverman 2007; Magg et al. 2021; Lee et al. 2023). One common signature of viral infection is the accumulation of viral dsRNA in the cytoplasm. This dsRNA is sensed by cytoplasmic dsRNA-binding proteins, including oligoadenylate synthetases (OAS1–3). When an OAS binds to dsRNA, it produces a small molecule, 2′-5′ oligoadenylate (2-5A), a potent and specific activator of RNase L. Active RNase L cleaves viral single-stranded RNA genomes, RNA replication intermediates, and mRNAs and therefore promotes viral elimination. RNase L activation also induces other processes in the cell and can ultimately cause cell death and benefit the host organism by eliminating the infected cell (Castelli et al. 1997; Banerjee et al. 2015; Chakrabarti et al. 2015). In particular, RNase L widely cleaves host-encoded RNA, including mRNA, and therefore causes its degradation (Burke et al. 2019; Rath et al. 2019). We and others found that this endonucleolytic activity of RNase L also leads to activation of the MAP3 kinase ZAKα (Karasik et al. 2024; Xi et al. 2024). ZAKα senses ribosome stalling and collisions (queuing behind a ribosome that stalls) that can be caused by cellular stress, such as UV radiation (Vind et al. 2020; Wu et al. 2020). ZAKα activation triggers further downstream signaling that is known as the ribotoxic stress response (RSR) (Iordanov et al. 2000). This includes activation of the JNK and p38 MAPKs that induce an inflammatory response and ultimately cell death. However, the exact molecular mechanism of how RNase L activation causes ribosome stalling (and likely collisions) that leads to ZAKα activation is unclear.
Hints for how mRNA fragmentation could lead to ribosome stalling have come from prior studies. In particular, ribosomes stall and collide upon encountering endonuclease-cleaved 3′ ends of mRNA fragments formed during the unfolded protein response (UPR) in yeast, suggesting a model that points to translation of the fragmented mRNA as being critical. These stalling events were rescued (ribosomes were removed from the mRNA) by Dom34, the yeast ortholog of the human PELO (protein pelota homolog), that forms a complex with HBS1L, a GTPase (Guydosh et al. 2017). Whether the PELO–HBS1L complex has a role in rescuing stalled ribosomes after RNase L activation remains unknown. In support of the possibility that mRNA fragments generated by RNase L are translated, we previously reported the observation of ribosome footprints within open reading frames (ORFs) in noncoding regions of mRNAs when RNase L was active using ribosome profiling (Karasik et al. 2021). These elongating ribosomes would be expected to stall if they reached the cleaved 3′ ends or poly(A) tail of mRNA fragments. However, direct evidence for the presence, and translation of, mRNA fragments in the cell remains elusive.
Several methodologies can be used to detect mRNA fragments in the cell and determine if they are translated. Earlier studies used sequencing methodologies such as RtcB-seq and short-read Illumina sequencing to suggest that RNA fragments (including mRNA fragments) may exist for some time in the cell when RNase L is active (Rath et al. 2015; Donovan et al. 2017; Karasik et al. 2021). However, these methodologies are limited in their ability to determine if a read originates from fragmented versus full-length mRNA. Thus, it remains unclear how long mRNA fragments survive decay in the cell during the innate immune response and whether they could be translated or serve other functions. Recent advances in nanopore technologies that sequence the full length of mRNA (Workman et al. 2019) allow for the study of endonuclease cleavage products in cells in a high-throughput manner. For instance, in a recent study using nanopore sequencing, shortening of poly(A)-tailed mRNAs was observed and attributed to an unidentified endonuclease during arsenite stress (Dar et al. 2024).
Several factors could affect the stability of mRNA fragments. The exosome eliminates RNA fragments lacking a poly(A) tail in the 3′ to 5′ direction, while XRN1 degrades uncapped RNAs with a 5′ phosphate in the 5′ to 3′ direction. These decay mechanisms are thought to eliminate unprotected mRNA fragments rapidly, observed within minutes (Tucker and Parker 2000; Hoek et al. 2019). Under certain circumstances, such as RNase L activation, a large amount of RNA fragments could overwhelm these decay machineries, making RNA fragments have a longer half-life (Karasik et al. 2021). Because the 3′ fragments are characterized by a 5′ OH terminus (Wreschner et al. 1981; Cooper et al. 2014) and a 5′ phosphate is the preferred substrate for XRN1, the XRN1-mediated decay process may occur inefficiently or an additional protein is involved in phosphorylating the 5′ end (Sporn et al. 1969; Pellegrini et al. 2008; Shigematsu et al. 2018; Navickas et al. 2020).
In the present study, we asked how active RNase L induces downstream signaling via ribosome stalling. We present evidence that mRNA fragments created by RNase L are detectable in the cell and translated by utilizing direct RNA nanopore sequencing. Additionally, we show that stalled ribosomes are detectable at the end of cleaved mRNAs due to their protection of a small (∼16 nt) footprint and that these are rescued by PELO, allowing it to attenuate downstream signaling via the RSR. Our work therefore reveals how endonucleolytic cleavage of mRNAs is linked via translation to physiological outcomes of the innate immune response.
RESULTS
Activation of RNase L leads to accumulation of mRNA fragments
Previous work showed that poly(A)-selected RNA samples from permeabilized cells where RNase L had been activated and subjected to RNA-seq (poly(A)+ “short-read” RNA-seq) had higher levels of reads that mapped to the 3′ ends of transcripts as compared to 5′ ends (Rath et al. 2015). The enrichment of these 3′ end mapped reads implies that mRNAs cleaved by RNase L are present in the cytoplasm. However, this approach has limitations that make it difficult to determine the nature and abundance of the cleaved mRNAs. For instance, mRNA is fragmented during RNA-seq library preparation (hence the term “short-read sequencing”). This fragmentation step during the library preparation protocol makes it challenging to identify mRNA fragments generated by RNase L. Also, during library preparation, the fragmented samples must be reverse transcribed and then amplified by polymerase chain reaction (PCR), which can introduce bias (Brooks et al. 2025).
To address the question of whether mRNA fragments generated by RNase L are detectable in cells, we adopted direct “long-read” RNA nanopore sequencing (Workman et al. 2019; Dar et al. 2024). This approach circumvents the disadvantages of traditional RNA-seq by directly sequencing the RNA and generates full transcript-length reads. First, we transfected wild-type (WT) and exonuclease deficient (XRN1 KO) A549 human lung carcinoma cells with the RNase L activator, 2-5A. We reasoned that any 3′ end fragment of mRNA that is produced by RNase L cleavage would be stabilized in XRN1 KO cells and thus improve the odds of detection. Active RNase L cleaves rRNA at specific sites (Rath et al. 2019), and these cleavage products can be visualized by separating the RNA by molecular weight. Thus, as is standard in the field, we used total RNA (containing rRNA) from these samples to assess RNase L activation (Supplemental Fig. S1A, red arrows). We found that WT and XRN1 KO cells exhibited similar levels of RNase L activation in 2-5A treated samples. Next, we prepared nanopore sequencing libraries and performed direct RNA sequencing (Fig. 1A; see Materials and Methods for more details). To assess differences between RNase L activated (+2-5A) and control cells (−2-5A, transfection reagent treated but untreated by 2-5A), we first aligned reads to the human genome (see Materials and Methods for details). As the nanopores sequence the RNA from the 3′ to 5′ direction, we expected to observe an enrichment for reads that consisted of only a 3′ portion of the full-length RNA in 2-5A treated samples as compared to a control. These short reads that do not span the entire transcript length are expected to increase in abundance due to mRNA fragmentation by RNase L. Since only poly(A)-tailed transcripts are selected for sequencing through nanopores, 5′ mRNA fragments are not sequenced in these experiments. It is known that a basal level of shorter reads exists in nanopore data and is thought to arise from pore clogging and degradation of the samples during preparation (Prawer et al. 2023; Liu-Wei et al. 2024). Our analysis therefore focused on shortened reads in excess of this background level in control samples prepared at the same time.
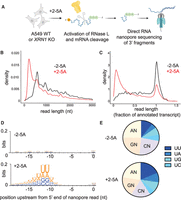
RNase L 3′ cleavage products are detectable after RNase L activation. (A) Schematic representation of direct RNA nanopore sequencing experiments. A549 cells were transfected with 5 µM of 2-5A for 4.5 h, and then total RNA was extracted. RNase L 3′ cleavage products and uncleaved mRNA that contain poly(A) were sequenced. (B) Length distribution of nanopore direct sequencing reads in 2-5A treated (+2-5A) and control (−2-5A) samples in XRN1 KO cells. (C) Normalized length distribution of nanopore direct sequencing reads to their respective annotated reference transcript in 2-5A treated (+2-5A) and control (−2-5A) samples in XRN1 KO cells. (D) WebLogo analysis shows enrichment of U bases in transcriptome positions just upstream of where nanopore sequencing stopped in ±2-5A treated XRN1 KO cells. (E) Dinucleotide motif distribution near the 5′ end of 3′ fragments in ±2-5A treated XRN1 KO cells (−11 to −12 positions to account for RNA left in pore after sequencing stops). The number of total fragments were 212,139 (−2-5A) and 1,012,615 (+2-5A). In both D and E, 3′ fragments were defined as reads that were shorter than a third of their respective annotated transcript.
We observed short reads that spanned a 3′ portion of the transcript on individual genes in RNase L activated samples as compared to their respective control in both WT and XRN1 KO cells (Supplemental Fig. S1B, ACTG1 is shown as an example). This trend was stronger in the XRN1 KO cells, supporting the interpretation that short reads derive from mRNAs that are cleaved and degraded by XRN1 after 2-5A treatment. Interestingly, we noted a small population of full-length reads in 2-5A treated cells. These full-length transcripts could arise from mRNAs that are protected from cleavage by RNase L or from technical artifacts, such as <100% efficiency of 2-5A transfection. Next, we assessed the global length distribution of transcriptome-mapped reads from the nanopore sequencing. We found that shorter reads were more abundant in the length distribution from RNase L activated samples as compared to control samples in both WT and XRN1 KO cells (Fig. 1B; Supplemental Fig. S1C,D). As expected, reads from XRN1 KO cells exhibited a more pronounced shift to shorter lengths as compared to WT, presumably due to stabilization of these 3′ end fragments during RNase L activation. We also normalized the detected read lengths to their corresponding reference transcript length (using MANE reference sequence, see Materials and Methods) to more clearly show the strong emergence of 3′ fragments of mRNA in the samples where RNase L was active, as compared to control samples, and that the lack of XRN1 amplified this effect (Fig. 1C; Supplemental Fig. S1E,F).
To further validate that the detected 3′ mRNA fragments arose from RNase L cleavage, we analyzed transcriptome sequences immediately upstream of the 5′ mapped end of these mRNA fragment reads. In this case, we defined mRNA fragments as those shorter than one-third of the length of the full-length annotated reference transcript that mapped to the 3′ end. It has been reported that the RNase L cleavage motif is UN^N (Rath et al. 2015) with preference for UU^N and UA^N based on reconstituted assays (Floyd-Smith et al. 1981). Therefore, we expected enrichment of these motifs in our analysis. We focused on the region 10–15 nt upstream of the 5′ end of the reads due to the inability of the nanopores to sequence to the very 5′ end of mRNAs (Katopodi et al. 2025). In particular, we found that positions 11–12 nt upstream of the 5′ end of the read exhibited the highest information content for nucleotide preference as determined by bit depth (Fig. 1D; Supplemental Fig. S1G). Focusing on these positions, we found an enrichment of U and A nucleotides in treated (+2-5A), but not in untreated (−2-5A), samples. This preference is consistent with the view that mRNA fragment reads derive from mRNAs that are cleaved by RNase L. We also found that the proportional share of reads with U at position −12 increased in RNase L activated samples as compared to controls (Fig. 1E; Supplemental Fig. S1H), further supporting the idea that the detected mRNA fragments are the result of RNase L activation. Notably, we observed that UU, UA, and UG motifs increased, while UC decreased in relative proportion, in agreement with previously described cleavage preferences in cell lysate (Rath et al. 2015). Interestingly, RNase L cleavage motifs in both WT and XRN1 KO conditions were similarly detectable and showed comparable proportions within fragments (Fig. 1; Supplemental Fig. S1). This suggests that XRN1 does not discriminate based on the origin of the fragments (RNase L cleaved vs. those arising from other decay processes). These data indicate that the 3′ fragments left after mRNA cleavage by RNase L are readily detectable in the cell.
mRNA fragments generated by RNase L are bound by ribosomes
Based on evidence from ribosome profiling data, we previously proposed that ribosomes may translate mRNA fragments created by RNase L (Karasik et al. 2021, 2024). To further test this model, we combined the above direct “long-read” nanopore sequencing method with sucrose gradient sedimentation to determine whether RNase L cleaved mRNA fragments were translated. Using this “polysome profiling” approach, fragments that are translated (or bound by stalled ribosomes) would be expected to migrate with ribosome-bound fractions in the gradient.
Since we detected high levels of RNase L cleaved mRNA fragments in XRN1 KO cells, we used this cell line for these experiments to maximize the odds of detecting translation. XRN1 KO cells were transfected with 2-5A (+2-5A, RNase L activator) or treated with the transfection reagent (−2-5A control) (Fig. 2A). Then, we collected cell lysates and performed polysome profiling. We loaded lysate onto a 10%–50% sucrose gradient that allowed separation of mRNAs loaded with ribosomes from the untranslated mRNAs by ultracentrifugation. Based on peaks in the UV absorbance reading, we collected fractions corresponding to monosomes, a single 80S ribosome, and polysomes (mRNAs bound to two or more ribosomes). The 80S fraction can include both “vacant” 80S ribosomes that lack mRNA and mRNAs bound to only one ribosome. In the control (−2-5A) lysates, we observed the expected distribution of ribosomes for unperturbed cells along the sucrose gradient with many ribosomes in both the “light” and “heavy” polysome fractions (Fig. 2B). In contrast, in 2-5A treated samples, most ribosomes were found in the monosome (80S) fraction, while the polysome fractions were drastically reduced with the heaviest polysomes eliminated entirely (Fig. 2B) as compared to control cells. This loss of polysome peaks has been noted before (Rath et al. 2019) and likely occurs because mRNA levels in the cell are drastically reduced due to degradation, estimated at a level of 90% in previous reports where spike-in controls were utilized for normalization (Burke et al. 2019; Rath et al. 2019). Our observation that polysome peaks are reduced in 2-5A treated samples (Fig. 2B) suggests that fragments in the polysome pool are bound to a small number of ribosomes. We collected the small amount of total RNA present in the ribosome-bound fractions in both treated (+2-5A) and untreated (−2-5A) cells and sequenced it by direct RNA nanopore sequencing as above (Fig. 2A). We found that both the monosome and polysome fractions contain 3′ mRNA fragments at levels similar to the total RNA control and far greater than respective −2-5A controls (Fig. 2C; Supplemental Fig. S2A,B). We also found similar RNase L cleavage motif patterns just upstream of the 5′ end of the fragments in the monosome and polysome fractions as in total RNA (Fig. 2D,E; Supplemental Fig. S2C, compare to 1D,E). While we cannot precisely determine what proportion of the total population of 3′ fragments that are generated by RNase L gets translated, the data suggest that at least some of these fragments can be loaded with one or a small number of ribosomes (or were perhaps already loaded prior to RNA cleavage) and are either engaged in active translation or stalled.
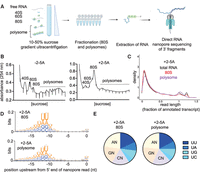
3′ Fragments generated by RNase L are translated. (A) Schematic representation of polysome profiling experiments coupled with direct RNA nanopore sequencing. XRN1 KO A549 cells are transfected with 5 µM of 2-5A for 4.5 h. Then, lysates were subjected to sucrose gradient centrifugation. 80S and polysome fractions were collected, and RNA was extracted. Then, RNase L 3′ cleavage products and uncleaved mRNA that contained poly(A) were sequenced with direct RNA nanopore sequencing. (B) Polysome profiles of 2-5A treated (+2-5A, right panel) and untreated (−2-5A, left panel) cell lysates. RNA content was monitored by absorbance at 254 nm. Note that the underlined area shows fractions retained for polysome analysis. (C) Normalized length distribution of nanopore direct sequencing reads to their respective annotated reference transcript in total RNA as compared to monosomes and polysomes in 2-5A treated XRN1 KO cells shows fragmentation in all cases. (D) WebLogo analysis shows enrichment of U bases in transcriptome positions just upstream of where nanopore sequencing stopped in the 80S and polysome fractions of sucrose gradient sedimentation experiments in 2-5A treated XRN1 KO cells. (E) Proportion of each dinucleotide motifs near the 5′ end of 3′ fragments in 80S and polysome fractions of 2-5A treated XRN1 KO cells. The number of total fragments were 181,347 (80S) and 27,648 (polysome). In both D and E, 3′ fragments were defined as reads that were shorter than a third of their respective annotated transcript that mapped to the 3′ end.
Deletion of the exonuclease XRN1 leads to increased mRNA fragment translation
As noted above, in our previous study we observed that the relative proportion of ribosome footprints increased in untranslated regions of mRNAs, including the 5′- and 3′-UTR regions as well as out-of-frame parts of coding sequences, as compared to the translated regions when RNase L was activated (Karasik et al. 2021). This phenomenon was termed “altORF translation” because the footprints corresponded to distinct (alternate) open reading frames (ORFs) in these noncoding regions. Our interpretation of these data was that ribosomes could initiate on 3′ mRNA cleavage products and translate an open reading frame within the fragments (Karasik et al. 2021, 2024). Since we observed higher amounts of RNase L generated 3′ fragments in XRN1 KO cells than in WT cells (Fig. 1; Supplemental Fig. S1), it is expected that the KO cells should also exhibit a higher proportion of translation in altORFs than in WT cells.
To test this hypothesis, we transfected WT and XRN1 KO cells with 2-5A and performed ribosome profiling, a high-throughput ribosome footprinting approach that utilizes short-read Illumina sequencing (Fig. 3A; see Materials and Methods). The RNase L activity levels were confirmed to be comparable by rRNA cleavage assay (Supplemental Fig. S3A). The most readily detected signature of altORF translation is a relative increase in ribosome footprints in the 3′UTR because this noncoding region of the mRNA is rarely translated by ribosomes under normal conditions (Karasik et al. 2021). We used the ratio of 3′UTR to coding sequence (CDS) ribosome profiling reads to quantify the difference between control (−2-5A) and RNase L activated cells (+2-5A) and therefore assess the relative increase in altORF translation. We found that 2-5A treatment of XRN1 KO cells led to an increase in the 3′UTR:CDS ratio as compared to similarly treated WT cells (Fig. 3B). This is consistent with a model where additional 3′ mRNA fragments in XRN1 KO cells result in an increased proportion of ribosomes engaged in altORF translation. Additional analysis of averaged ribosome footprint levels (“metagene” analysis) further supported this interpretation. When we averaged the data in this way for all genes by aligning them by their stop codons (Fig. 3C), we noted a higher level in the 3′UTR that is consistent with the above ratio-based analysis. We then performed metagene analysis on altORFs by aligning them by their start codons. This analysis provided strong evidence of translation, as exhibited by the 3 nt periodicity along the altORFs in 2-5A treated XRN1 KO cells as compared to similarly treated WT cells (Fig. 3D). RNase L activation also increases the proportion of ribosome footprints in 5′UTRs (Karasik et al. 2021). We speculated that deletion of XRN1 would not affect the share of these footprints since endonuclease-cleaved 5′ mRNA fragments are mostly degraded 3′ to 5′ by the exosome. In agreement with this prediction, we found that ribosome footprints in the 5′UTR were not elevated in XRN1 KO cells as compared to WT during RNase L activation (Supplemental Fig. S3B–D).
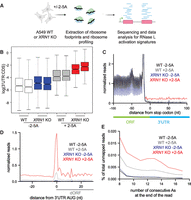
XRN1 KO cells exhibit stronger signatures of altORF translation compared to WT due to RNase L activation. (A) Schematic representation of ribosome profiling experiments. WT and XRN1 KO A549 cells were treated with 5 µM 2-5A for 4.5 h. Then, lysates were used for ribosome profiling of 25–34 nt footprints. Data were analyzed for altORF translation signatures. (B) 3′UTR:CDS ratios increase due to 2-5A treatment and are further elevated in XRN1 KO cells. The effects on the mean ratios are significant due to 2-5A (ANOVA P < 0.001), KO of XRN1 (ANOVA P = 0.002), and the combined interaction of both effects (ANOVA P = 0.020). Boxes represent the interquartile range (IQR), and the horizontal line is the median. Whiskers show the most extreme data point no more than 1.5 × IQR, and notches are 1.58 × IQR∕√N. Nine hundred forty-eight genes included. (C) Normalized average ribosome footprint occupancy (metagene plot) around the stop codon of main ORFs (CDSs) reveals increased relative ribosome footprint levels in the 3′ UTRs when RNase L is activated versus the respective control. XRN1 KO cells further exhibit increase in 3′UTR footprints as compared to WT. Ribosome footprints are plotted by 5′ assignment without any shift. (D) Normalized average ribosome footprint occupancy around the start codon of downstream ORFs in the 3′UTR reveal 3 nt periodicity and increased translation during RNase L activation in XRN1 KO cells as compared to WT cells. Ribosome footprints are plotted by 5′ assignment shifted by 12 nt (∼P site). (E) Percentage of ribosome profiling footprints in samples prior to mapping that contained a given length of consecutive poly(A) sequences (8–17 nt) at their 3′ end in WT and XRN1 KO cells. Total read counts >1000 for all samples. These represent ribosomes that run into the poly(A) tail.
An additional expectation of translation in 3′UTRs is that, in some cases, ribosomes may not encounter a stop codon after initiating translation and would therefore translate the poly(A) tail. Translation of poly(A) is known to slow down or stall ribosomes engaged in elongation (Koutmou et al. 2015; Guydosh and Green 2017; Chandrasekaran et al. 2019; Tesina et al. 2020). In yeast, when conditions favor accumulation of ribosomes in poly(A) tails (Guydosh and Green 2014), ribosome footprints were found to protect a short stretch of poly(A) (8–15 nt) at the 3′ end of reads that did not map to the transcriptome since poly(A) tails are not encoded. To assess whether this occurred following RNase L activation, we quantified the percentage of reads that contain stretches of consecutive As at the 3′ end of ribosome profiling reads that did not map to the transcriptome (see Materials and Methods). We found that the abundance of these reads was somewhat increased by RNase L activation as compared to control cells and further elevated in 2-5A treated XRN1 KO cells (Fig. 3E; Supplemental Fig. S3E). These data are consistent with a model where RNase L activation leads to translation of the most distal 3′ mRNA fragments and results in ribosomes stalling in poly(A) tails of mRNAs.
Ribosomes stall at RNase L cleavage sites
RNase L is known to activate ZAKα, a MAP3K that recognizes collided ribosomes (Karasik et al. 2024; Xi et al. 2024). Based on this finding, we proposed that ribosomes stall and potentially collide at the 3′ ends of 5′ mRNA fragments that are created by RNase L. Prior work in yeast showed that such stalled ribosomes could be detected at cleavage sites that are generated by another endonuclease, Ire1 (Guydosh et al. 2017). Such footprints are distinct from ribosomes engaged in normal elongation because they protect a shorter footprint (∼16 vs. ∼28 nt). These footprints are shorter since the cleaved mRNA 3′ end becomes positioned in the decoding center of the ribosome and no mRNA extends further into the mRNA entry channel (Fig. 4A). Here, we used this short ribosome profiling method to detect stalled ribosomes at the 3′ ends created by RNase L cleavage. We treated A549 WT cells with 2-5A and performed modified ribosome profiling, where we selected for a wider range of footprints (15–34 nt), to capture short (15–18 nt, also termed “16-mer”) and full-length (25–34 nt, also called “28-mer”) ribosome footprints in the same sample (Fig. 4A; see Materials and Methods for details).
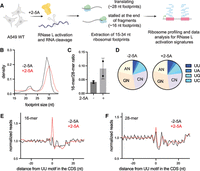
Short profiling footprints are increased at RNase L cleavage sites. (A) Schematic representation of ribosome profiling experiments. RNase L was activated by transfection of 2-5A for 4.5 h, and then cell lysates were subjected to ribosome profiling. We then performed size selection of 15–34 nt ribosome protected footprints to concurrently capture stalled ribosomes at the 3′ end of mRNA fragments (∼15–18 nt) and translating ribosomes (25–34 nt). Data were then analyzed to capture changes in length distribution of footprints and for RNase L signatures. Cells were treated with control siRNA to facilitate comparison with data in Figure 5. (B) Normalized length distribution of transcriptome-mapped ribosome profiling reads (15–34 nt): 3,135,785 reads for −2-5A and 3,790,034 reads for +2-5A. (C) Ratio of 16-mers (15–18 nt) to 28-mers (25–34 nt) in RNase L activated cells. Whiskers represent standard deviation between replicates; further analysis in Figure 5D. (D) The 3′ end dinucleotide motif distribution in 16-mer reads. Proportion of short footprints (15–18 nt) containing UN motif at their 3′ end is modestly increased in 2-5A treated cells. Number of 16-mer reads was 109,319 (−2-5A) and 333,784 (+2-5A). With replicate in Supplemental Figure S4B, P = 0.027 by t-test. (E,F) Position average plot of 3′ ends of 16-mers (E) and 28-mers (F) at RNase L cleavage sites (UU). 16-mers exhibit a peak at UU motifs when RNase L is active, consistent with ribosomes stalled on 3′ mRNA fragments. Ribosome footprints are plotted by 3′ assignment (no shift).
We found that RNase L activation somewhat shifted the size distribution of ribosome profiling footprints as the 16-mer footprints became proportionally more abundant in 2-5A treated cells than in control (Fig. 4B; Supplemental Fig. S4A). To quantify these changes, we also computed ratios of short and full-length footprints (16-mer/28-mer ratios). We found that the 16-mer/28-mer ratio increased upon RNase L activation, consistent with ribosomes stalling at the 3′ ends of cleaved 5′ mRNA fragments (Fig. 4C). In addition, we note that a small 21 nt peak in the data decreased along with the 28 nt peak. This 21 nt peak is known to be a minor population of footprints and is created by ribosomes with an empty A site (Wu et al. 2019). The loss of this peak in tandem with the 28 nt peak lends support to our interpretation that the global population of 16-mer ribosome footprints increases in proportion to other species in the cell to some extent.
Since we observed an enrichment for UN^N cleavage motifs in transcripts just upstream of the sites where RNase L cleaved the RNA in our nanopore sequencing experiments (Fig. 1), we examined the nature of the sequences just upstream of the 3′ end of the 16-mer footprints. We found that the 3′ end dinucleotide sequence was somewhat more enriched in UN in 2–5A treated cells as compared to control (Fig. 4D; Supplemental Fig. S4B). To further study RNase L cleavage motifs in short footprints, we aligned the 3′ ends of 16-mer and 28-mer reads at UU motifs in the CDS to create an average plot (Fig. 4E,F; Supplemental Fig. S4C,D). We found a modest accumulation of 16-mers at UU motifs in 2-5A treated cells as compared to the control cells, suggesting enrichment of RNase L cleaved 3′ ends in short footprints. This further supports our model that ribosome stalling occurs at the RNase L cleaved ends of mRNA fragments. However, we note that these signatures of RNase L cleavage were less pronounced compared to those in nanopore sequencing data (Fig. 1). This is expected because the footprints rely on a ribosome being stably associated with 3′ ends, whereas the nanopore sequencing does not. Stable association of the ribosome on a 3′ end can be antagonized by ribosome rescue activity in the cell, particularly by PELO (see below).
As the ribosome collision (disome) sensor ZAKα (Huso et al. 2025) is activated by 2-5A, we asked whether we could detect the formation of disomes in the cell. We used sucrose density gradient ultracentrifugation of lysates treated with RNase A to eliminate mRNA between ribosomes that were not immediate neighbors, including collided disomes (Wu et al. 2020). We found that RNase L activation (+2-5A) did not increase the disome peak relative to the 80S peak (Supplemental Fig. S4E). As a positive control, anisomycin induced the expected increase in the disome peak. However, unlike anisomycin, RNase L activation likely results in an 80S peak where most ribosomes are not bound to mRNA (“empty” 80S ribosomes) due to widespread mRNA degradation (Fig. 2B). Thus, we postulate that the 80S/disome ratio measured during RNase L activation is not informative of ZAKα-induction. More ZAKα could be available for detecting disomes when RNase L is active compared to normal cells, or the conformation of any disomes formed may be more adept at recruiting ZAKα. Another study reported a modest increase in the disome population in a slightly different experiment that was performed at a shorter time point and utilized an unpurified mixture of 2′-5′-oligoadenylates and a different endonuclease (MNase) (Xi et al. 2024). While we were unable to find conditions (time point and 2-5A concentration) that would result in an increased disome peak, other assay factors may be critical given that the lead ribosome of a disome complex on a 3′ end may differ in stability given it would cover only 16, rather than 28, nt of mRNA.
PELO rescues stalled ribosomes on mRNAs generated by RNase L activation
PELO is a rescue factor that can facilitate disassembly of stalled 80S ribosomes, with a preference for those at the 3′ end of endonuclease-cleaved mRNAs (Shoemaker et al. 2010; Becker et al. 2011; Guydosh and Green 2014; Hilal et al. 2016; Shao et al. 2016; Guydosh et al. 2017). We therefore asked whether PELO has a role in recycling the ribosomes we observed to be stalled on the 3′ ends of 5′ cleavage fragments (Fig. 5). We performed “knockdown” (KD) experiments against PELO combined with treatment of 2-5A in WT A549 cells. Then we performed ribosome profiling for 15–34 nt footprints (Fig. 5A). The efficiency of PELO KD was monitored by western blotting, and PELO protein levels were notably decreased (Fig. 5B). The efficiency of RNase L activation was comparable across the samples (Supplemental Fig. S5A). We reasoned that reducing the amount of PELO would increase levels of ribosome stalling and collision, leading to increased activation of the MAP kinases JNK and p38 downstream from ZAKα. Thus, we monitored these kinases’ phosphorylation state using western blotting under RNase L activation. Indeed, we found that KD of PELO increased activation JNK and p38 in 2-5A treated samples as compared to control siRNA treated cells (Fig. 5B). Consistent with this, we found that short ribosome footprints increased more significantly in PELO KD cells when RNase L was activated as compared to the control siRNA treated cells (Fig. 5C,D; Supplemental Fig. S5B). Additionally, we observed an increase in the average level of 3′ ends of short footprints at UU motifs in average plots for short footprints in 2-5A treated PELO KD cells compared to WT (Fig. 5E; Supplemental Fig. S5C). Since the lack of a full knockdown and residual PELO in the cells could limit this trend, we additionally performed these experiments in HAP1 PELO KO cells where PELO was fully eliminated. We note that these cells are difficult to transfect with 2-5A, and activation of 2-5A in rRNA cleavage assays is not prominent (Supplemental Fig. S5D). Regardless, we observed a stronger accumulation of 16-mer footprints at UU motifs in 2-5A treated PELO KO HAP1 cells than in A549 PELO KD cells (Fig. 5F). We noted that 2-5A treatment did not increase average 16-mer footprints at UU motifs in WT HAP1 cells, presumably due to the low RNase L activation (Supplemental Fig. S5D). Our results suggest that PELO has a role in rescuing stalled ribosomes on mRNA fragments that are created by RNase L and may tune the innate immune response through the RSR.
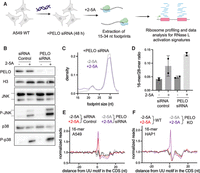
PELO rescues stalled ribosomes at the 3′ end of mRNA fragments during RNase L activation. (A) Schematic representation of experiments. A549 WT cells were treated with PELO siRNA or control siRNA for 48 h followed by transfection with 2-5A or lipofectamine alone (−2-5A). Cells were collected, and ribosome profiling for 15–34 nt footprints was carried out. (B) Western blot assay levels of protein during RNase L activation and PELO knockdown. Comparison of PELO abundance (upper panels) shows effectiveness of knockdown. JNK and p38 phosphorylation (increased by 2-5A) were followed by western blotting with their respective phospho-antibody while also monitoring for total protein levels (lower panels). (C) Normalized length distribution of transcriptome-mapped ribosome profiling reads (15–34 nt): 12,216,111 reads for −2-5A and 3,174,541 reads for +2-5A. (D) To analyze the effects of RNase L activation (2-5A treatment), the ratio of 16-mers (15–18 nt) to 28-mers (25–34 nt) was computed and found to be more significant when PELO was knocked down (P = 0.002 for KD and 0.11 for control comparisons by t-test). Whiskers represent standard deviation between replicates. (E,F) Position average plot of 3′ ends of 16-mers near RNase L cleavage motif (UU) in PELO KD A549 cells (E) and PELO KO HAP1 cells (F). Control data in D and E same as in Figure 4.
DISCUSSION
A long-standing challenge is to understand how RNase L's cleavage activity promotes death of infected cells and therefore immunity for the host organism. Our prior results that RNase L activity causes (1) a proportional increase in translation of altORF sequences (Karasik et al. 2021) and (2) activation of the ZAKα ribosome collision sensor (Karasik et al. 2024; Xi et al. 2024) indicated that RNase L mediates cellular responses via translation. However, the mechanistic relationship linking mRNA cleavage, translation, and ribosome stalling remained ambiguous. In this study, we have now established that the fragmented mRNA created by RNase L can be directly detected and that it is bound by ribosomes. We have also established that the ribosomes translating these fragments stall at the cleaved 3′ ends protecting a shorter footprint. This stalling, and potentially collision with upstream ribosomes, activates ZAKα and the RSR, which has been reported to trigger cell death and could therefore promote innate immunity (Fig. 6). Additionally, we found that the ribosome rescue factor PELO rescues stalled ribosomes at the 3′ ends of mRNA fragments and thus tunes the effects of RNase L's downstream signaling (Fig. 6).
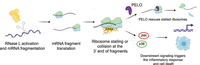
RNase L activation results in detectable amounts of mRNA fragments that are translated. Ribosomes stall at the end of the cleaved mRNA fragments and can be rescued by PELO (top pathway). They also induce activation of ZAKα and the downstream RSR that is known to lead to an inflammatory response and cell death via JNK and p38 (bottom pathway). When PELO is depleted or not expressed, ribosomes are not efficiently rescued. This leads to an accumulation of stalled ribosomes and therefore more persistent activation of the RSR. In this way, PELO serves to tune activation of the RSR.
Our use of direct nanopore sequencing showed that RNase L cleaved mRNA fragments are present in the cell and increase in cells lacking the 5′ to 3′ exonuclease XRN1. Interestingly, the relative length of these species did not substantially change between WT and XRN1 KO cells (Fig. 1B,C; Supplemental Fig. S1C–F), suggesting that once XRN1 engages with a fragmented mRNA, the degradation occurs rapidly. The observation that even under WT conditions (when XRN1 is present), a large number of RNase L cleaved RNA fragments persists suggests that the RNA decay machinery may be overwhelmed. It is also possible that since RNase L leaves a 5′-OH on the 3′ cleavage fragment (Wreschner et al. 1981; Cooper et al. 2014), there is some resistance to degradation because mRNA fragments with these ends are not ideal substrates for XRN1 (Sporn et al. 1969; Pellegrini et al. 2008; Shigematsu et al. 2018). As these direct RNA nanopore sequencing experiments exclude studying mRNA fragments without a poly(A) tail (i.e., fragments including the 5′ end or intermediate segments of the mRNA), the development of alternative technologies to assess their abundance is needed. In addition, it would be of interest to explore the stability of fragments created by other endonucleases, such as IRE1, SMG6, and others that have not yet been identified (Eberle et al. 2009; Ibrahim et al. 2018; Wek et al. 2023).
The stability of mRNA fragments that are generated by RNase L raises the question of whether they serve a function. It has been suggested that these fragments can form dsRNA and then bind RIG-I to induce the interferon production (Malathi et al. 2007), but these effects have not universally been observed (Burke et al. 2019; Rath et al. 2019; Karasik et al. 2021). Intriguingly, recent work showed that the loss of the 3′ to 5′ decay pathway via the exosome could enhance the transcription of genes that are sensitive to interferon, suggesting this function is tuned by the activity of this decay pathway (Yang et al. 2024).
Another function of the mRNA fragments relates to their translation. While activation of RNase L results in a sharp reduction in overall translation, as evidenced by the reduction in polysome peaks from a sucrose gradient, a residual pool of mRNAs that includes mRNA fragments is translated by either a single ribosome or small number of ribosomes. This translation activates the ribosome collision sensor ZAKα, and several mechanistic scenarios could potentially account for this. One possibility is that some altORFs within 3′ mRNA fragments lack a stop codon and instead lead into the poly(A) tail (Guydosh and Green 2014). Our data showed that the proportion of ribosomes that run into the poly(A) tail increased during RNase L activation, and this effect was exacerbated in XRN1 KO cells when compared to WT (Fig. 3E). These ribosomes in the poly(A) tail may lead to ribosome collisions that activate ZAKα. Another possibility is that ribosomes translating the CDS or an altORF within a 5′ or internal mRNA fragment could encounter a 3′ cleaved end. In prior studies, ribosomes that encountered the cleavage sites created by the endonuclease Ire1 protected a short 16-mer footprint (Guydosh et al. 2017). Similarly, here we observed a global increase in the relative proportion of these short footprints in cells where RNase L was active. While we did not observe an increase in RNase-insensitive disomes (Supplemental Fig. S4E) in cells where RNase L was active, we cannot rule out the possibility that ribosome collisions capable of activating ZAKα occur at a low level or require different assay conditions for detection (i.e., choice of endonuclease).
We also asked the question of whether the ribosome stalling that is induced by RNase L could be modulated by the cell as a way to tune the downstream signaling to the RSR. We found that the reduction in the ribosome rescue factor PELO increased the level of stalling at RNase L's UN^N cleavage sites and augmented the RSR. Loss of PELO has also been reported to activate mTOR (Liakath-Ali et al. 2018). As mTOR activation is associated with higher levels of translation, this effect may also increase ribosome collisions and therefore further amplify the RSR. Given that SKIV2L is responsible for degradation of 5′ fragments, SKIV2L elimination could also enhance stalling and the RSR. In this way, the ribosome rescue and decay machinery could be potentially tuned to regulate the innate immune response. Thus, developing inhibitors and or activators that target PELO could be considered for therapeutics. Interestingly, PELO was reported to directly associate with active RNase L to target exogenous RNA in the cell (Nogimori et al. 2019). How this interaction affects the efficiency or locus of RNase L cleavage activity remains an open question. Beyond ribosome stalling induced by endonucleolytic cleavage of mRNA, the RSR can be activated by other activators of ribosome stalling, such as ribosome inhibitors (anisomycin) or UV light (Vind et al. 2020; Wu et al. 2020; Sinha et al. 2024). While PELO is known to have specificity for ribosomes stalled with an A site that lacks mRNA (Shoemaker et al. 2010; Becker et al. 2011; Guydosh and Green 2014; Hilal et al. 2016; Shao et al. 2016; Guydosh et al. 2017), it is of interest to consider whether PELO (or other ribosome rescue factors) more broadly tune the RSR.
Our work establishes a model for how endonucleolytic cleavage by RNase L alters translation to evoke changes in key cellular pathways, such as the RSR, that have been reported to trigger cell death. Since many endonucleases are involved in maintaining cell homeostasis and are important for responding to stress, it is possible that some of these findings apply to other endonucleases. It is also conceivable that endonucleases could be induced or added to cells for use as therapies to treat diseases such as cancer (Ardelt et al. 2008). In addition, viral endonucleases, such as coronavirus endonucleases (Thoms et al. 2020), are capable of broadly degrading host mRNAs. This suggests that the outcome of widespread endonucleolytic cleavage may not always be beneficial to the host. Addressing whether the activities of other endonucleases activate ZAKα or have other impacts on translation is a key question for the future with important implications for human health.
MATERIALS AND METHODS
Cell culture
WT and XRN1 KO A549 lung carcinoma cells were cultured in RPMI (Gibco 60870127) complemented with 10% fetal bovine serum (Gibco A56704). HAP1 WT and PELO KO cells were cultured in IMEM RPMI complemented with 10% fetal bovine serum (Gibco A56704). Cells were tested and negative for Mycoplasma contamination throughout the study. Mycoplasma testing was performed using e-Myco VALiD Mycoplasma PCR Detection Kit (BioLink) or ATCC Universal Mycoplasma Detection Kit. Cells were incubated at 37°C in the presence of 5% CO2. A549 cell lines used in this study were a kind gift of Dr. Bernie Moss (NIH) and generated as described (Liu and Moss 2016). HAP1 WT and PELO KO cell lines were purchased from Horizon (catalog number HZGHC005109c001).
rRNA cleavage assay
Total RNA was extracted from ∼106 cells or 30–50 µL ribosome profiling cell lysates using RNeasy kit (QIAGEN) according to the manufacturer's protocol. The amount of total RNA was computed by absorbance at 260 nm measured by NanoDrop spectrophotometer (Thermo Fisher Scientific) and then diluted to 50–200 ng/µL. Then, RNA samples were run on a TapeStation 4150 with the Agilent RNA ScreenTape assay. Data visualization was done by TapeStation Analysis Software 4.1.1.
Synthesis and purification of 2-5A
2-5A was synthesized by recombinant human OAS1 in an in vitro assay as described previously (Karasik et al. 2021, 2024). First, recombinant OAS1 (p42) containing an N-terminal His tag was expressed in BL21(DE3) Escherichia coli as described before (Poulsen et al. 2015) or with an alternative protocol using autoinduction media (Studier 2005). Cells were pelleted by centrifugation at 7000g for 15 min at 4°C and lysed in B-PER protein extraction reagent (4 mL/g bacterial pellet) in the presence of cOmplete mini protease inhibitor cocktail (Roche) for 15 min at room temperature. Next, bacterial lysate was cleared by centrifugation at 34,000g for 1 h at 4°C. The supernatant was filtered (45 µm pore size, Millipore) and loaded onto a HisTrap (GE Healthcare) nickel column. The column was washed with wash buffer (20 mM Hepes pH 7.5, 300 mM NaCl, 10% [vol/vol] glycerol, 1 mM TCEP, and 50 mM imidazole), and OAS1 was gradient eluted with 500 mM imidazole. Protein fractions were then evaluated by SDS-PAGE and Coomassie staining. Then, OAS1 containing fractions were pooled, concentrated, and buffer exchanged (Zeba Spin Desalting Column, 7K MWCO, Thermo Scientific) in storage buffer (20 mM Hepes [pH 7.5], 300 mM NaCl, 10% [vol/vol] glycerol, and 1 mM TCEP). Final protein preparation was stored in storage buffer at −80°C. Concentration of OAS1 was determined by using NanoDrop Spectrophotometer (Thermo Fisher Scientific) (Mw = 41.5 g/mol and ε = 65,485 M−1 cm−1).
To produce 2-5A, 2 µM purified OAS1 was incubated with 1.25 OD260 poly I:C in the presence of 10 mM ATP, 20 mM Hepes (pH 7.5), 50 mM NaCl, 30 mM MgCl2, 10% (vol/vol) glycerol, and 4 mM DTT at 30°C for 2 h. To stop the reaction, samples were incubated at 85°C for 15 min. Then the samples were filtered (22 µm pore size Millipore filter), and the different 2-5A species were separated on a 16/10 Mono Q column as described before (Poulsen et al. 2015). The same 2-5A fractions from several runs were pooled and run again on a 16/10 Mono Q column to achieve higher concentrations. 2-5A concentration was estimated by NanoDrop Spectrophotometer at 259 nm. Then yielded 2-5A was aliquoted and stored at −80°C.
Polysome profiling via sucrose gradient sedimentation
XRN1 KO A549 cells were grown to ∼70% confluency in a T75 flask (∼8 × 10⁶ cells) and were transfected with 5 µM 2-5A or transfection reagent only (control) for 4.5 h with Lipofectamine 3000 as outlined in the manufacturer's protocol. After 4.5 h of incubation at 37°C, cells were treated with media containing 50 µg/mL of cycloheximide for 10 min at 37°C. Cells were then washed twice with ice-cold DPBS containing 50 µg/mL of cycloheximide before the addition of 600 µL of lysate buffer (20 mM Tris [pH 8.0], 140 mM KCl, 5 mM MgCl2, 0.5 mM DTT, 0.03% Nonidet P-40, 100 µg/mL cycloheximide, 300 U/mL SUPERase-In, and EDTA-free protease inhibitor cocktail tablet [Roche]). Cells were scraped from the bottom of the plates and were transferred to a microcentrifuge tube. Then cells were passed through a G-26 needle 10 times and incubated on ice for 10 min. Lysates were cleared by centrifugation at 4°C, 8000g for 10 min, and the supernatants were transferred to a new tube. Samples were flash frozen in liquid nitrogen and stored at −80°C until the day of sucrose gradient centrifugation. The 10%–50% sucrose gradients were made fresh before the gradient ultracentrifugation. For this, 60% sucrose was prepared and filtered through a 0.22 µm filter. Then 10% and 50% sucrose gradient solutions were prepared by diluting with molecular grade water from this 60% sucrose and 10× gradient solution (200 mM Tris [pH 8.0], 1.5 m KCl, 50 mM MgCl2, and 5 mM DTT, to be diluted to 1×). To make the sucrose gradients, polypropylene centrifuge tubes (Beckman Coulter 331372, 14 × 89 mm) were first filled with 6 mL of 10% sucrose gradient buffer, and ∼6 mL of 50% sucrose gradient solution was underlaid using a cannula attached to a syringe. Gradients were made using a tilted tube rotation method (Biocomp) with a standard program for 10%–50% gradients (1 min 48 sec, 81.5°, 17 rpm). The top 1 mL of the gradients was discarded, and cell lysates were carefully loaded dropwise onto the top. Then gradients loaded with samples were centrifuged in a swinging rotor (SW41Ti, Beckman Coulter) at 40,000 rpm for 2 h at 4°C. Then the gradients were fractionated using a Brandel Density Gradient Fractionation System, while the RNA content was monitored at 254 nm and digitally recorded with a DataQ Instruments DI-155. Fractions were stored at −80°C or used immediately for RNA precipitation.
RNase digestion and sucrose gradient
WT A549 cells were grown to ∼70%–80% confluency in a T75 flask (∼8 × 10⁶ cells) and were transfected with 5 µM 2-5A or transfection reagent only (control) for 4.5 h with Lipofectamine 3000 as outlined in the manufacturer's protocol or treated with 1 mg/mL anisomycin diluted in 10 mL of media (Sigma-Aldrich A9789). This concentration of anisomycin is known to induce strong disome formation and thus acts as a positive control in our experiments. After 4.5 h (2-5A treatment) or 15 min (anisomycin treatment) of incubation at 37°C, cells were washed with 10 mL room temperature DPBS twice and then lysed in 600 µL lysis buffer (20 mM Tris-HCl, pH = 8.0, 150 mM NaCl, 15 mM MgCl2, 1% Triton-X, 1 mM DTT, 1× phosphatase inhibitor cocktail [Cell Signaling], and 1× EDTA-free protease inhibitor cocktail [Roche]) while scraped off from the bottom of the plate. Lysates were incubated for 10 min on ice and then homogenized by pushing it through a G-26 needle before proceeding with centrifugation (8000g, 10 min at 4°C). Total RNA was quantified by Quant-iT RiboGreen Kit (Invitrogen R11490) using a Mini-Fluorimeter (Turner Biosystems TBS-380). Lysates containing 20–100 µg of RNA were diluted to 800 µL with lysis buffer, and 2.66 µL of 0.5 µg/µL RNase A (Thermo Fisher Scientific EN05310) was added. RNase A digestion was carried out for 15 min at 25°C, while shaking the tubes at 700 rpm. Lysates then were loaded onto 10%–35% sucrose gradients, prepared similarly to above (see polysome profiling), except that the final concentration of the gradient buffer contained 20 mM Tris-HCl, pH = 8.0, 150 mM NaCl, and 5 mM MgCl2. Ultracentrifugation and fractionation steps were carried out similarly to the procedure described for polysome profiling.
Nanopore sequencing
Sample and RNA library preparation
WT and XRN1 KO A549 cells were grown to ∼70% confluency in a T75 flask (∼8 × 10⁶) and were transfected with 5 µM 2-5A for 4.5 h with Lipofectamine 3000 (Invitrogen) as outlined in the manufacturer's protocol. We used Lipofectamine treated cells as controls (no 2-5A) in these experiments. Cells were collected by centrifugation and total RNA was extracted with QIAGEN RNeasy kit. For each sample RNase L activation was monitored by rRNA cleavage assays (above). Total RNA for samples from polysome profiling experiments (Fig. 2) was precipitated from appropriate fractions as obtained above (see “Polysome profiling via sucrose gradient sedimentation” section above). To each polysome profiling fraction (∼500 µL), we added 2 volumes of ethanol (1 mL), 40 µL of 1 M sodium acetate (pH = 5.5), and 1 µL of GlycoBlue (Invitrogen AM9516) and precipitated RNA at −20°C overnight. The next day the precipitated RNA was collected by centrifugation at 4°C, 20,000g for 30–60 min until a pellet was visible at the bottom or the side of the tube. Then the pellet was washed with 70% ethanol, dried for ∼10 min and resuspended in 10–15 µL of water. Total RNA was quantified by Quant-IT RiboGreen kit (Invitrogen R11490) using a mini-fluorimeter (Turner Biosystems TBS-380). Enrichment for polyadenylated mRNA fragments was carried out by Invitrogen Dynabeads mRNA Purification Kit (61006). Then, poly(A) enriched (150–300 ng) or total RNA (0.5–1 µg) was used for creating libraries for direct RNA nanopore sequencing. Library preparation was carried out with Nanopore direct RNA sequencing kit (SQKRNA004) according to the manufacturer's protocol, including the reverse transcription step to facilitate RNA sequencing. We used 0.1–0.5 µL of control mRNA (labeled “RNA CS” in the kit) to ensure proper library preparation and to monitor potential problems during sequencing. Sequencing was performed on MinION flow cells (FLO-MIN004RA) using a GridION sequencer. FASTQ files containing the long-read sequences were generated by MinKNOW 6.2.14 software using default settings (min quality score = 9) for direct RNA sequencing.
Data processing and analysis
FASTQ files were aligned to the human transcriptome (RefSeq Select + MANE, ncbiRefSeqSelect, as downloaded from UCSC on 14 April 2020) or the human genome (hg38, UCSC, only for Supplemental Fig. S1B) by minimap2. Duplicate entries (using SeqKit software rmdup function) were removed prior to alignment. For transcriptome and genome alignment, we aligned the reads using a preset designed for long reads (-ax map-ont) without secondary alignments (‐‐secondary = no). Data in Supplemental Figure S1B visualized using IGV (Thorvaldsdottir et al. 2013).
For monitoring normalized length distribution of human transcriptome mapped reads and to extract nucleotide sequences for motif analysis, we used custom Python scripts (see Guydoshlab GitHub page, nanopore_motif_length function). To generate the WebLogo and dinucleotide motif distribution plots, we used a length range of 50 bases and 10 kb and required the read to be <1/3 of the total annotated length mapping at the 3′ end. Nanopore length density plots (Figs. 1, 2; Supplemental Figs. S1, S2) were generated with the geom_density function and plotted by ggplot2 in R and R Studio (version 2024.12.1). To visualize nucleotide enrichment near the end of 5′ ends of 3′ fragments, we used WebLogo 3.7.12. Distributions of nucleotide motifs were plotted with Prism 10.2.2. Differences between length distributions in ±2-5A treated cells were assessed using Whitney–Mann–Wilcoxon test. Assigned P-values were lower than 0.01 for all comparisons.
siRNA treatment of A549 cells
WT A549 cells were grown to ∼70%–80% confluency in a T75 flask (∼8 × 10⁶ cells) and transfected with PELO (IDT, hs.Ri.PELO.13.2) or control siRNA (IDT 51-01-14-03) using Lipofectamine 3000 transfection reagent according to the manufacturer's protocol. After 24 h, cells were trypsinized and plated to achieve ∼40% confluency. siRNA treated cells were incubated for another 24 h (total treatment is for 48 h) before transfection with 2-5A (5 µM) or transfection reagent only (Lipofectamine 3000, Invitrogen). Cells were then incubated for an additional 4.5 h before their lysis for ribosome profiling experiments. Decrease in PELO protein levels was confirmed by western blotting.
Ribosome profiling
Sample and cDNA library preparation
Ribosome profiling of “conventional” 25–34 nt footprints was carried out as previously reported (Karasik et al. 2021), except that rRNA depletion was carried out by siTOOLs riboPOOL rRNA Depletion Kit designed for human ribosome profiling (Fig. 3). For data in Figure 4, we selected a broader range of footprints (15–34 nt) during the size selection step using an additional 15 nt RNA marker (Guydosh et al. 2017). Additionally, we mixed 18 and 30 nt “spike-in” RNAs (three different sequences each) with ribosome protected footprints during the size selection step to control for length biases during sequencing (Arpat et al. 2020). During read processing (see below), deduplication was not performed on the spike-in sequences due to their high abundance. We noted that the bias ratios of 18-mer to 30-mer remained about the same between samples, and thus correcting for these ratios between experiments was not necessary. The spike-in sequences are listed in Supplemental Table S1. When we controlled for their abundance, the trends in the length distribution plots (Figs. 4C, 5D) remained. The ribosome profiling data were processed, and signatures of altORF translation were assessed as before (Karasik et al. 2021). Sequencing was performed on HiSeq3000, NovaSeq 6000, or X (single end 50) at the National Heart, Lung and Blood Institute (NHLBI) DNA Sequencing Core or National Institute of Diabetes, Digestive and Kidney Diseases (NIDDK) Genomics Core.
Analysis of footprints
For analysis of ribosome profiling data, we implemented a reduced-transcriptome alignment (bowtie1 with -y option) and Python analysis pipeline as described elsewhere (Guydosh 2021; Karasik et al. 2021). We used the RefSeq Select + MANE (ncbiRefSeqSelect), as downloaded from UCSC on 14 April 2020, for this alignment. We note that in the case of conventional 25–34 nt footprinting in Figure 3 and Supplemental Figure S3, we allowed two mismatches (-v 2 option in bowtie1). In data sets including short footprints (15–34 nt) (Figs. 4, 5; Supplemental Figs. S4, S5), we aligned the reads to the reduced transcriptome (as noted above) but also with removal of duplicate entries using SeqKit software rmdup function without allowing any mismatches to reduce noise from cases where reads could map to multiple sites (-v 0 option in bowtie1). As an additional measure to eliminate noise in data sets including short reads (15–34 nt), prior to alignment, removal of a single 5′ base was performed on all reads to eliminate any incorporated untemplated base during the reverse transcription step by using cutadapt2. Doing this eliminates the possibility that a read is rejected due to a mismatch from a 5′ untemplated base. Despite loss of this base, read sizes are still plotted according to their length before trimming (Figs. 4, 5; Supplemental Figs. S4, S5).
We used our previously established custom code (Guydosh 2021; Karasik et al. 2024) to count reads and create plots of average footprint levels (Figs. 3⇑–5; Supplemental Figs. S3–S5). We calculated rpm values for 5′ UTR, CDS, and 3′UTR for each annotated reference sequence transcript. These values were then used to calculate 3′UTR:CDS and 5′UTR:CDS values (minimum raw reads >5, genelist function). Boxplots were created in R Studio. We also used these tools to create metagene average plots (Figs. 3⇑–5) using the metagene and posavg functions. In general, we assume a shift of 12 nt between the 5′ end of a read and the P site of the ribosome, allowing us to plot approximate P sites in Figure 3 and Supplemental Figure S3. In contrast, Figures 4 and 5 and Supplemental Figures S4 and S5 show data that are plotted based on assignment to the very 3′ end of the read. Histograms of the bowtie-mapped footprint sizes were calculated by using custom Python code (see Guydoshlab GitHub page, countreadsizes function), and the plot and bar charts were created in Prism software (version 10.2.2). The 3′ dinucleotide distribution for 15–18 nt (16-mer) footprints (Fig. 4D; Supplemental Fig. S4B) was created by custom Python scripts (see Guydoshlab GitHub, endmotif_distribution function) and was plotted by Prism software. ANOVA (two-factor with replication) and Student's t-tests (one-tailed) were computed in Excel.
Analysis of poly(A) sequences in footprints
Ribosome profiling footprints generated by ribosomes that had partially moved into the poly(A) tail are not expected to align to the genome or transcriptome. To count these footprints, we used processed but not aligned reads to assess the number of ribosomes near the poly(A) tail on mRNAs (Fig. 3E; Supplemental Fig. S3E), similar to previous analysis (Guydosh and Green 2014). We counted the number of consecutive As (8–17 nt) at the 3′ end of the footprints using a grep command in Bash. Then, we calculated the percentages of these reads in the total unmapped reads and plotted those with Prism software (10.2.2).
Western blot analysis
To visualize differences in kinase phosphorylation levels and to monitor KD of PELO in A549 cells, 5–10 µL of ribosome profiling lysate (see preparation above) was mixed with equivalent amount of SDS sample buffer (Invitrogen) and then run on 4%–20% gradient Mini-PROTEAN Tris-HCl Gel (Bio-Rad). Proteins were transferred to a 0.2 µm PVDF membrane using the Trans-Blot Turbo System (Bio-Rad, Trans-Blot protocol and membrame blocking in EveryBlot blocking buffer (Bio-Rad) for 10 min at room temperature). This was followed by incubation with primary antibodies overnight in Tris-buffered saline plus 0.1% Tween (TBST) and 1% milk. The following antibodies were used: anti-p38 MAPK (Cell Signaling Technologies 9212, 1:2000 dilution), anti-P-p38 MAPK (Cell Signaling Technologies 9211, 1:2000 dilution), anti-P-JNK (Thr183/Tyr185) (Cell Signaling Technologies 4668, 1:1000), anti-JNK (Cell Signaling Technologies 9252, 1:1000), anti-H3 (Abcam 1791, 1:5000), and anti-PELO (Thermo Fisher PA5-31697, 1:1000). After washing three times for 5 min in TBST, secondary antibodies were incubated with the PVDF membrane for 1 h at room temperature (goat antirabbit antibody, Bio-Rad, 1:3000). Then, after additional washes (three times, 5 min each) in TBST, the PVDF membranes were incubated with Clarity Western ECL Substrate (Bio-Rad) for 5 min, and proteins were visualized by Amersham Imager 600. Experiments were performed at least three times using biological replicates, and original raw data will be available on Mendeley Data. A third replicate (Fig. 5B) using a different lysis procedure was also consistent. In this case, cells were lysed in 10 mM Tris-HCl, pH = 7.5, 150 mM NaCl, and 1% Triton-X on ice for 5 min and then centrifuged at 1500 rpm, for 4 min at 4°C. Then, the supernatant was mixed with equivalent amounts of SDS sample buffer before loading it onto the gels.
DATA DEPOSITION
All raw sequencing (FASTQ) files are available at NCBI SRA in record PRJNA1269731 (ribosome profiling and direct nanopore RNA-seq). Custom code used for ribosome profiling and Nanopore sequencing in this study is included as Supplemental information and available on GitHub: https://github.com/guydoshlab/ribofootPrinter. Commercial siRNA information is available under IDT part numbers: hs.Ri.PELO.13.2 and 51-01-14-03. Western blot replicates are available on Mendeley Data (10.17632/mhgk97f6yy.1).
SUPPLEMENTAL MATERIAL
Supplemental material is available for this article.
ACKNOWLEDGMENTS
We are thankful for the insightful discussions with Drs. Bret Hassel, Alan Hinnebusch, Jon Lorsch, and Tom Dever. We thank Dr. Bret Hassel and Dr. Emmanouil Maragkakis for feedback on the manuscript. We thank Dr. Sezen Meydan and Dr. Kyra Kerkhofs for helpful advice on short footprint ribosome profiling normalization and mapping. We thank Dr. Hernan Lorenzi for advice on statistical analysis. A549 cells were a kind gift from Dr. Bernie Moss. We are also thankful for assistance from the Genomics Core at the National Institute of Diabetes and Digestive and Kidney Diseases (NIDDK) and the DNA Sequencing Core at the National Heart, Lung, and Blood Institute (NHLBI) for providing sequencing services for ribosome profiling. Additionally, we are grateful to the NHLBI core for allowing access to a GridION nanopore sequencer. We thank Dr. John Hanover for the use of a FPLC. A.K. is grateful to have been chosen for a MOSAIC K99/R00 award (K99 GM143484) and for associated mentoring support from the American Society of Cell Biology partnership activities. This research was supported by the Intramural Research Program of the NIH, the National Institute of Diabetes and Digestive and Kidney Diseases (NIDDK) (DK075132 to N.R.G.). This research was supported by the Intramural Research Program of the National Institute of Diabetes and Digestive and Kidney Diseases (NIDDK) within the National Institutes of Health (NIH). The contributions of the NIH author(s) were made as part of their official duties as NIH federal employees, are in compliance with agency policy requirements, and are considered Works of the U.S. Government. However, the findings and conclusions presented in this paper are those of the author(s) and do not necessarily reflect the views of the NIH or the U.S. Department of Health and Human Services.
Author contributions: A.K. designed and performed experiments, developed software, analyzed the data, and wrote the paper. G.D.J. performed HAP1 ribosome experiments related to Figure 5F and purified protein. N.R.G. designed experiments, developed software, and wrote the paper.
Footnotes
-
Article is online at http://www.rnajournal.org/cgi/doi/10.1261/rna.080699.125.
-
Freely available online through the RNA Open Access option.
- Received July 30, 2025.
- Accepted February 17, 2026.
This article is a U.S. Government work and is in the public domain in the USA.
REFERENCES
MEET THE FIRST AUTHOR

Meet the First Author(s) is an editorial feature within RNA, in which the first author(s) of research-based papers in each issue have the opportunity to introduce themselves and their work to readers of RNA and the RNA research community. Agnes Karasik is the first author of this paper, “Stalled translation on transcripts cleaved by RNase L activates signaling important for innate immunity.” Dr. Karasik completed this work as a postdoctoral fellow in Dr. Nicholas Guydosh's laboratory at the National Institutes of Health. She is currently an assistant professor in the Chemistry and Biochemistry Department at The Ohio State University. Her laboratory is interested in molecular mechanisms of RNA cleavage in human cells.
What are the major results described in your paper, and how do they impact this branch of the field?
It has been a long-standing question in the RNase L field how this seemingly nonspecific ribonuclease induces physiological changes in the cell, such as the inflammatory response and cell death. We previously discovered that RNase L triggers the ribosome-stalling and collision sensor, ZAKα, leading to the activation of p38 and JNK pathways, and this ultimately results in cell death. These findings established the molecular link between RNase L's cleavage activity and the downstream cellular responses that follow its activation. However, the molecular details of how ribosome collisions arise during RNase L activation remained unclear. In the present manuscript, we sought to investigate this question. Using long-read nanopore sequencing, we showed that during RNase L activation, the mRNA fragments are not immediately decayed. Ribosome-bound RNA fractions are enriched in these RNA fragments, indicating that they remain translated. Importantly, some of these RNA fragments lack the stop codon, causing the ribosomes to stall at their 3′ end and activate ZAKα. To gain this mechanistic insight, we employed a modified ribosome profiling method to capture stalled ribosomes at RNase L cleavage sites. We also demonstrated that impairing ribosome rescue increases ribosome stalling at the 3′ end of the fragments leading to additional ZAKα activation providing further evidence in support of our model. This mechanism likely contributes to cellular responses in other physiological contexts where RNA fragmentation occurs and may therefore have broader biological significance.
What led you to study RNA or this aspect of RNA science?
I have always been fascinated by the fast pace of RNA biology and the development of RNA therapeutics. I was very excited to join Dr. Markos Koutmos’ lab as a graduate student and work on (at that time) a novel group of ribonucleases, Protein Only RNase Ps. I was surprised to learn how little was known about their mechanism and structure. Later on, as a postdoctoral fellow, I became interested in another endonuclease and a key enzyme in the innate immune response, RNase L. It was suspected that translation would play a role in RNase L–mediated immune response, but the details were unclear. I thought that it would be a challenging puzzle to solve!
During the course of these experiments, were there any surprising results or particular difficulties that altered your thinking and subsequent focus?
It has been particularly challenging to detect RNase L cleaved mRNA fragments. Next-generation-based sequencing requires the RNA sample to be further fragmented and thus making it difficult to predict which read came from a fragment and which one from a full-length mRNA. Long-read nanopore sequencing (especially with the new chemistry) opened an opportunity to detect these fragments in a high-throughput manner. While only the most 3′ fragments are detectable with the currently available protocols, I believe that more fragmentation products can be made visible by tweaking the method in the future.
What are some of the landmark moments that provoked your interest in science or your development as a scientist?
Even as a child, I was fascinated by the world surrounding us. When I first learned about biomolecules, I was so captivated that I immediately decided to be a molecular biologist at the age of 14. However, my path was not an easy track to science. I am the first and the only one to date to go to college from my extended family. My passion for biochemistry and resilience was crucial to overcome the challenges I faced and had a major impact on how I see the scientific process today.
If you were able to give one piece of advice to your younger self, what would that be?
When I was a budding scientist, I was extremely shy, and I didn't yet understand how important it is to ask questions and connect with other scientists. I would advise my younger self (and other young scientists) not to be afraid of being active and speaking up at lab meetings, seminars, and conferences—even when it means stepping outside of your comfort zone.
Are there specific individuals or groups who have influenced your philosophy or approach to science?
I loved to read biographies and other books about famous researchers as a teenager. While I was interested in achievements and lives of scientists from many different backgrounds and principles, reading about outstanding women scientists—such as Marie Curie, Jane Goodall, and Rosalind Franklin—influenced my philosophy and the way I relate to science the most. I was amazed by their resilience to establish themselves as a leading scientist in their field despite the numerous challenges they faced.
What are your subsequent near- or long-term career plans?
I recently started my own laboratory at The Ohio State University, and I am building a team to study normal and disease-related RNase activity in human cells and other aspects of RNA Biology.




