


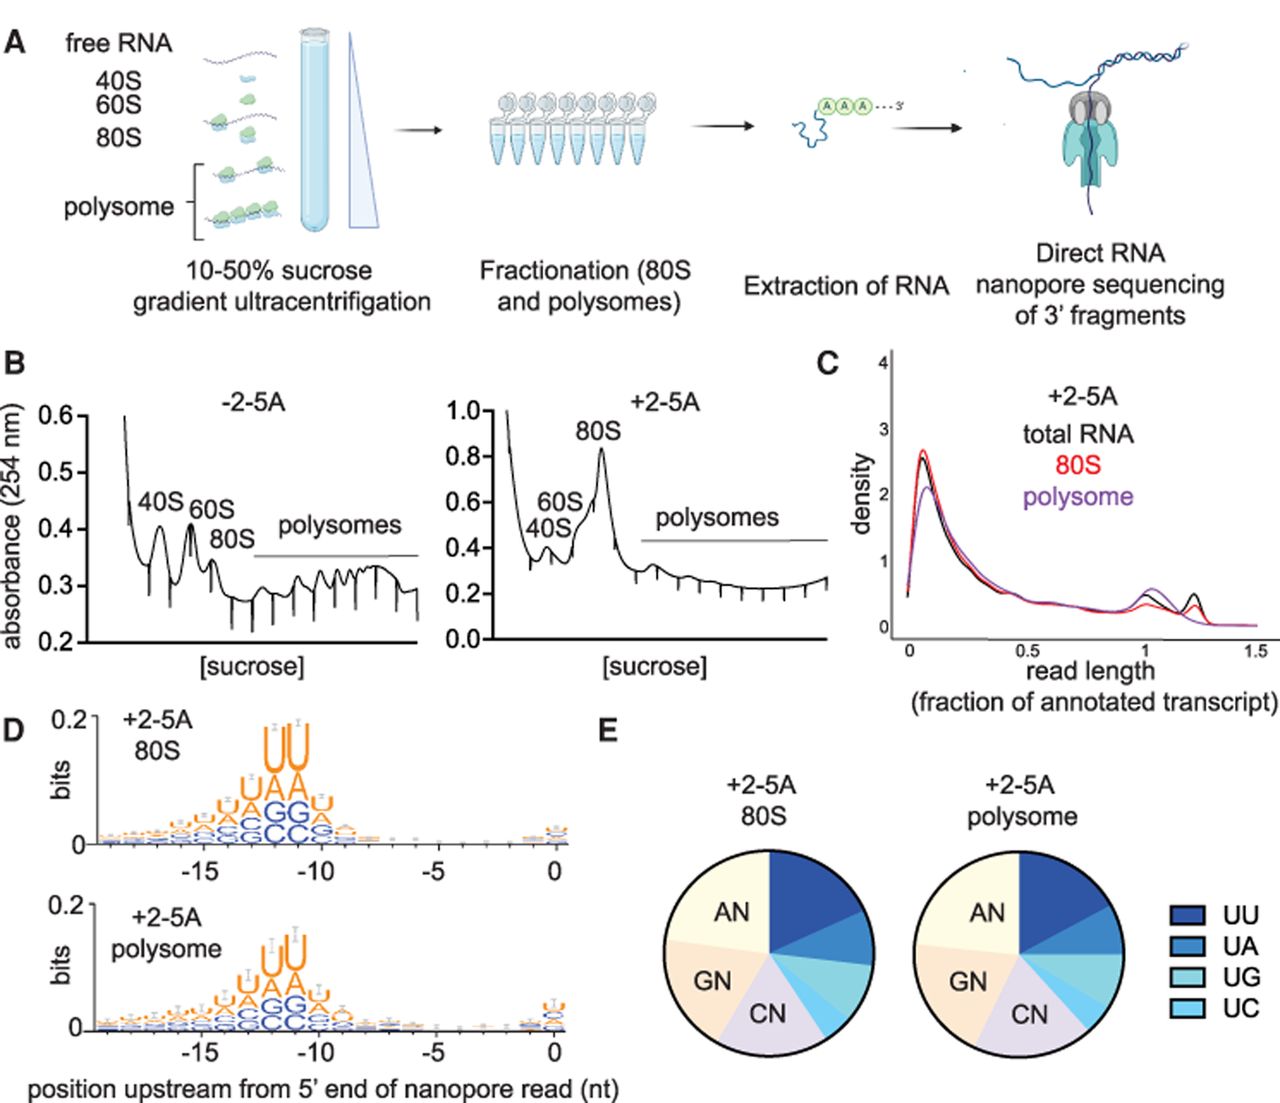
3′ Fragments generated by RNase L are translated. (A) Schematic representation of polysome profiling experiments coupled with direct RNA nanopore sequencing. XRN1 KO A549 cells are transfected with 5 µM of 2-5A for 4.5 h. Then, lysates were subjected to sucrose gradient centrifugation. 80S and polysome fractions were collected, and RNA was extracted. Then, RNase L 3′ cleavage products and uncleaved mRNA that contained poly(A) were sequenced with direct RNA nanopore sequencing. (B) Polysome profiles of 2-5A treated (+2-5A, right panel) and untreated (−2-5A, left panel) cell lysates. RNA content was monitored by absorbance at 254 nm. Note that the underlined area shows fractions retained for polysome analysis. (C) Normalized length distribution of nanopore direct sequencing reads to their respective annotated reference transcript in total RNA as compared to monosomes and polysomes in 2-5A treated XRN1 KO cells shows fragmentation in all cases. (D) WebLogo analysis shows enrichment of U bases in transcriptome positions just upstream of where nanopore sequencing stopped in the 80S and polysome fractions of sucrose gradient sedimentation experiments in 2-5A treated XRN1 KO cells. (E) Proportion of each dinucleotide motifs near the 5′ end of 3′ fragments in 80S and polysome fractions of 2-5A treated XRN1 KO cells. The number of total fragments were 181,347 (80S) and 27,648 (polysome). In both D and E, 3′ fragments were defined as reads that were shorter than a third of their respective annotated transcript that mapped to the 3′ end.




