


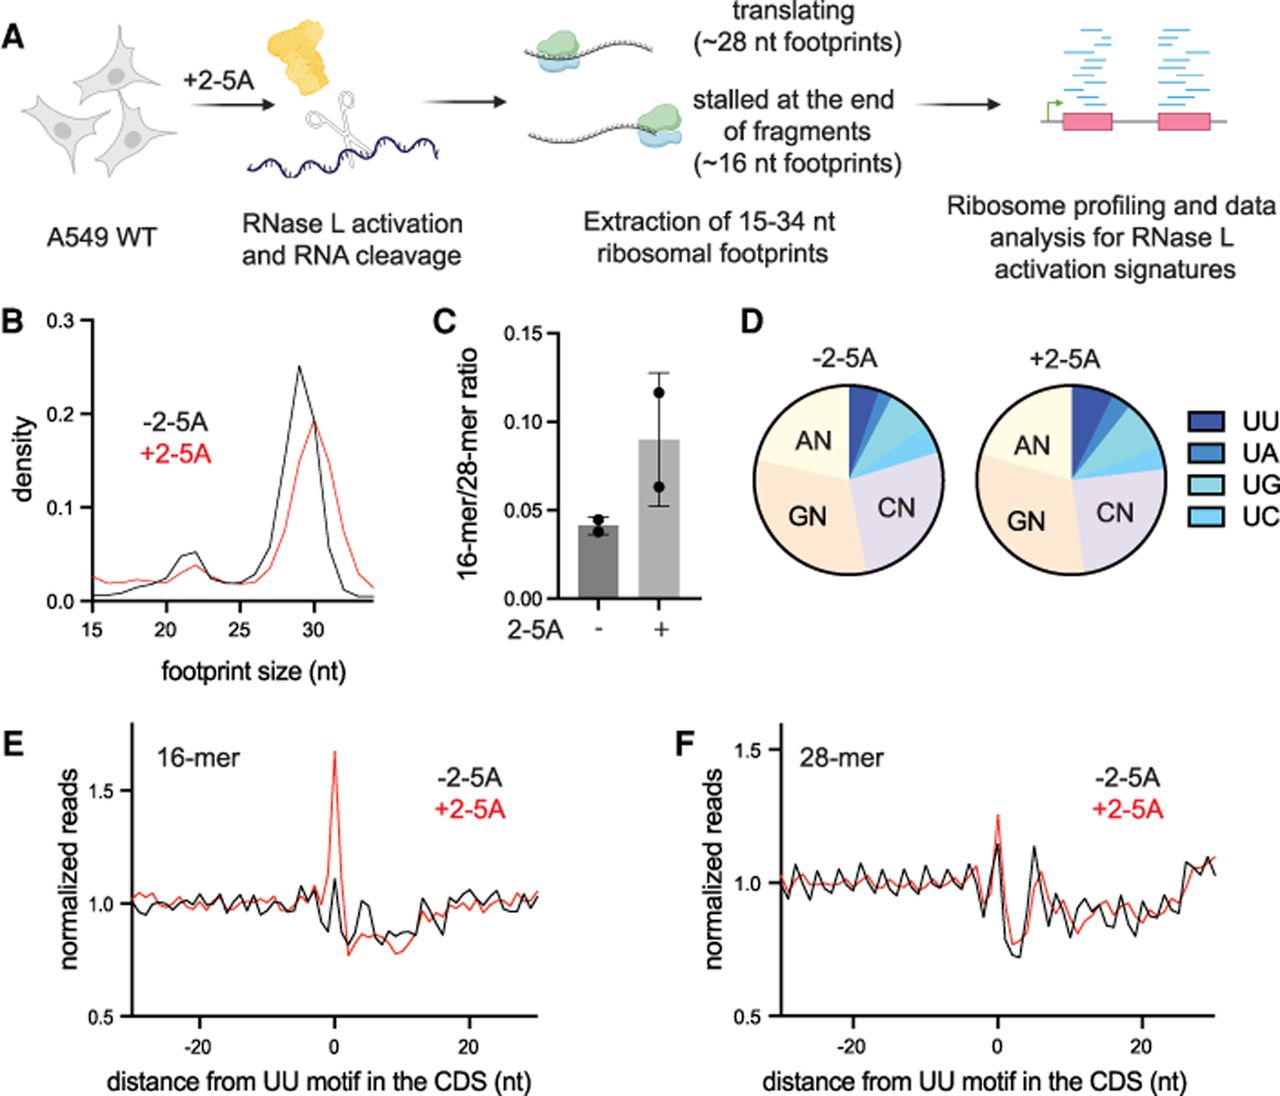
Short profiling footprints are increased at RNase L cleavage sites. (A) Schematic representation of ribosome profiling experiments. RNase L was activated by transfection of 2-5A for 4.5 h, and then cell lysates were subjected to ribosome profiling. We then performed size selection of 15–34 nt ribosome protected footprints to concurrently capture stalled ribosomes at the 3′ end of mRNA fragments (∼15–18 nt) and translating ribosomes (25–34 nt). Data were then analyzed to capture changes in length distribution of footprints and for RNase L signatures. Cells were treated with control siRNA to facilitate comparison with data in Figure 5. (B) Normalized length distribution of transcriptome-mapped ribosome profiling reads (15–34 nt): 3,135,785 reads for −2-5A and 3,790,034 reads for +2-5A. (C) Ratio of 16-mers (15–18 nt) to 28-mers (25–34 nt) in RNase L activated cells. Whiskers represent standard deviation between replicates; further analysis in Figure 5D. (D) The 3′ end dinucleotide motif distribution in 16-mer reads. Proportion of short footprints (15–18 nt) containing UN motif at their 3′ end is modestly increased in 2-5A treated cells. Number of 16-mer reads was 109,319 (−2-5A) and 333,784 (+2-5A). With replicate in Supplemental Figure S4B, P = 0.027 by t-test. (E,F) Position average plot of 3′ ends of 16-mers (E) and 28-mers (F) at RNase L cleavage sites (UU). 16-mers exhibit a peak at UU motifs when RNase L is active, consistent with ribosomes stalled on 3′ mRNA fragments. Ribosome footprints are plotted by 3′ assignment (no shift).




