


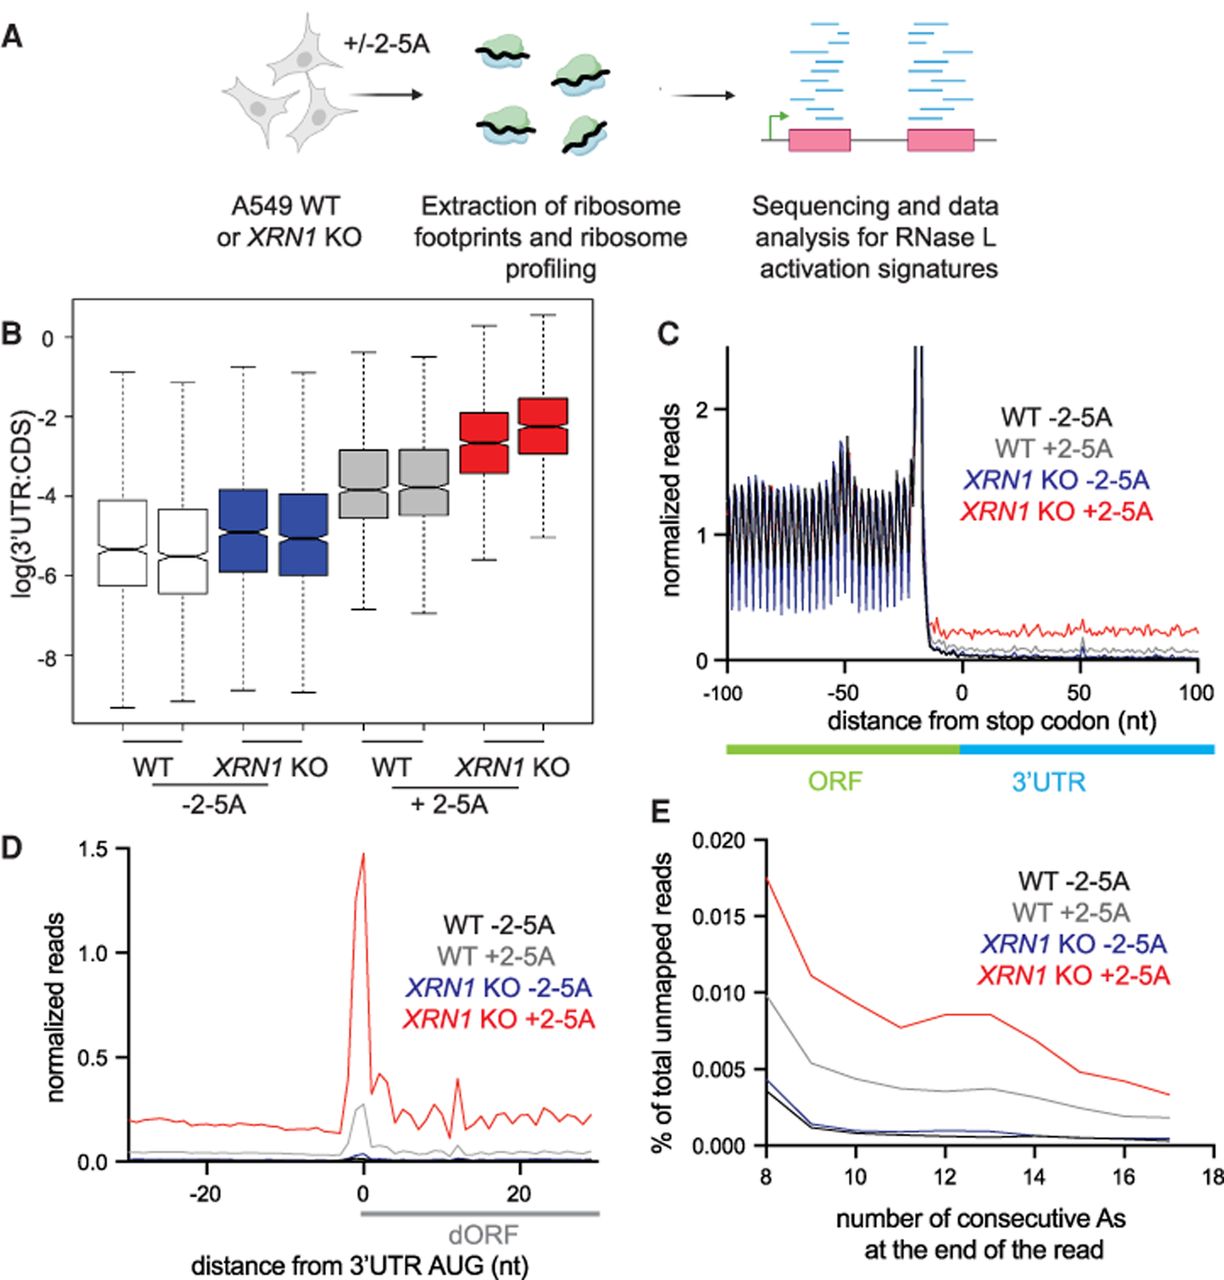
XRN1 KO cells exhibit stronger signatures of altORF translation compared to WT due to RNase L activation. (A) Schematic representation of ribosome profiling experiments. WT and XRN1 KO A549 cells were treated with 5 µM 2-5A for 4.5 h. Then, lysates were used for ribosome profiling of 25–34 nt footprints. Data were analyzed for altORF translation signatures. (B) 3′UTR:CDS ratios increase due to 2-5A treatment and are further elevated in XRN1 KO cells. The effects on the mean ratios are significant due to 2-5A (ANOVA P < 0.001), KO of XRN1 (ANOVA P = 0.002), and the combined interaction of both effects (ANOVA P = 0.020). Boxes represent the interquartile range (IQR), and the horizontal line is the median. Whiskers show the most extreme data point no more than 1.5 × IQR, and notches are 1.58 × IQR∕√N. Nine hundred forty-eight genes included. (C) Normalized average ribosome footprint occupancy (metagene plot) around the stop codon of main ORFs (CDSs) reveals increased relative ribosome footprint levels in the 3′ UTRs when RNase L is activated versus the respective control. XRN1 KO cells further exhibit increase in 3′UTR footprints as compared to WT. Ribosome footprints are plotted by 5′ assignment without any shift. (D) Normalized average ribosome footprint occupancy around the start codon of downstream ORFs in the 3′UTR reveal 3 nt periodicity and increased translation during RNase L activation in XRN1 KO cells as compared to WT cells. Ribosome footprints are plotted by 5′ assignment shifted by 12 nt (∼P site). (E) Percentage of ribosome profiling footprints in samples prior to mapping that contained a given length of consecutive poly(A) sequences (8–17 nt) at their 3′ end in WT and XRN1 KO cells. Total read counts >1000 for all samples. These represent ribosomes that run into the poly(A) tail.




