


Structure-informed mutagenesis identifies combinatorial contributions to mouse insulin receptor IRES function
- 1Department of Biology and Rosenstiel Basic Medical Sciences Research Center, Brandeis University, Waltham, Massachusetts 02453, USA
- 2Department of Molecular and Cell Biology, Harvard University, Cambridge, Massachusetts 02138, USA
- 3Department of Microbiology, Harvard Medical School, Boston, Massachusetts 02115, USA
- Corresponding author: mmarr{at}brandeis.edu
-
Handling editor: Eric Westhof
Abstract
Cells under stress shift their proteome by repressing cap-dependent translation initiation. RNA elements called internal ribosome entry sites (IRES) can allow key cellular transcripts to remain efficiently translated to support an effective stress response. We previously determined that the 5′ untranslated region (5′UTR) of the insulin receptor mRNA possesses a capacity for IRES activity that is conserved from insects to mammals. Well-characterized IRESs depend on RNA structures that reduce the protein requirements for translation initiation, thus circumventing translation inhibition. While there are several examples of viral IRES structures solved in vitro, the RNA secondary structures of cellular IRESs remain elusive, and little information exists about the secondary structures of these RNAs in vivo. Here we probe the secondary structure of the Insr 5′UTR IRES along with two well-studied viral IRESs from hepatitis C virus and encephalomyocarditis virus using dimethyl sulfate mutational profiling by sequencing (DMS-MaPseq) in vitro and in cells. We find that the structures of viral IRESs in a cellular environment are largely consistent with their known in vitro structures. Using DMS-MaPseq probing as a constraint, we generated a model of the RNA secondary structure of the mouse insulin receptor 5′UTR. With this model as a guide, we employed a mutation strategy which allowed us to identify a conserved segment of RNA, distal from the translation start codon, that is critical for Insr IRES function. This knowledge informed the design of a minimal IRES element with equivalent activity to the full-length Insr 5′UTR across translation contexts.
Keywords
- RNA structure
- 5′ untranslated region
- internal ribosome entry sites
- noncanonical translation initiation
- insulin receptor
INTRODUCTION
Under stress, cells suppress global protein synthesis to conserve energy for stress response pathways. One major mechanism is hypophosphorylation of eukaryotic translation initiation factor 4E binding protein (4E-BP), which binds the cap-binding protein eIF4E and prevents formation of the eIF4F translation initiation complex, thereby inhibiting cap-dependent translation initiation (Merrick 2015). Under these conditions, an estimated 3%–10% of specific cellular transcripts remain efficiently translated (Weingarten-Gabbay et al. 2016; for review, see Kwan and Thompson 2019). Alternative pathways of translation initiation, including cap-independent mechanisms, sustain selective protein synthesis during stress.
Many transcripts capable of cap-independent translation initiation contain internal ribosome entry sites (IRESs) within their 5′ untranslated regions (5′UTRs) (Holcik and Sonenberg 2005). These elements typically recruit ribosomes through RNA secondary structure. Viral IRESs can be classified by their reduced initiation factor requirements (for review, see Lozano and Martínez-Salas 2015). Their structural conservation likely reflects strong selective pressure for synthesis of viral proteins within stressed infected cells (Mailliot and Martin 2018). In contrast, cellular IRESs are exposed to both stressed and healthy translation environments and likely face weaker evolutionary constraints.
Cellular IRESs likely accommodate both cap-dependent and cap-independent initiation mechanisms. However, endogenous mRNAs are all 5′ capped, and structured 5′UTRs can inhibit cap-dependent translation initiation (Kozak 1988; Sagliocco et al. 1993) constraining cellular IRES mechanisms. Previous work suggests that cellular IRESs exhibit limited primary sequence conservation with weaker structural signatures (Xia and Holcik 2009; Gilbert 2010). This presents the cell with an opportunity for context-dependent translation control, enabling selective protein synthesis during stress.
We previously showed that the 5′UTR of insulin-like receptor (Insr) mRNAs supports cap-independent translation, and this property is conserved from flies to mammals (Marr et al. 2007; Olson et al. 2013). Insulin receptor transcripts are upregulated by fasting in multiple organisms (Bisbis et al. 1994; Ziegler et al. 1995; Dupont et al. 1998), and Insr transcript expression directly parallels its protein expression in insects and mammals (Puig and Tjian 2005) despite the general repression of cap-dependent translation in fasting cells (Tettweiler et al. 2005). The IRES activity of the Insr 5′UTR ensures that cells can rapidly respond to renewed insulin signaling.
We therefore sought to determine how IRES activity is encoded within the mouse Insr 5′UTR. We used dimethyl sulfate mutational profiling with sequencing (DMS-MaPseq), which identifies base-paired versus unpaired adenines and cytosines by detecting DMS-induced mutations during reverse transcription (Zubradt et al. 2017). We probed the well-characterized IRES elements of encephalomyocarditis virus (EMCV) and hepatitis C virus (HCV) as structural benchmarks, enabling reliable modeling of the RNA structures of the Insr IRES in vitro and in a cellular context.
Using our DMS-constrained model of the Insr 5′UTR IRES, we engineered targeted mutations to identify important structural domains. By combining cap-independent translation assays and structural probing of mutagenized RNAs in vitro and in cells, we found a distal conserved region that is necessary and sufficient for IRES activity, while the remaining UTR contributes to the level of activity through generic structural features. Considered together, this comprehensive mutational and structural analysis characterizes the Insr IRES's RNA dependencies, a key step to understanding the nature of cellular IRESs.
RESULTS
HCV and EMCV IRESs probed in cells agree with their in vitro structures
To benchmark DMS-MaPseq for IRES secondary structure prediction, we probed two viral IRESs of known in vitro structure from hepatitis C virus (HCV) and encephalomyocarditis virus (EMCV). We also probed a cellular IRES of unknown structure (Insr) in tandem (Fig. 1A). HEK293T cells were cotransfected with reporters containing these sequences in the 5′UTRs of a monocistronic Gaussia luciferase reporter driven by the cytomegalovirus (CMV) immediate early promoter (Fig. 1B). The HCV, EMCV, and Insr IRESs were also in vitro transcribed and pooled, allowing for consistent treatment conditions and prediction parameters between HCV, EMCV, and the mouse Insr 5′UTR.
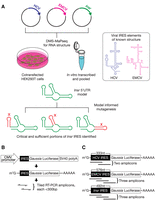
Structure-informed mutagenesis of the Insr 5′UTR IRES. (A) Strategic overview of concurrent probing of three IRES elements in HEK293T cells. Two viral IRESs from hepatitis C virus (HCV) and encephalomyocarditis virus (EMCV) 5′UTRs were probed with dimethyl sulfate (DMS) alongside the mouse insulin receptor (Insr) 5′UTR from cotransfected plasmids. These RNA structures were also pooled and probed in vitro. Prediction of the Insr 5′UTR RNA secondary structure informed a mutation strategy aimed at identifying functional components. (B) Diagram of plasmid expression cassette for this strategy. (C) Diagram of transcripts probed, with number of tiled RT-PCR amplicons annotated for each 5′UTR.
We probed the RNAs in vitro and in living cells with dimethyl sulfate (DMS) and employed the established gene-specific DMS-MaPseq strategy (Zubradt et al. 2017) to model RNA secondary structure. Libraries were prepared from RT-PCR fragments tiled across each 5′UTR (Fig. 1C; primers used are found in Supplemental Table S1). The data were analyzed using an established pipeline (Tomezsko et al. 2020) with an additional barcode splitting step to support sequencing many samples of similar sequence at once (Supplemental Fig. S1A). Each probing experiment was conducted three times unless otherwise specified. For quality control, replicability was assessed by coefficient of determination (R2) considering As and Cs only, and the distributions of mutations per sequencing read were observed to ensure a similar frequency of probing events to previous studies both in living cells and in vitro (Supplemental Fig. S1B–M). Informed structure prediction was conducted in RNAstructure (see Materials and Methods; Reuter and Mathews 2010). To gauge the efficacy of our secondary structure modeling, we first compared these data to the well-characterized in vitro models of the viral IRESs.
Folding of the HCV IRES generally agreed with its known secondary structure (Kieft et al. 1999) when constrained by in vitro and cellular DMS probing (Fig. 2A,B, respectively). The established structure used for quantitative comparison from Kieft et al. (1999) differs at 4 nt from the probed structure (reconstructed in Supplemental Fig. S2A with sequence differences noted). The probed variant matches hepatitis C virus subtype 1b genomic RNA from strain NC1 (Heuss et al. 2022) and is fully functional in both bicistronic and monocistronic luciferase reporters (Olson et al. 2013; Clark et al. 2023; Harris and Marr 2023). Correspondence of DMS-MaPseq constraint data to the predicted structures was assessed by observing the area under the receiver operating characteristic curve (AUROC, see Materials and Methods). Reliable models typically have AUROC >0.80, indicating high agreement between signal and structure (Lan et al. 2022). The HCV IRES cellular model was reproducible with high signal-structure agreement (R2 = 0.99, AUROC = 0.90, Fig. 2B; Supplemental Fig. S1B). The in vitro data on HCV (n = 2) were similarly reproducible with R2 = 0.96 (Supplemental Fig. S1C). We also compared these DMS-MaPseq data to the known structure. With cellular DMS probing, AUROC = 0.76, indicating some disagreement, likely stemming from domain IV. In vitro DMS-MaPseq data agreed better with the known HCV structure with AUROC = 0.80 (Supplemental Fig. S2A). Structural similarity was assessed by modified Fowlkes–Mallows Index which reflects similarity on both paired and unpaired bases (mFMI, see Materials and Methods; Fowlkes and Mallows 1983; Lan et al. 2022). In vitro constrained folding of HCV predicted its critical pseudoknot (Berry et al. 2010), with the lowest mFMI values in domain II (Fig. 2A,C); domain II harbors three of the four nucleotides that differ from the originally probed structure (labeled in Supplemental Fig. S2A). mFMI on the cellular structure indicates high agreement with the known structure of the HCV IRES except for domain IIId and domain IV. The alternative prediction of HCV domain IIId in Figure 2B (inset) improves its agreement with the known structure, with this mFMI shown in red (Fig. 2D). While this alternative more accurately captured domain IIId, it less accurately modeled the four-way IIIef junction (not shown). Domain IV appears linear in our cellular model. Our in vitro model of domain IV contains three fewer base pairs than Kieft et al. (1999): G331-C354, A332-U353, and C334-G350. In our probed sequence, G350 is changed to A350 (see Supplemental Fig. S2A). Consistent with the 3 nt differing between Kieft et al. (1999) and domain II of the probed isolate, mFMI comparing the cellular and in vitro structures showed higher agreement in this region than the comparisons to the known structure (Fig. 2E).
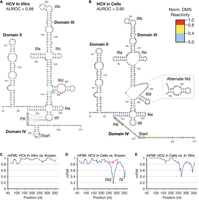
Hepatitis C virus (HCV) IRES RNA secondary structure. (A) The HCV IRES modeled from in vitro probing (AUROC = 0.88, see Materials and Methods). Normalized DMS reactivities calculated as described in Materials and Methods, and legend applies to all figures. White: no data (Gs and Us). Blue: shielded bases, 0.0–0.4. Yellow: bases of intermediate reactivity, 0.4–0.8. Red: highly reactive bases, 0.8–1.0. Domains of HCV are labeled consistently with previous reports. (B) The HCV 5′UTR IRES secondary structure constrained by DMS-MaPseq probing in HEK293T cells (AUROC = 0.90). At right, an alternative prediction of domain IIId, which more closely matches its known structure, is inlaid. (C) Modified Fowlkes–Mallows Index (mFMI, see Materials and Methods) quantitative structure comparison between the in vitro model and the known structure reconstructed in Supplemental Figure S2A. (D) mFMI comparing the cellular model and the same known structure. Notable areas of disagreement in base-pairing are labeled for domain IIId and domain IV. The red line corresponds to the mFMI of the alternative prediction inlaid at right of the structure. (E) mFMI between the cellular and in vitro models in A and B.
Previous studies using NMR or X-ray crystallography have resolved several other features, which are not captured by our models. Our model of domain II includes an additional bulge (C62-U64 and U103-U106, Fig. 2A,B) compared to NMR data, which identified interactions between C62-U64 and U103-G105, as well as G68 with A99 (Lukavsky et al. 2003). In our data, C62, A99, and C104 within these positions all appear shielded from DMS reactivity in vitro, though the noncanonical interactions were not predicted (Fig. 2A). Our models of domain IIId do not capture the four consecutive noncanonical interactions visible in nuclear magnetic resonance (NMR) imaging (G256-A276, A257-A275, U259-A274, A260-G273) (Lukavsky et al. 2000). The interactions involving A274-A276 do not shield N1A and are reactive to DMS (Fig. 2A,B), which is also visible by truncation-based DMS probing in Figure 1b in Lukavsky et al. (2000). The tertiary interaction between A288 and U297 (Easton et al. 2009) was not predicted, but A288 is shielded from DMS. The overall architecture of the HCV IRES was accurately captured, with differences consistent with known biological processes.
Identical folding parameters (see Materials and Methods) also captured known RNA secondary structures within the EMCV IRES, and the resulting model is largely consistent with previous reports based on in vitro probing (Pilipenko et al. 1989; Chamond et al. 2014). DMS-MaPseq on EMCV was highly reproducible, with R2 = 0.99 in live cells (n = 2) and R2 = 0.87 in vitro (n = 2) (Supplemental Fig. S1F,G). The EMCV predictions also exhibited strong agreement with the DMS probing data with AUROC = 0.88 in vitro and AUROC = 0.88 in live cells (Fig. 3A,B). Secondary structure modeling of the EMCV IRES in the cells most closely resembled an in vitro model from (Pilipenko et al. 1989), which is identified as the active IRES folding form by a recent functional study (Maloney and Joseph 2024). This structure from Pilipenko et al. (1989) spans from domain G to domain L, whereas the IRES probed in this report includes domains D–M. Comparing DMS signal-structure agreement on shared sequence with the known structure results in AUROC = 0.80 in live cells and AUROC = 0.81 in vitro (Supplemental Fig. S2B). The high similarity of the models to the predicted structures is reflected by mFMI, with values >0.8 across the UTR (Fig. 3C–E). Overall, these results indicate that DMS-MaPseq is effective and reproducible for modeling large RNA secondary structures in living cells and in vitro.
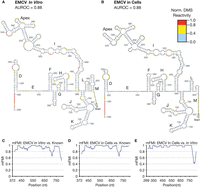
Encephalomyocarditis virus (EMCV) IRES RNA secondary structure. (A) Secondary structure constrained by in vitro probing of the EMCV IRES (AUROC = 0.88). (B) The EMCV IRES secondary structure constrained by DMS-MaPseq, probed in HEK293T cells (AUROC = 0.88). (C) mFMI comparing EMCV probed in vitro (A) with the known structure reconstructed in Supplemental Figure S2B across their shared sequence range. (D) mFMI comparing EMCV in live cells (B) to the known structure. (E) mFMI between the cellular and in vitro models of the EMCV IRES (A vs. B).
The secondary structure of the EMCV IRES is less well-characterized than that of the HCV IRES, and several regions remain unresolved by higher resolution experiments like NMR and X-ray crystallography. The proposed structure of domain I has several variants, with the most divergent (based on evolutionary conservation) depicting domain I decomposed into three smaller stems with the center containing the same apex (Palmenberg and Sgro 1997). Domain G, which in our model is two stem–loops (A372-C403), has also been proposed as a single larger stem–loop with a larger spacer to domain H (Chamond et al. 2014). Chamond et al. (2014) also proposed the small hairpin at G510-C517 present in our cellular structure (Fig. 3B) but not in our in vitro structure (Fig. 3A). Considered together, these data reveal the power and limitations of DMS-MaPseq: Although DMS reactivity is affected by a subset of non-Watson–Crick interactions, we currently lack the computational tools to parse these structures on the basis of DMS-MaPseq data alone. Nevertheless, DMS-MaPseq was capable of modeling the secondary structure of the HCV and EMCV viral IRESs accurately.
DMS-MaPseq reveals the RNA secondary structure of mouse insulin receptor (Insr) 5′UTR
We modeled the RNA secondary structure of the Insr 5′UTR in cells and in vitro using identical parameters to those used for the viral IRESs probed in tandem. DMS-MaPseq libraries were prepared from cultured cells and from in vitro reactions as described (Fig. 1A). Probing of Insr was highly replicable both in vitro (R2 = 0.98) and in cells (R2 = 0.98, Supplemental Fig. S1J,K). The resulting in vitro model exhibits high agreement with the probing data (AUROC in vitro = 0.81, Fig. 4A) and is more paired than the model derived from cellular probing data (AUROC of Insr in living cells = 0.87, Fig. 4B). A notable difference is a register shift with G226-C276 pairing with G283-C336 in vitro instead of G241-C281 pairing with G292-C336 by the cellular model. Assessed by mFMI, the differences in structure between the two models center on the register shift, with the rest of the structure maintaining mFMI >0.8 (Fig. 4C).
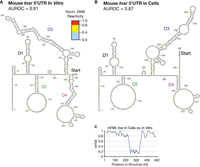
Modeling RNA secondary structure of the mouse Insr 5′UTR with DMS-MaPseq. (A) Model of the mouse Insr 5′UTR constrained by DMS-MaPseq in vitro (AUROC = 0.81), probed in tandem with the viral IRESs in Figures 2 and 3 and modeled using the same prediction parameters (see Materials and Methods). Exact domain divisions are depicted using this model in Supplemental Figure S3A. (B) Model constrained by DMS probing in live cells (AUROC = 0.87). (C) mFMI between the two predicted structures in A and B.
For ease of discussion, we assigned names: domain 1 (D1, nucleotides G1-U111), domain 2 (D2, G112-A207), domain 3 (D3, U225-C336), and domain 4 (D4, A382-U483). A diagram of these domains mapped to the in vitro model can be found in Supplemental Figure S3A. D1 is partially structured and is highly conserved. D2 is largely modeled as unpaired. D3 contains a stem–loop with bulges, which exhibits a register shift in vitro compared to the cellular model. D4 is most proximal to the AUG start codon with two predicted stem–loops in its apex. There is little evolutionary sequence conservation in the mouse Insr 5′UTR outside of D1 (Supplemental Fig. S3B). Following the area of high conservation, which extends to C138, DMS-MaPseq reveals a large stretch of reactive and unpaired A and C nucleotides in cells (C140-C208 in Fig. 4B). We used these models to design a mutagenesis strategy aimed at identifying structural requirements for IRES activity within the Insr 5′UTR.
Specific domain deletions disrupt Insr IRES structure and function
To pinpoint the functionally relevant areas of the predicted structures for the Insr IRES, we began by introducing deletions informed by our model. An initial assessment of the effects of these deletions on Insr IRES function was conducted using bicistronic luciferase reporter plasmids transfected into HEK293T cells. We have previously used this reporter system to investigate the relationship between the Insr IRES and several eukaryotic translation initiation factors (Olson et al. 2013; Clark et al. 2023; Harris and Marr 2023). These bicistronic luciferase reporters have a cap-dependent Renilla luciferase open reading frame (ORF), which is followed by the IRES in an intercistronic UTR facilitating translation of the downstream firefly luciferase ORF. This first cistron ensures the firefly ORF reports on internal ribosome entry, and it offers a built-in control for differences in RNA abundance arising from transfection efficiency or RNA stability. Importantly, RT-qPCR experiments indicate that the levels of REN ORF and FF ORF are identical in these constructs, consistent with a single bicistronic RNA (see Materials and Methods; Supplemental Fig. S4).
We chose the bicistronic system as an initial screen for effects because it restricts the second reporter to cap-independent mechanisms in vivo; however, to ensure representative measurements of IRES-mediated translation, we revisit key mutants later in this report with monocistronic reporters assayed in vitro. In our construct, the bicistronic transcript is driven by the relatively weak Rous sarcoma virus long terminal repeat (RSV LTR) promoter to better represent the low abundance of mouse Insr mRNA. A strong synthetic polyadenylation signal positioned upstream of the LTR, as well as the RSV LTR natural polyadenylation signal, is included to limit transcripts originating elsewhere in the plasmid from extending into the bicistronic reporter.
In bicistronic reporters, the metric for IRES-mediated translation is firefly luciferase (FF) signal divided by Renilla luciferase (Ren) signal. The relative IRES capability of each mutant is expressed using their FF:Ren ratio as a percentage of that of full-length Insr UTR (IRES activity, see Materials and Methods). Mean IRES activity metrics across technical replicates from each experiment are plotted as data points in all charts. Each data point represents the value from a single biological replicate. Biological replicates were independently transfected on different days. Error bars are the standard deviation of the biological replicates, except for full-length, which is the standard deviation of technical replicates (see Materials and Methods). We utilized a non-IRES control containing beta-globin 5′UTR (BG), which has 3% or less IRES activity in this assay, as well as a positive control viral IRES (HCV), typically presenting at 40%–60% IRES activity (relative to Insr) in our bicistronic reporters (Fig. 5A). BG provides a cap-dependent negative control, while HCV serves as a strong IRES positive control. Plasmids generated for this study can be found in Supplemental Table S2, and unprocessed luciferase assay data can be found in Supplemental Table S3. We assessed the effect on the reporters using analysis of variance (ANOVA) and Tukey's HSD post hoc test (see Materials and Methods).
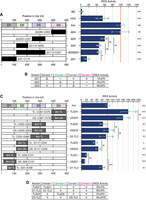
Identifying critical portions of the Insr 5′UTR. (A) Performance of bicistronic luciferase reporters deleting each indicated region. At left, black bars indicate deletions and white bars indicate that the sequence is retained. The plot of IRES activity at right is normalized as described in Materials and Methods. BG: beta-globin cap-dependent UTR serving as negative control. HCV: viral IRES serving as positive control. Points: mean for each biological replicate, with three technical replicates each. Error bars: standard deviation of these means. Asterisks indicate P-values by ANOVA followed by Tukey's HSD (see Materials and Methods): (*) P ≤ 0.05, (**) P ≤ 0.005, (***) P ≤ 0.0005. Asterisks at right are in comparison to full-length Insr UTR (denoted by the red line) with specific comparisons inlaid in the plot. Deleted sequence ranges are specified for each mutant. (B) A summary of the data depicted in A combined with structural perturbations observed with DMS-MaPseq in live cells (detailed in Supplemental Fig. S5). Δ: Deletion, +: intact structure, −: disrupted structure. (C) Bicistronic luciferase reporter performance of constructs with equivalent deletions to those in A, but with tetraloop hairpin (TL) or unstructured (US) replacements. Positions replaced by TLs and US elements are specified. Additional TL hairpin mutants’ performance and a diagram of these mutants relative to the predicted structure can be found in Supplemental Figure S6. (D) Summary of TL rescues of function depicted in C combined with structural rescues (detailed in Supplemental Fig. S7).
The deletions had varied effects on IRES activity. A full deletion of domain 4 (ΔD4), which is most proximal to the translation start codon, has no effect (99% ± 21%). Deletions of domain 3 (ΔD3, 60% ± 6%) and domain 2 (ΔD2, 45% ± 3%) reduced IRES activity and were insignificantly different from one another. Combining the deletions of D2 and D3 (ΔD2ΔD3, 44% ± 3%) did not diminish activity further. Surprisingly, removing the farthest domain from the translation start codon, ΔD1 (15% ± 6%), had the strongest effect observed among the large-scale deletions (Fig. 5A). However, bringing previously distal RNA sequences into proximity may affect RNA structure on either side of the deletion and indirectly affect IRES activity.
To assess whether the functional damage from deletions (ΔD3, ΔD2, and ΔD1) was a consequence of RNA secondary structure disruptions, we conducted DMS-MaPseq on these mutants in living cells, where a narrower range of structure is permitted (Rouskin et al. 2014). We expected that in-cell probing would reflect the active IRES structure. These experiments were conducted in the same context as previously described for HCV, EMCV, and full-length Insr. We first examined these data in a model-naïve manner by calculating the coefficient of determination (R2) in sliding windows comparing only the signal on As and Cs (see Materials and Methods). We then used the same parameters as all other structures to model the mutants’ secondary structures and compared these results to Insr with mFMI. Our suspicions were confirmed in probing ΔD1, ΔD2, and ΔD3 with DMS-MaPseq: We found structural disruptions in all three cases. Local discrepancies in DMS-MaPseq reactivity data in each of the deletion mutants did not always map to differences in predicted secondary structures. ΔD1 had perturbed reactivity in both D2 and D3, but only the pairing state of D2 was affected in structure modeling (Supplemental Fig. S5A). In ΔD2, the adjacent DMS signal was affected, and only D3 remained intact (Supplemental Fig. S5B). In ΔD3, only D4 exhibited different base-pairing (Supplemental Fig. S5C). These results are summarized in Figure 5B.
To decouple the functional effects of removing D1, D2, and D3 from this structural damage, we sought to preserve the structural influence of each predicted stem on the rest of the UTR. We replaced each domain with a generic structure by substituting a 2 bp stem topped with a tetraloop. Tetraloops are strong four-base loops that assist folding of critical structures and tertiary interactions in rRNA and other large functional RNAs (Woese et al. 1990). The chosen TL was 5′-CCGAAAGG-3′, a GNRA tetraloop used in other studies of RNA structure (Cate et al. 1996; Ferré-D'Amaré et al. 1998; Berry et al. 2010), with two CG base pairs as the stem. If the deletions functionally disrupt IRES activity by perturbing secondary structure, TLs could repair adjacent pairing and consequently rescue IRES activity. Each predicted stem was progressively replaced with TL hairpins. Diagrams of the positions of these TLs on both Insr 5′UTR models can be found in Supplemental Figure S6. The effects of these mutations were assayed by bicistronic luciferase reporters as previously described.
TL hairpins replacing D1 and D2 were as deleterious as the deletions of the domains themselves (TLΔD1, 20% ± 4% and TLΔD2, 53% ± 8%). However, the construct replacing D3 with a tetraloop (TLΔD3, 82% ± 12%) was statistically indistinguishable from the wild-type construct despite removing the same sequence range as ΔD3. Surprisingly, a complete TL hairpin replacement of domain 4 (TLΔD4, 180% ± 29%) significantly enhanced the activity of the UTR but was far more variable than any other mutant tested (Fig. 5C). Only TL hairpins that reached the base of the predicted stems exhibited the effects depicted in Figure 5C. TL hairpins replacing only part of D1 showed no statistically significant impairment of activity (D1-TL1, 66% ± 4%, D1-TL2, 81% ± 13%, and D1-TL3, 80% ± 9%). Similarly, the effect of TLΔD2 was not observed in partial replacements: Mimicking the predicted helix with a TL (G112-C118 pairing with G176-C182) had no significant effect (D2TL-3, 74% ± 9%), and shifted TL replacements that impact one half of this helix also had no effect (D2TL-1, 106% ± 22%, and D2TL-2, 74% ± 27%). In D3, TL hairpins rescued compared to ΔD3 regardless of their exact position (D3-TL1, 101% ± 14%, D3-TL2, 94% ± 25%, and D3-TL3, 91% ± 13%). Finally, incomplete replacement of D4 (D4-TL1, 102% ± 19%) had no effect (Supplemental Fig. S6A).
We created linear linker mutants to investigate whether the TL hairpins were directly contributing to the function of the Insr 5′UTR, replacing the TL hairpins with CAA repeats of equal length (8 nt, 5′–AACAACAA–3′). These linkers are reliably linear in RNA structures (Sobczak et al. 2010) and are denoted in this report by the “unstructured” prefix rather than TL (USΔD). If TL hairpins directly contribute to function, their unstructured counterparts will not rescue. Surprisingly, the US mutants showed an identical capacity for IRES activity as their TL hairpin equivalents, with USΔD4 (160% ± 23%) enhancing activity, USΔD3 (104% ± 18%) rescuing to be indistinguishable from full-length UTR, USΔD2 (64% ± 8%) offering no rescue, and USΔD1 (13% ± 2%) causing equivalent damage to TLΔD1 and ΔD1 (Fig. 5C). This confirmed that the effects observed in the tetraloop mutants do not depend on the tetraloops’ own structure but instead rely on added nucleotides in place of the predicted stems.
DMS-MaPseq confirmed that these tetraloop hairpins rescued structural disruptions with one important exception. In TLΔD1, D2 remained disrupted both in signal and in structural prediction (Supplemental Fig. S7A). Because D2's pairing state may contribute to the effect upon removing D1, we probed an additional mutant, D1-TL3 (80% ± 9%), which precisely replaces the large stem–loop at G50-C108. D1-TL3 did rescue the structure of D2, which may explain its functional improvement over TLΔD1 (Supplemental Fig. S7B). TL hairpins replacing D2 and D3 (TLΔD2, D3-TL2) rescued structural disruptions observed in ΔD2 and ΔD3 (Supplemental Fig. S7C,D), despite the functional discrepancy described above between TLΔD2 and D3-TL2 where only D3-TL2 rescued IRES activity (Fig. 5C). Overall, functional rescues imparted by TL hairpins over their equivalent deletions always corresponded to a structural repair, but repairing structures did not always facilitate functional rescues (summarized in Fig. 5D).
Constructing a minimal sufficient mutant of the Insr 5′UTR IRES
Finding the minimal components for IRES activity would allow us to more precisely investigate its function by providing a less complex sequence element than the full-length UTR. Informed by the importance of D1, we created a series of sufficiency constructs to assess whether a structurally intact D1 is sufficient for IRES activity. First, each of the domains were individually assayed for sufficiency using the constructs D4-Solo (1% ± 1%), D3-Solo (1% ± 1%), D2-Solo (3% ± 1%), and D1-Solo (10% ± 2%); only D1-Solo exceeds 5% of full-length Insr IRES activity (Fig. 6A). We suspected that impairment of D1-Solo may be due to compromised structure. However, cellular DMS-MaPseq on D1-Solo revealed that it folded correctly (Supplemental Fig. S8A). We then added back portions of the UTR to achieve sufficiency, starting with only the conserved area (up to C138). The conserved sequence alone (Cons-Solo, 28% ± 1%) improved activity, and adding back the rest of D2 (D1D2, 49% ± 14%) further increased activity (Fig. 6B). Interestingly, DMS-MaPseq revealed compromised folding of D2 in D1D2, which may contribute to its insufficiency (Supplemental Fig. S8B).
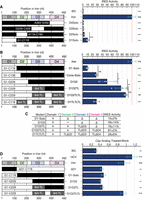
Creating a minimal sufficient Insr 5′UTR IRES. (A) Bicistronic luciferase reporter results on each domain individually with metrics and statistics, as previously described. The positions of retained UTR are specified for each mutant here and in subsequent subfigures. (B) Bicistronic luciferase reporters’ performance on sufficiency mutants with UTR or generic TL hairpin replacements added back until sufficiency is achieved. D1-Solo is the same data as in A, included for comparison. (C) Summary of the activity results in A and B combined with structure probing of these assayed UTRs in a monocistronic context (see Materials and Methods). Δ: Deletion, TL: tetraloop hairpin, +: intact structure, −: disrupted structure. (D) At bottom, sufficiency mutants assayed by monocistronic luciferase reporters with in vitro translation in rabbit reticulocyte lysate (RRL) challenged with m7G cap analog. Bars plot the ratio of signal between cap-treated and mock reactions to show the susceptibility of each UTR to excess cap analog (see Materials and Methods). For this experiment, n = 2. Error bars: average standard deviation from technical replicates.
We suspected adding back a TL hairpin in place of D3 could rescue the activity of D1D2 by repairing the structure of D2. As expected, a TL hairpin in place of D3 rescued the folding state of D2 (Supplemental Fig. S8C) and rescued activity compared to D1D2 alone (D1D2TL, 78% ± 11%, Fig. 6B). Given this result, we anticipated adding a TL hairpin in place of D4 to D1D2TL would also behave the same as the full-length context (where TLΔD4 improved activity, Fig. 5C). Surprisingly, this mutant, D1D2TLTL (87% ± 2%), did not significantly enhance activity compared to D1D2TL, but did exhibit full sufficiency (Fig. 6B). When probed, D1D2TLTL was entirely intact (Supplemental Fig. S8D). In the context of D1D2TLTL, replacement of D2 with a TL hairpin greatly impaired the IRES (D1TLTLTL, 28% ± 6%, Fig. 6B) but did not disrupt the structure of D1 (Supplemental Fig. S8E). These results are summarized in Figure 6C. This set of mutants indicates a requirement for D1 and D2, and a graded sufficiency as generic elements are added back in place of D3 and D4.
Monocistronic luciferase reporters challenged with cap analog in vitro corroborate the minimal sufficient Insr 5′UTR IRES
To corroborate our minimal sufficient 5′UTR identified by bicistronic reporters, we generated monocistronic mRNAs in vitro and assayed their activity in rabbit reticulocyte lysate (RRL). In vitro translation allows for direct treatments against cap-dependent translation initiation. Challenging the translation extract with excess N7-methylguanosine (m7G) competes with mRNA cap binding of eukaryotic translation initiation factor 4E (eIF4E), greatly limiting its ability to recruit transcripts to ribosomes (Adams et al. 1978; Cai et al. 1999). Transcripts dependent on their 5′ caps to initiate translation are inhibited by this treatment (Jackson et al. 1995). Monocistronic firefly luciferase reporter mRNAs were translated in vitro, and signal was measured after 30 min of incubation in RRL. The response of the constructs to m7G cap treatment was assessed in RRL that had not been treated with micrococcal nuclease to assay their performance under competitive conditions. For this experiment, n = 2. Two controls were used to assess nonspecific effects of m7G on the extract: The BG 5′UTR reporter measures the overall effect on cap-dependent translation initiation and residual noncanonical initiation activity providing a benchmark for the performance of transcripts with no IRES activity under these conditions. The HCV IRES reporter controls for nonspecific effects of cap analog treatment on the translation of cap-independent transcripts.
Addition of 250 µM m7G cap analog diminished translation of BG to 0.31 ± 0.03 (Cap:Mock), whereas signals from the positive control HCV IRES and full-length Insr were unaffected. The ΔD1 mutant (0.44 ± 0.03) as well as D1-Solo (0.48 ± 0.05) saw substantial loss of activity under cap treatment compared to mock treated comparable to the effect seen on BG. This recapitulates the results of the cellular bicistronic reporters where they were among the most impaired constructs for IRES activity. Interestingly, the graded sufficiency of D1D2 and D1D2TL seen in cells was not evident in vitro; instead, both D1D2 (0.41 ± 0.02) and D1D2TL (0.45 ± 0.03) were significantly impaired. D1D2 and D1D2TL were highly susceptible to m7G cap treatment, with Cap:Mock signal ratios insignificantly different from ΔD1 and D1-Solo. In contrast, the minimal sufficient D1D2TLTL (0.93 ± 0.06), with tetraloop hairpins replacing domains 3 and 4, appeared entirely sufficient and insignificantly different from full-length Insr 5′UTR in vitro (Fig. 6D), in agreement with its sufficiency in bicistronic reporters.
DISCUSSION
DMS-MaPseq provides robust structural constraints for modeling IRES elements
This comprehensive structural and functional analysis of the Insr IRES reveals a sophisticated RNA regulatory element that utilizes a discrete architecture to achieve cap-independent translation initiation. By probing known structures in tandem with the Insr 5′UTR IRES, we were able to employ a unique and stringent strategy for investigating the RNA secondary structure of a cellular IRES (Fig. 1). Our validation experiments with the well-characterized viral IRESs from HCV and EMCV demonstrate that DMS-MaPseq can accurately capture RNA secondary structures in cellular contexts, with high reproducibility (R2 > 0.96) and strong signal to structure agreement (AUROC > 0.80). We observed that the viral IRES structures in cells largely match their established in vitro conformations, with one significant exception: linearization surrounding the translation start codon in the HCV IRES (Figs. 2, 3). This finding is consistent with previous mapping of the 40S ribosomal subunit by toeprinting in vitro (Berry et al. 2011). It also highlights the efficiency and strength of the HCV IRES; the signal strength indicates that a high proportion of the mRNA is being melted in this region consistent with high levels of ribosome loading.
Key functional elements rely on overall structural integrity to drive Insr IRES activity
Our structural and functional analyses reveal that the Insr 5′UTR adopts a four-domain architecture (D1–D4, Fig. 4) in which D1, the most AUG-distal element, is the primary determinant of IRES activity (Fig. 5). D1's strong evolutionary conservation (Supplemental Fig. S3B) suggests an essential role in IRES activity, possibly through ribosome recruitment or positioning a hypothesis that requires further testing. Full replacement of D1 with a tetraloop hairpin fails to restore activity, whereas individual replacement of either of its two stems (G28-C41 or G50-C107) is tolerated (Supplemental Fig. S6). This suggests that D1 contains one or more sequence-dependent features or folds in a manner that cannot be mimicked by a generic stem–loop. The remaining domains contribute in a graded manner (D1 > D2 ≈ D3 > D4, Fig. 5), but no single element is sufficient (Fig. 6). This indicates that the Insr IRES operates through a distributed architecture.
Rational mutagenesis supports a model in which overall RNA topology rather than primary sequence drives IRES function. Tetraloop hairpin replacements that restore base-pairing, but not native sequence, rescue activity in D3 and D4 and restore structural patterns in D1 and D2 detected by DMS-MaPseq (Fig. 5B vs. D). Surprisingly, unstructured CAA repeats can also rescue IRES activity (Fig. 5C). The generic hairpins or unstructured RNA elements may serve as insulators to buffer the folding of other regions. This flexibility for variation in the Insr 5′UTR may explain how insulin receptor 5′UTRs broadly retain cap-independent translation capabilities despite extensive sequence divergence from flies to mammals.
Identification of critical elements enabled the design of a fully sufficient minimal IRES element
Our systematic deletion and replacement analysis identified a minimal sufficient IRES element (D1D2TLTL) that maintains equivalent cap-independent translation activity to the full-length Insr 5′UTR in cells and in vitro. This element contains the conserved D1 domain, the structured D2 region, and generic tetraloop hairpins replacing all of D3 and D4. In these mutants, the requirement for an intact structural conformation of D2 is also consistent with IRES operations distributed across the domains (Fig. 6). While D1D2 and D1D2TL showed graded sufficiency in cells, both were functionally impaired during in vitro cap analog competition assays. This discrepancy may reflect differences in the constraints of the readout in live cell-based assays versus limited round in vitro translation assays. It may also reflect differences in translation machinery, ribosome availability, or competing mRNA populations. More experimentation is required to answer this question. In any case, the identification of this minimal element provides a valuable tool for future mechanistic studies and demonstrates that Insr IRES function can be maintained with a significantly reduced 5′ UTR.
Broader implications for cellular IRES biology
The demonstration that structural integrity can be maintained with generic replacement elements agrees with the notion that cellular IRESs are more malleable than viral IRESs (Baird et al. 2006). In viral IRESs, nonconserved 3′ borders typically correspond to internal ribosome entry followed by scanning, often requiring portions of the EIF4F complex (for review, see Filbin and Kieft 2009). This distinguishes them from the Insr IRES, which operates independently of EIF4A (Olson et al. 2013) and EIF4G (Clark et al. 2023). Because of this independence, the Insr 5′UTR may allow for more nuanced regulation through other trans-acting factors (for review, see Komar and Hatzoglou 2011). The enhancement of IRES activity observed when only D4, at the 3′ border, is replaced with a tetraloop hairpin (Fig. 5C) suggests that this domain may inhibit IRES function under certain conditions. Future studies identifying trans-acting factors that bind to specific structural elements and the role of D4 will be crucial for understanding the mechanistic basis of Insr IRES function.
The identification of a minimal sufficient IRES element and the demonstration that overall structural integrity rather than specific sequences drives much of the IRES activity provide an important insight into cellular IRES biology. These findings provide a foundation for future mechanistic studies of cellular cap-independent translation driven by 5′UTR RNA structure and advance our understanding of how critical transcripts are maintained under translation environments impacted by cellular stress.
MATERIALS AND METHODS
DMS treatment and RNA extraction
HEK293T cells (from ATCC, Cellosaurus RRID: CVCL_0063) were maintained in Dulbecco's modified Eagle's medium (Genesee Scientific), with added 10% fetal bovine serum (Gemini Bio), 1 µg/mL insulin solution from bovine pancreas (MilliporeSigma), and 1× penicillin/streptomycin (Fisher Scientific) at a subculture ratio of 1:6. For transfections, 10 cm tissue culture plates were seeded with 3 × 10⁶ cells each. After 24 h, the cells were cotransfected with a Gaussia luciferase reporter containing HCV, EMCV, and Insr IRESs in their 5′UTRs using 48 µL 1 mg/mL polyethylenimine (PEI) and 4 µg of each plasmid (a 4:1 µL PEI to µg DNA ratio). The HCV sequence probed is subtype 1b genomic RNA from strain NC1 (gift from the laboratory of Jennifer Doudna). The EMCV sequence was obtained from the pSNAP-tag(m) mammalian expression vector (NEB), and matches (Duke et al. 1992), but with 7As in its bifurcation loop. For mutants of Insr, 12 µg of plasmid was transfected. After 48 h, the cells reached a confluency of ∼80% and were treated with dimethyl sulfate (DMS) probing reagent. A total of 200 µL (final concentration 2%) DMS was dispersed dropwise into the DMEM atop the cells in 10 cm plates. The plates were incubated at 37°C for 5 min, and the reaction was quenched by adding 10 mL 30% β-mercaptoethanol. RNA was extracted by scraping the cells and harvesting in 15 mL conical tubes. The cell pellet was homogenized in 1 mL TRI-Reagent (Molecular Research Center, Inc.), 200 µL chloroform was added, and the sample was mixed, incubated for 1 min at room temperature, and then centrifuged at 21,000g for 15 min at 4°C. The aqueous phase was transferred to a new tube. RNA was then purified using the Zymo Clean & Concentrator-25 kit following the manufacturer's protocol with DNase I digestion in the column.
DMS probing in vitro
In vitro transcribed RNA containing HCV, EMCV, and Insr UTR sequences was pooled. In vitro probing was conducted as described (Lan et al. 2022). Briefly, 1 µg of in vitro transcribed RNA containing the structures of interest was added to a mixture containing 26 µg of calf liver tRNA to a total volume of 100 µL. The tRNA was added to ensure identical RNA:DMS ratios between these probing experiments and subsequent probing of single mutants. These RNAs were refolded by denaturing at 95°C for 1 min and then placing them on ice. Sodium cacodylate (final concentration 100 mM) and MgCl2 (final concentration 6 mM) were added to yield a final volume of 292.5 µL. The RNA was incubated at 37°C for 5 min to reach folding equilibrium (Kieft et al. 1999). A total of 7.5 µL of DMS (final [DMS] = 2.5%) was added, and the probing reaction was mixed at 37°C, 500 rpm on a thermomixer with a 1.5 mL tube attachment for 5 min. The reaction was neutralized by adding 150 µL of 100% β-mercaptoethanol. The probed RNAs were then cleaned using the recommended RNA Clean & Concentrator-5 protocol (Zymo).
Reverse transcription for mutational profiling
Reverse transcription (RT) was performed with maltose binding protein (MBP) fused thermostable group II intron reverse transcriptase (TGIRT) purified with amylose resin as previously described (Mohr et al. 2013). All DNA oligos were purchased from Genewiz, Inc., and their sequences are listed in Supplemental Table S1. Two picomoles of RT primer specific to our targets was annealed to the RNA by incubating at 75°C for 10 min in a thermocycler and ramping down 0.2°C/sec to 25°C. After reaching 25°C, a master mix containing RT buffer (final concentration: 10 mM NaCl, 10 mM MgCl2, 20 mM Tris-HCl pH 7.5, 1 mM DTT), 1 µL TGIRT, and 10 mM dNTPs (BioBasic) was added and mixed. The RT reaction was incubated at 25°C for 30 min and then at 60°C for 90 min, followed by 10 min at 70°C. One microliter (5U) of RNase H (NEB) was added, and the reaction was incubated for 30 min at 37°C. The cDNA was then purified using DNA cleanup columns (BioBasic).
Target-specific DMS-MaPseq library preparation
Polymerase chain reaction was performed on the cDNA targeting tiled amplicons along each 5′UTR for a maximum of 27 cycles using PfuX7 DNA polymerase. His-tagged PfuX7 was expressed from pET-PfuX7 in BL21*(DE3) Escherichia coli cells (Thermo Fisher) containing the pLacIRARE2 plasmid (Novagen) and purified with nickel resin as previously described (Nørholm 2010). The primers for these reactions contained Illumina adapter sequence as overhangs. For forward primers, this overhang was: 5′-ACACGACGCTCTTCCGATCT-3′; reverse primers: 5′-AGACGTGTGCTCTTCCGATCT-3′. These fragments were purified using a column cleanup to remove unused oligos (BioBasic). A subsequent PCR of six to eight cycles was used to add P5/P7 attachment sequences and a single barcode to 300 ng of the initial PCR product for a completed library, and these amplicons were column purified again. Up to 70 library fragments were pooled into each sequencing run on a MiSeq Micro PE150 flow cell (Illumina). To sequence multiple replicates and fragments with common primers, the resultant FASTQ files were barcode split using Barcode Splitter hosted on Galaxy (Afgan et al. 2016). These barcodes were the first 6 bp of each target-specific primer, which are the first bases in each read, tolerating one mismatch. The split reads were interlaced using FASTQ interlacer to separate fragments with only one unique primer and then deinterlaced using FASTQ deinterlacer to differentiate fragments (Blankenberg et al. 2010). Interlacing and deinterlacing were also conducted on Galaxy (Afgan et al. 2016). The data were analyzed using the established detection of RNA folding ensembles by expectation maximization (DREEM) pipeline, where mapped reads containing mutations are converted to bit vectors as described (Tomezsko et al. 2020). Data were filtered to exclude reads containing mutations spaced <4 nt apart, reads with a proportion of mutations exceeding 10% of their length, and reads with a quantity of mutations exceeding the median number of mutations by 3 SD as previously described (Tomezsko et al. 2020; Lan et al. 2022). A summary of this analysis is included in Supplemental Figure S1A. In these experiments, frequency histograms tracking mutations were typically centered on two mutations/read (Supplemental Fig. S1D,E,H,I,L,M), which corresponds to previous work titrating DMS treatments in various cellular contexts (Rouskin et al. 2014; Zubradt et al. 2017; Tomezsko et al. 2020).
DMS-constrained RNA secondary structure prediction
Secondary structure modeling was conducted using RNAstructure via the RNAstructure Python Interface (Reuter and Mathews 2010). Three input metrics were set for the predictions: normalized bases, which specify the mutation frequency corresponding to 1.0 in DMS signal normalization; maximum pairing distance, which restricts long-distance base-pairing; and signal threshold, under which all mutation frequencies are set to 0. Each base's DMS reactivity is normalized to a scale of 0–1 and expressed as a proportion of the most reactive set specified in normalized bases. Bases with normalized DMS reactivity of 0.0–0.4 are colored blue in all plots, 0.4–0.8 yellow, and 0.8–1.0 red. For all models reported, normalized bases are 5% the length of the predicted structure rounded to the nearest whole number, maximum pairing distance is 250 nt, and the signal threshold is a 0.005% mismatch frequency. Prediction used an energy function previously described for DMS and SHAPE mutational profiling, which does not use an empirically determined slope and intercept (Cordero et al. 2012).
Calculating modified Fowlkes–Mallows Index (mFMI) for structure comparison
The Fowlkes–Mallows Index (FMI) is used as a metric for base-pairing similarity between two RNA secondary structures ranging from 0 (no similarity) to 1 (identical); FMI is calculated as the geometric mean of the true positive rate (TPR) and the positive predictive value (PPV), and it was originally used to compare hierarchical clustering (Fowlkes and Mallows 1983). For RNA structure comparison, TPR is the proportion of identical base pairs out of identical base pairs plus false negatives, and PPV is the proportion of identical base pairs out of identical base pairs plus false positives. The mFMI used in this report factors in shared unpaired bases, and it is calculated as previously described (Lan et al. 2022): by multiplying the FMI by (1 − the proportion of shared unpaired bases), which weights the FMI to the proportion of paired bases, and then adding the proportion of shared unpaired bases to get the final mFMI value. With u representing shared unpaired bases, mFMI = u + (1 − u) × FMI. mFMI in this report is calculated in sliding windows of 30 nt in 1 nt increments, plotting the result to the 15th nucleotide in the window. mFMI was computed with the DREEM pipeline.
Calculating the area under the receiver operator characteristic curve (AUROC)
The area under the receiver operator characteristic curve (AUROC) reflects signal-to-structure agreement between the DMS-MaPseq data and the predicted structure. This assumes that the reactivity of unpaired bases should be higher than that of paired bases. The predicted secondary structure is used to classify a given base as paired or unpaired. DMS reactivity values exceeding a sliding threshold and classified as paired are considered false positives, while paired bases below the threshold are considered true positives. The AUROC values were computed with SciPy (Virtanen et al. 2020).
Site-directed mutagenesis
The pGL-RSV-RF parental plasmids were generated in Olson et al. (2013). Site-directed mutagenesis was conducted with whole-plasmid PCR, using divergent primers that exclude the deletions of interest and add sequence as overhangs for the specified mutants. All plasmids were sequenced through their luciferase ORFs by Sanger sequencing, and plasmids with effects were fully sequenced via whole-plasmid sequencing. For plasmids with multiple mutagenesis sites, consecutive plasmids were generated. A list of all primers is contained in Supplemental Table S1. A list of all plasmids’ mutagenesis sites and the primers used to generate them can be found in Supplemental Table S2.
Quantitative RT-PCR of bicistronic reporters
Individual hydrolysis probes and amplicon primers were designed targeting the Renilla (REN) luciferase and firefly (FF) luciferase open reading frame (ORF) using Primer3 (Untergasser et al. 2012) (primers 96–103 in Supplemental Table S1). The REN probe contained hexachlorofluorescein (HEX) on the 5′ end and was quenched by black hole quencher 1 (BHQ1). The FF probe contained 6-carboxyfluorescein (FAM) on the 5′ end and was quenched by BHQ1 (Supplemental Fig. S4A). The efficiency of the amplicons and probes was optimized in a multiplexed reaction using the empty bicistronic plasmid as a template. A two-step PCR program (95°C for 10 sec, 60°C for 30 sec) preceded by a 3 min initial melting step at 95°C was found to detect the target with equal efficiency for both probes (Supplemental Fig. S4B).
Plasmids containing the various bicistronic reporters were transfected into HEK293T cells in 12 well tissue culture plates 24 h after seeding 0.1 × 10⁶ cells/well. Polyethylenimine (PEI) was used in a ratio of 3 µL 1 mg/mL PEI for 1 µg plasmid, with 1 µg of plasmid per well. After 3 days, the media was removed, and 500 µL of NEB Monarch StabiLyse DNA/RNA Buffer was added to each well. The plates were stored at −20°C. For RNA isolation, the plates were thawed, and RNA was purified using the Monarch Spin RNA Isolation Kit (NEB) following the manufacturer's instructions, including the on-column DNase I treatment. RNA was eluted in 25 µL nuclease-free water.
For cDNA synthesis, 12.5 µL of eluted RNA was combined with 1 pmol each of an ORF-specific primer (Primer 96 for FF, Primer 97 for REN, Supplemental Table S1) and 200 ng random primers (Thermo) in a final volume of 15.5 µL. The mixture was heated to 70°C for 10 min, then brought to 25°C, and subsequently the mixture was placed on ice. The annealed RNA was combined with 9.5 µL of a master mix containing SuperScript IV (Thermo), dNTPs, DTT, and SSIV RT buffer (Thermo) components. The final concentrations of the reaction were as follows: 8 U/µL SuperScript IV, 0.4 mM dNTPs, 10 mM DTT, 1× SSIV buffer, 40 nM Primer 96, 40 nM Primer 97, 8 ng/µL random primers. The reaction was heated to 25°C for 20 min followed by 50°C for 20 min and inactivated by heating to 80°C for 15 min. After cooling to room temperature, 5 U of RNase H was added, and the reaction was heated to 37°C for 20 min. The cDNA was diluted by addition of 38 µL TE.
For the quantitative PCR, 5 µL of diluted cDNA was transferred to each well of a 384 well hard-shell white PCR plate (Bio-Rad). A master mix containing forward and reverse primers both for the FF ORF (Primers 98 and 99) and the REN ORF (Primers 100 and 101) and the probes (Primer 102 for FF, Primer 103 for REN) in 5 µL TE and 10 µL Taq 2× Master Mix (NEB) (15 µL total) was added to each well on ice. The plate was assayed on a CTX384 instrument (Bio-Rad) using the two-cycle protocol described above. All samples were assayed in triplicate.
Bicistronic luciferase assays
Plasmids containing bicistronic luciferase reporters driven by RSV promoter were transfected into HEK293T cells on 24 well tissue culture–treated plates 24 h after seeding 50,000 cells/well. Polyethylenimine (PEI) was used in a ratio of 4 µL 1 mg/mL PEI for 1 µg plasmid, with 600 ng of plasmid per well. Three technical replicates were executed per mutant, with beta-globin 5′UTR as a non-IRES control and HCV IRES as a positive control. After 48 h, the cells were harvested at ∼80% confluency. The DMEM was removed, and the cells were washed once with 200 µL 1× PBS rocking for 5 min at room temperature. The PBS was removed, and 100 µL of 1× passive lysis buffer (Promega) was added. The cells were lysed by rocking for 20 min at room temperature, and then 10 µL of lysate was assayed immediately, taking care not to aspirate any cell debris. First, 100 µL of firefly luciferase buffer was added, and the well was read; then, 100 µL of Renilla luciferase buffer was added, and the well was read again. Firefly luciferase buffer was as follows: 75 mM Tris pH 8.0, 5 mM MgSO4, 0.1 mM EDTA, 0.53 mM ATP, 5 mM D-luciferin (GoldBio). Renilla luciferase buffer was as follows: 25 mM Na4PPi, 10 mM NaOAc, 15 mM EDTA, 500 mM Na2SO4, 1 m NaCl, 10 mM coelenterazine (GoldBio), adjusted to pH 5.0. The resulting luciferase values were read on a Synergy HTX plate reader (BioTek). Raw luciferase assay data for all experiments can be found in Supplemental Table S3.
Bicistronic luciferase assay signal normalization (IRES activity)
To compute IRES activity, the average firefly:Renilla signal in the mutant UTRs was divided by the average firefly:Renilla signals of technical replicates of the full-length Insr 5′UTR reporter, multiplying by 100 to produce a percentage. This average is reported for each biological replicate as individual points in the IRES activity plots. Error bars are the standard deviation of biological replicates, except for full-length (which is 100% of itself in every assay). The error bars for full-length Insr are the standard deviation of technical replicates, averaged across all biological replicates. These computations can be found in Supplemental Table S3. Statistical comparisons were performed by one-way analysis of variance (ANOVA) followed by Tukey's honestly significant difference (HSD) test using MATLAB R2022b (The MathWorks Inc. 2022). Significance indicators are as follows: (***) P ≤ 0.0005, (**) P ≤ 0.005, (*) P ≤ 0.05, (not significant, ns) P > 0.05. Asterisks/ns to the right of each plot are in comparison to the full-length UTR, while individual comparisons of interest are denoted in each plot.
Comparing DMS-MaPseq signal with R2 on adenosines and cytosines
To compare in a structure-naïve manner, DMS-MaPseq data from the mutant constructs were directly compared to that of the full-length UTR. In MATLAB R2022b (The MathWorks Inc. 2022), the coefficient of determination (R2) was calculated in windows of 31 nt plotted from the center, considering only values on As and Cs. Only windows containing positions of shared sequence are plotted. Windows with eight or fewer As and Cs were discarded. The deletions or tetraloop hairpin replacements are depicted in each plot.
In vitro transcription
The plasmids containing the mutant UTRs were used to generate a PCR template for in vitro transcription. For in vitro translation luciferase assays, the same plasmids used for in-cell luciferase assays were used to create the in vitro transcription template. In PCR, 43 adenines were added by the reverse primer, and a T3 RNA Polymerase promoter was added (Primers 70 and 71). Reporters with different 5′ ends used unique primers: ΔD1 (Primer 70), BG (Primer 71), and HCV (Primer 72). For in vitro DMS-MaPseq, the same plasmids used for in-cell DMS-MaPseq were used, and in vitro transcription templates were prepared by PCR using Primer 75 and Primer 76. Templates were purified using a column cleanup protocol (BioBasic). All templates were in vitro transcribed using T3 RNA Polymerase (New England Biolabs) in 100 µL reactions. The composition of these reactions was as follows: 40 mM Tris HCl pH 7.9, 10 mM DTT, 2 mM Spermidine-HCl, 20 mM MgOAc, 7.5 mM NTPs (BioBasic), 1 U SUPERaseIn RNase inhibitor (Thermo Fisher), and 0.5 U inorganic pyrophosphatase (Sigma-Aldrich). The reactions were incubated for 1 h at 37°C. The RNA was then cleaned using a Zymo RNA Clean & Concentrator-25 kit according to the manufacturer's recommendations with the optional in-column DNase I treatment. The resulting RNA's purity was assessed by NanoDrop and run on a 1% agarose 1× TBE gel using 2× RNA Loading Dye (New England Biolabs) and stained with 1 µg/mL ethidium bromide. The RNA was stored at −80°C.
Capping of in vitro transcribed RNA
RNAs assayed with in vitro translation were capped using the Vaccinia Capping System (NEB). Reactions were conducted according to the manufacturer's specifications. These reactions were cleaned on Zymo Clean & Concentrator-5 columns. Controls (Insr, BG, and HCV) were capped in three reactions, pooled, and purified with the Zymo Clean & Concentrator-25 kit according to manufacturer recommendations. The resulting elutions were stored at −80°C.
Monocistronic luciferase assays in vitro
Untreated rabbit reticulocyte lysate (RRL) was purchased from Green Hectares, and RRL was treated with hemin by adding 100 µL of a 1 mM solution to 5 mL RRL (20 µM final concentration of hemin) and mixed immediately upon thawing as previously described (Jackson and Hunt 1983). The RRL was not treated with micrococcal nuclease to assay the reporters under competitive conditions. In vitro translation assays were conducted in 20 µL reactions with 10 µL of RRL. The reaction was supplemented with 60 µM amino acids, 100 ng/µL calf liver tRNA, and creatine kinase energy regeneration mix. Energy generation mix is as follows: 20 mM creatine phosphate (Sigma-Aldrich), and 100 ng/µL creatine phosphokinase type I from rabbit muscle (Sigma-Aldrich). The buffer was 22 mM HEPES pH 7.4 with 0.1 mM spermidine, 0.4 mM MgOAc, and 30 mM KOAc. Reactions containing 100 ng of mRNAs with the cap-dependent beta-globin 5′UTR and hepatitis C virus IRES were assayed as negative and positive controls, respectively. For comparisons between Insr and mutated reporters, mRNA was matched for molar input: 200 ng of Insr RNA (0.27pmol), or 0.27 pmol of mutant RNA, varying in mass based on RNA length. The reaction was incubated for 60 min at 30°C and stopped by the addition of 1 reaction volume (10 µL) of 5× PLB diluted to 2× in water (Promega). Firefly luciferase was then assayed on the Synergy HTX plate reader (BioTek) in the same manner as previously detailed. Statistical comparisons follow the same procedure used for the bicistronic luciferase reporters.
Software used for analysis and for plotting
For analysis, the DREEM pipeline was run locally and used other programs. DREEM is operated through Python 3.10.15. These analyses used Cutadapt 3.7 to trim adapter sequences (Martin 2011), FastQC 0.12.1 to analyze sequencing quality (Andrews 2010), and Bowtie2 2.5.4 for alignments (Langmead and Salzberg 2012). RNAstructure was used for secondary structure modeling (Reuter and Mathews 2010). MATLAB R2022b was used for statistics in luciferase assay plots with MATLAB functions anova1 and multcompare (The MathWorks Inc. 2022). The DREEM pipeline software (Tomezsko et al. 2020) can be found online at https://codeocean.com/capsule/6175523/tree/v1.
VARNA 3.93 was used for RNA secondary structure figures (Darty et al. 2009). MATLAB r2022b was used for all other plots (The MathWorks Inc. 2022). Adobe Illustrator 28.7.1 was used to build the complete figures.
Limitations
Large RNA structures can present a challenge to secondary structure predictions. Though we selected a representative prediction, we acknowledge that our secondary structure model of the Insr 5′UTR requires refinement and corroboration. Even if our constraint data are found to be biologically representative by future studies, there may be structural features which our prediction tools cannot capture. When predicting RNA secondary structures from probing data, the probing may be influenced by RNA tertiary structure, and bases that appear unpaired by DMS reactivity may be involved in non-base-pairing interactions such as aromatic stacking.
DATA DEPOSITION
Processed data (including raw and normalized DMS-MaPseq constraint files, RNA secondary structure prediction files, and statistical assessment of luciferase assay results) reported as the results of this study, as well as the plasmids used, are accessible through the corresponding author upon reasonable request. FASTQs used for DMS-MaPseq constrained RNA secondary structure prediction are deposited in the National Library of Medicine Sequencing Read Archive (SRA). Viral IRES DMS-MaPseq data accessions: SRR31191072, SRR31191071, SRR31191070, SRR31191069. Mouse Insr 5′UTR DMS-MaPseq data accessions: SRR31191090, SRR31191089, SRR31191080, SRR31191074, SRR31191073, SRR31191088, SRR31191087, SRR31191086, SRR31191085, SRR31191084, SRR31191083, SRR31191082, and SRR31191081. These accessions are separated by UTR variant and probing context. A current link to the DREEM analysis software can be found in Materials and Methods. Raw luciferase assay data are deposited in Supplemental Table S3.
SUPPLEMENTAL MATERIAL
Supplemental material is available for this article.
ACKNOWLEDGMENTS
We thank J.E. Haber for helpful manuscript input and J.A. Doudna's laboratory for providing the HCV IRES sequence. This work was supported by a grant to M.T.M. (R21AG081682). W.B.D. was supported by a training grant (T32GM007122). The content is solely the responsibility of the authors and does not necessarily represent the official view of the National Institutes of Health.
Author contributions: W.B.D., S.R., and M.T.M. conceived and designed the project. W.B.D. carried out the experiments with contributions from M.T.M. for RT-qPCR and T.C.T.L. for initial DMS-MaPseq library preparation. W.B.D. performed data analysis with input from S.R. and M.T.M. W.B.D. and M.T.M. interpreted the results and wrote the article with input from S.R.
Footnotes
-
Article is online at http://www.rnajournal.org/cgi/doi/10.1261/rna.080775.125.
-
Freely available online through the RNA Open Access option.
- Received September 24, 2025.
- Accepted December 15, 2025.
This article, published in RNA, is available under a Creative Commons License (Attribution-NonCommercial 4.0 International), as described at http://creativecommons.org/licenses/by-nc/4.0/.
REFERENCES
MEET THE FIRST AUTHOR

Meet the First Author(s) is an editorial feature within RNA, in which the first author(s) of research-based papers in each issue have the opportunity to introduce themselves and their work to readers of RNA and the RNA research community. William B. Dahl is the first author of this paper, “Structure-informed mutagenesis identifies combinatorial contributions to mouse insulin receptor IRES function.” William obtained his PhD from Brandeis University, working in the laboratory of Michael T. Marr II, with an interest in cellular stress response. He studied functional RNA structures, and modeled mRNA 5′UTRs that exert translation control in mammalian cells and in Drosophila.
What are the major results described in your paper, and how do they impact this branch of the field?
Stress inhibits global protein synthesis, yet some transcripts continue to be translated through internal ribosome entry sites (IRESs). The insulin receptor transcript contains an IRES, and the receptor itself is a key “off switch” for cellular stress: Its sustained expression is essential for restoring healthy cell metabolism. Although many viral IRESs rely on defined RNA structures, the structural features that enable efficient translation of endogenous cellular RNAs are just beginning to be elucidated. In this work, we deployed a rigorous structure–function strategy to investigate the insulin receptor IRES. We first modeled this IRES by probing it in tandem with known RNA structures, then used this model to guide targeted mutagenesis. We subsequently assayed the translation outputs of these variants and revisited them with additional structure probing. This approach identified the RNA elements that are necessary for IRES activity and enabled the design of a minimal sufficient structure. These elements are highly conserved and may maintain insulin receptor protein expression, thereby allowing metazoan cells to return to a healthy state once stress subsides.
What led you to study RNA or this aspect of RNA science?
Previous work in the Marr Lab had found a conserved capacity for cap-independent translation initiation in the insulin receptor transcripts of Drosophila and mouse. Our subsequent investigations assessed the protein dependencies of the mammalian RNA element, finding that it acts independently from the cap-binding complex both in cells and in vitro, and that its activity is enhanced by a disordered region within an enzyme that promotes ribosomal subunit joining. The present manuscript is an initial foray into the RNA dependencies of these elements, but for many cellular IRESs, the contribution of RNA structure is not yet clear. Recent advancements in RNA structure probing methods brought to us by Professor Silvi Rouskin's laboratory enabled an in-depth analysis of the secondary structure of the insulin receptor IRES.
During the course of these experiments, were there any surprising results or particular difficulties that altered your thinking and subsequent focus?
Modeling large RNA structures is inherently challenging. Unlike proteins, RNA is mainly composed of only four monomers, allowing for a landscape of coexisting folding conformations. Recent methodological advancements allow us to resolve these structures. However, these approaches still lack the resolution required to identify higher-order complexities, which are often visible in viral IRESs via X-ray crystallography or cryo-electron microscopy. This is evident in the control RNAs analyzed in this study, where contributions from many groups have found tertiary interactions critical for their function. Although the signatures of these interactions are detectable in our data, we are not yet able to predict or model them de novo in previously uncharacterized RNAs. I expect that ongoing efforts to better interpret the nuances of mutational profiling data are likely to close this gap, enabling the discovery of complex RNA architectures that previously required substantial experimental investment to uncover.
What are some of the landmark moments that provoked your interest in science or your development as a scientist?
For me, RNA structure was made tangible by finding disruptions in our structures and successfully rescuing them with engineered variants. This result sparked my interest in the wider world of RNA structure, including its role in ribozymes, determining RNA interacting partners, and the RNA world hypothesis. Reading widely in these fields has already shaped my postdoctoral trajectory, and I am looking forward to future discoveries that implicate this critical property of RNA in cellular biology.
What are your subsequent near- or long-term career plans?
I aim to start an independent research group focused on understanding how RNA structure encodes biological function. Through this work, it has become clear to me that answering these questions requires the integration of molecular and computational methods. I am currently a postdoctoral fellow in the Martienssen Lab investigating RNA structures that influence chromatin state and gene regulation, and I hope to extend this experience to new RNA-guided regulatory systems.




