


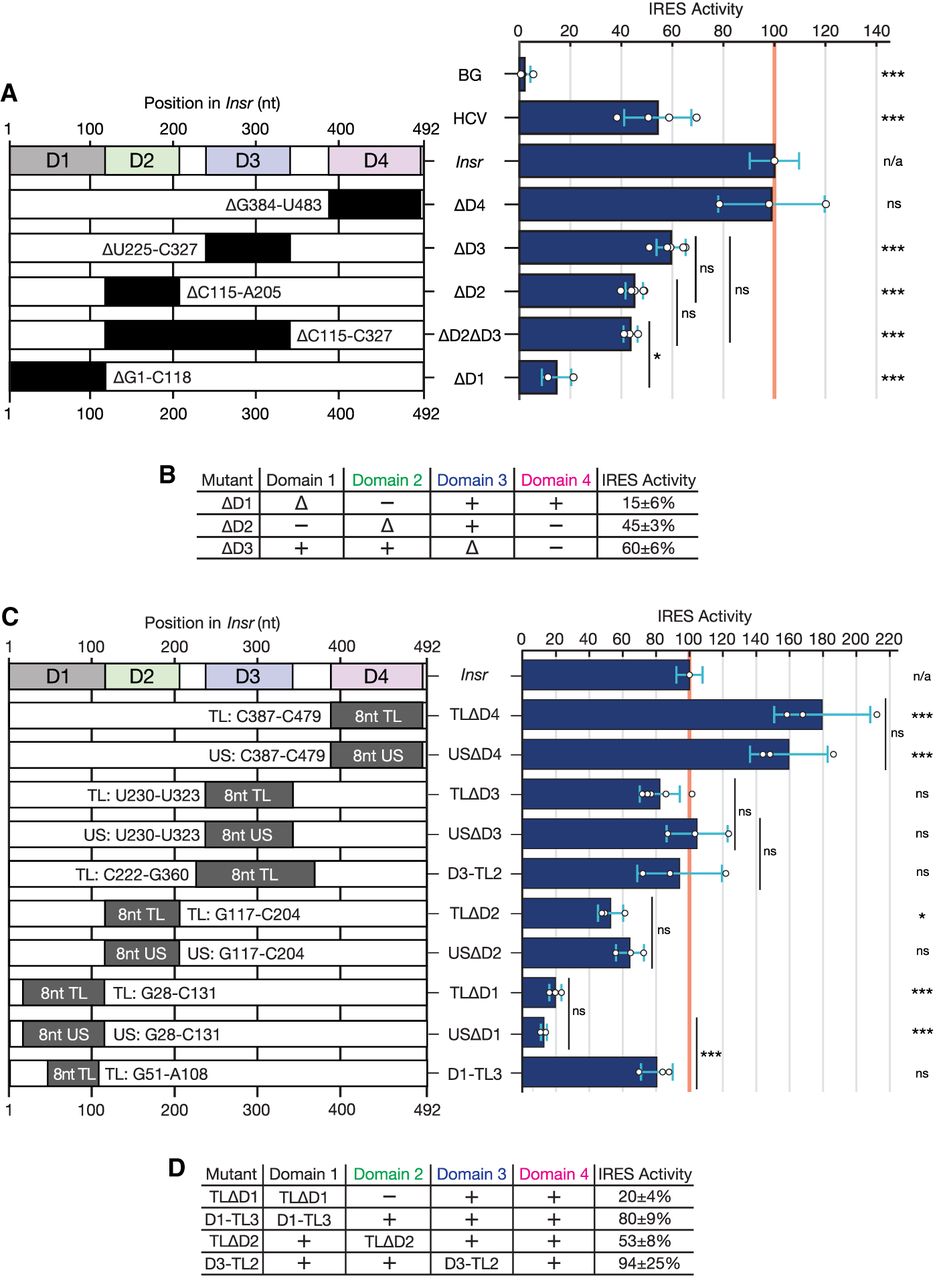
Identifying critical portions of the Insr 5′UTR. (A) Performance of bicistronic luciferase reporters deleting each indicated region. At left, black bars indicate deletions and white bars indicate that the sequence is retained. The plot of IRES activity at right is normalized as described in Materials and Methods. BG: beta-globin cap-dependent UTR serving as negative control. HCV: viral IRES serving as positive control. Points: mean for each biological replicate, with three technical replicates each. Error bars: standard deviation of these means. Asterisks indicate P-values by ANOVA followed by Tukey's HSD (see Materials and Methods): (*) P ≤ 0.05, (**) P ≤ 0.005, (***) P ≤ 0.0005. Asterisks at right are in comparison to full-length Insr UTR (denoted by the red line) with specific comparisons inlaid in the plot. Deleted sequence ranges are specified for each mutant. (B) A summary of the data depicted in A combined with structural perturbations observed with DMS-MaPseq in live cells (detailed in Supplemental Fig. S5). Δ: Deletion, +: intact structure, −: disrupted structure. (C) Bicistronic luciferase reporter performance of constructs with equivalent deletions to those in A, but with tetraloop hairpin (TL) or unstructured (US) replacements. Positions replaced by TLs and US elements are specified. Additional TL hairpin mutants’ performance and a diagram of these mutants relative to the predicted structure can be found in Supplemental Figure S6. (D) Summary of TL rescues of function depicted in C combined with structural rescues (detailed in Supplemental Fig. S7).




