


Assessing Microprocessor complex mutations with a Microsensor system
- 1Division of Life Science, The Hong Kong University of Science & Technology, Hong Kong 999077, China
- 2HKUST Shenzhen Research Institute, Shenzhen 518057, China
- Corresponding author: tuananh{at}ust.hk
-
↵3 These authors contributed equally to this work.
-
Handling editor: Javier Caceres
Abstract
The Microprocessor complex, consisting of DROSHA and DGCR8, is essential for miRNA maturation and gene regulation. Mutations in these proteins are associated with Wilms tumor (WiT), a common pediatric kidney cancer. To explore the impact of these mutations on WiT pathogenesis, we developed the Microsensor system, a novel tool for dynamically monitoring Microprocessor activity in human cells. Using this system, we engineered HEK293T cells to express the DGCR8-E518K mutation, which was previously identified in WiT patients. Our results show that this mutation significantly impairs the Microprocessor's ability to process specific pri-miRNAs in vitro and alters the miRNA expression profiles. This study demonstrates the utility of the Microsensor system in investigating the molecular mechanisms underlying mutations related to the Microprocessor complex.
Keywords
INTRODUCTION
MicroRNAs (miRNAs) are short RNA molecules, ∼22 nt long, that regulate gene expression by binding to messenger RNAs (mRNAs) and either degrading them or inhibiting their translation (Jonas and Izaurralde 2015; Iwakawa and Tomari 2022; Shang et al. 2023). Abnormal miRNA expression can lead to various cellular defects and diseases (Rupaimoole and Slack 2017; Cui et al. 2024). The canonical miRNA biogenesis pathway, crucial for regulating miRNA expression in human cells, involves the DROSHA-DGCR8 (or Microprocessor) complex that cleaves primary miRNAs (pri-miRNAs) into precursors (pre-miRNAs) (Denli et al. 2004; Gregory et al. 2004; Han et al. 2004; Landthaler et al. 2004). These are further processed by DICER into miRNA duplexes, with one strand forming the miRNA-induced silencing complex with the Argonaute protein (Ha and Kim 2014; Bartel 2018; Nguyen et al. 2019).
Microprocessor uses two main mechanisms: canonical and noncanonical. In the canonical mechanism, the Microprocessor measures a 13 bp distance from the junction of the pri-miRNA to the cleavage sites in humans (Han et al. 2006; Nguyen et al. 2015; Kwon et al. 2016; Jin et al. 2020; Partin et al. 2020) and a 15 bp distance in Caenorhabditis elegans (Nguyen et al. 2023b). Conversely, the noncanonical mechanism does not rely on these specific distances (Nguyen et al. 2023a). Instead, it can cleave at sites much closer to the junction, depending heavily on Drosha RNA recognition sites (DRES). Additionally, Microprocessor interacts with various RNA elements and motifs such as UG, mGHG, UGU, miBMW, CNNC, and bGWG, as well as cofactors like SRSF3, SRSF7, ERH, SAFB1, and SAFB2 (Auyeung et al. 2013; Fang and Bartel 2015; Nguyen et al. 2015; Partin et al. 2017; Kim et al. 2018, 2021; Nguyen et al. 2018; Kwon et al. 2019; Dang et al. 2020; Li et al. 2020, 2021; Le et al. 2023; Garg et al. 2024). These interactions are crucial for the precise RNA processing by Microprocessor, influencing its activity and specificity.
Wilms tumor (WiT), also known as nephroblastoma, is the most common renal malignancy in children and is named after Max Wilms, who first described it. Despite improved survival rates, long-term health issues persist for many survivors. Genome sequencing has identified mutations in several key genes, including WT1, TP53, and SIX1/SIX2. Specific mutation rates include 12% in WT1, 32% in WTX, and 15% in CTNNB1, while TP53 mutations occur in ∼70% of cases (Pelletier et al. 1991; Maschietto et al. 2014; Rakheja et al. 2014; Torrezan et al. 2014; Walz et al. 2015; Spreafico et al. 2021). Furthermore, up to 18% of WiT mutations involve genes crucial for miRNA biogenesis such as DROSHA and DGCR8, which are part of the Microprocessor complex (Rakheja et al. 2014; Walz et al. 2015; Wegert et al. 2015). These mutations often co-occur with SIX1 mutations, suggesting a complex interplay that may accelerate tumor development. Additionally, WiT can be classified into high-risk and low-risk groups based on methylation patterns, with the high-risk group showing a higher recurrence rate and often harboring mutations in DROSHA, DGCR8, and WT1. Mutations in the DROSHA RNase IIIb domain and DGCR8 disrupt their roles in the miRNA processing complex, affecting the expression and function of several miRNAs, though the specific targets and impacts on miRNA processing remain unclear (Torrezan et al. 2014; Walz et al. 2015). This complexity underscores the need for ongoing research to unravel the genetic underpinnings and improve treatment strategies for Wilms tumor.
The E518K mutation in the dsRBD domain of DGCR8, associated with a reduction in certain miRNAs, has been identified in 9.1% of high-risk blastemal-type Wilms tumors and in familial cases of multinodular goiter with schwannomatosis (Wegert et al. 2015; Rivera et al. 2020). This mutation impairs the Microprocessor's capacity to process pri-miRNAs. In 2022, the study rescued DGCR8 knockout (KO) cells derived from an embryonic stem (ES) cell line with wild-type DGCR8 and the E518K mutant and found that DGCR8-E518K particularly affects the expression of the miR-302 family, crucial for stem cell regulation (Vardapour et al. 2022).
The CRISPR-Cas9 system has been extensively used for genome editing in human cells, demonstrating significant advancements in genetic engineering (Cho et al. 2013; Cong et al. 2013; Hsu et al. 2013; Jinek et al. 2013; Mali et al. 2013). The efficacy of this technique largely depends on the cleavage efficiency of Cas9, which is directed by single-guide RNAs (sgRNAs), and the cell's ability to repair double-strand breaks. Efforts to enhance the integration of donor DNA into the genome post-Cas9 cleavage have been explored through various methods (Leal et al. 2024). Despite these initiatives, the overall editing efficiency remains modest, typically only 1%–5% for all site knockin, posing significant challenges and making the process of achieving precisely edited cells both time-consuming and difficult.
The previous attempt to use mouse embryonic stem cell (mESC) lines with DGCR8 knockout (DGCR8-KO) faced challenges. These cells were rescued by reintroducing DGCR8-WT and DGCR8-E518K into the genome using a transposase-mediated method. While this approach effectively reintroduces the gene, it can lead to protein overexpression. Additionally, the method poses risks as it may inadvertently integrate exogenous genes into endogenous gene sites, potentially disrupting these endogenous genes (Vardapour et al. 2022). Several studies have analyzed miRNAs extracted from human Wilms tumor (WiT) tissues, identifying a range of dysregulated miRNAs (Wu et al. 2013; Rakheja et al. 2014; Torrezan et al. 2014; Walz et al. 2015; Wegert et al. 2015; Rivera et al. 2020). However, the diversity in patient demographics and variations in tissue cell composition makes it challenging to directly link these miRNA irregularities to mutations in the WiT-associated Microprocessor components. Additionally, biochemical research has shown that certain mutations can diminish the enzymatic efficiency of the Microprocessor when processing specific primary miRNAs (pri-miRNAs) (Rakheja et al. 2014). The impact of these mutations on the broader array of several hundred pri-miRNAs expressed in kidney tissues remains unclear. To address these challenges, our study developed the Microsensor system, a novel tool intended to facilitate the generation of Microprocessor mutants across various cell lines, enhancing our understanding of the Microprocessor's role in cellular functionality. This system enabled us to effectively introduce the E518K mutation, identified in WiT-MP, into the human kidney cell line HEK293T. In these mutant cells, in terms of pri-miRNA processing, our findings revealed that this mutation preferentially impacts the processing of a specific subset of pri-miRNAs that lack the RNA feature of 16–20 mismatches, resulting in a miRNA profile distinct from that of wild-type cells. These insights provide a deeper understanding of the cellular and molecular mechanisms affected by WiT-associated Microprocessor mutations, establishing a solid foundation for future studies aimed at further elucidating the pathogenesis of this disease and exploring potential therapeutic strategies.
RESULTS
Development and validation of the Microsensor system for monitoring Microprocessor activity in human cells
We developed the Microsensor system, a dual-fluorescence platform, to monitor the cleavage activity of the Microprocessor complex in human cells. This system includes a Microsensor plasmid that expresses ZsGreen mRNA and mCherry mRNA, the latter incorporating a pri-miRNA sequence in its 3′ UTR. Additionally, a helper plasmid produces the Tet-ON 3G transactivator protein. Activation of the Microsensor system by doxycycline initiates simultaneous expression of the mCherry and ZsGreen proteins. Cleavage of the pri-miRNA sequence by the Microprocessor reduces the stability and expression of mCherry mRNA, thereby allowing the mCherry/ZsGreen fluorescence intensity ratio to serve as an indicator of Microprocessor activity (Fig. 1A).
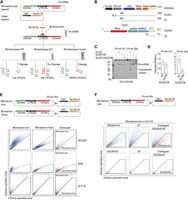
Development and validation of the Microsensor system for monitoring Microprocessor activity in human cells. (A) Construction of the Microsensor system. The Microsensor system includes the Microsensor and helper plasmids. Pri-miRNA is inserted into the mCherry 3′ UTR of the pTRE3G plasmid backbone, which is regulated by the bidirectional Tet-ON 3G promoter, activated by a doxycycline and Tet-ON 3G complex, enabling simultaneous expression of mCherry and ZsGreen. The CMV promoter governs the Tet-ON 3G in the helper plasmid. Microprocessor-mediated cleavage of pri-miRNA reduces mCherry expression relative to ZsGreen. (B) Protein domain mapping. The diagram highlights the protein domains of DROSHA and DGCR8, with specific amino acid positions noted. Key domains include P-rich (proline-rich domain), R/S-rich (arginine/serine-rich domain), CED (central domain), RIIIDa and RIIIDb (RNase III domains), dsRBD (double-stranded RNA binding domain), Rhed (RNA-binding heme domain), and CTT (C-terminal tail region). The nuclear localization sequence (NLS) is also marked. Notably, the E518 (glutamic acid at 518th position) residue mutation is located in dsRBD1 of DGCR8. (C) Pri-miRNA processing analysis. Assays performed to evaluate the processing of 5 pmol pri-miRNA by DROSHA (D3-G2, 8 pmol), NLSD3-D8 (3 pmol) and the NLSD3-D8-E518K (3 pmol). D8 is full-length DGCR8. (D) Quantitative assessment of cleavage efficiency. The efficiency of pri-miRNA cleavage was quantified as the ratio of cleaved products (pre-miRNAs) to the total pri-miRNA substrate, based on three replicate assays detailed in C. The final relative efficiency was normalized to DROSHA-only cleavage. (E) Verification of the Microsensor system across cell lines. The functionality of the Microsensor system, with (Microsensor-plus) and without (Microsensor-minus) pri-mir-30a, alongside helper plasmids, was tested in HEK293T, HCT116, and A549 cells. FACS analysis (BD FACSAria III) was used to detect mCherry and ZsGreen signals, with the plot percentages reflecting cells within specific areas. (F) Discriminative analysis of wild-type and Microprocessor-deficient cells using the Microsensor system. The ability of the Microsensor-plus system to distinguish between wild-type and Microprocessor knockout (MP-KO) cells is demonstrated. Transfections were performed in HCT116 wild-type, DROSHA-KO, and DGCR8-KO cells, with subsequent FACS analysis to measure mCherry and ZsGreen fluorescence.
To identify a suitable pri-miRNA for the Microsensor system, we assessed the cleavage efficiency of the Microprocessor complex, both wild-type and a mutant variant containing the E518K mutation in DGCR8, on pri-mir-16-1 and pri-mir-30a (Fig. 1B; Supplemental Fig. S1A,B). Our analysis revealed a more pronounced difference in cleavage efficiency between the wild-type and mutant complexes for pri-mir-30a compared to pri-mir-16-1 (Fig. 1C,D). Consequently, pri-mir-30a was selected for insertion into the 3′ UTR of the mCherry mRNA in the Microsensor-plus plasmid, facilitating more distinct differentiation between wild-type and mutant Microprocessor activities.
We validated the Microsensor system by transfecting HEK293T, A549, and HCT116 cell lines with either the Microsensor-plus plasmid (containing pri-mir-30a) or the Microsensor-minus plasmid (lacking pri-mir-30a), alongside a helper plasmid. Fluorescence-activated cell sorting (FACS) analysis revealed significantly lower mCherry expression in cells transfected with the Microsensor-plus plasmid compared to those transfected with the Microsensor-minus plasmid, confirming effective Microprocessor-dependent cleavage of pri-mir-30a (Fig. 1E). Similar experiments in HCT116 DROSHA-KO and DGCR8-KO cells showed no significant difference in mCherry expression between cells transfected with the Microsensor-plus and Microsensor-minus plasmids (Supplemental Fig. S1C), indicating that cleavage is Microprocessor-dependent. We also examined mCherry mRNA stability and found that mRNA from the Microsensor-plus plasmid degraded significantly faster than that from the Microsensor-minus plasmid, suggesting that the insertion of pri-miRNA into the 3′ UTR promotes mRNA decay dependently of the Microprocessor (Supplemental Fig. S1D). Similarly, a reduction in mCherry expression was observed in HEK293T and HepG2 cells transfected with the Microsensor-plus-pri-mir-16-1 plasmid compared to the Microsensor-minus plasmid (Supplemental Fig. S1E).
In further testing, we applied the Microsensor system to HCT116 cells, including DROSHA-KO and DGCR8-KO cells derived from the same lineage (Kim et al. 2016; Nguyen et al. 2018). The mCherry/ZsGreen fluorescence ratio was significantly lower in HCT116-WT cells compared to both DROSHA-KO and DGCR8-KO cells (Fig. 1F). This outcome validates that the Microsensor system can effectively differentiate between cells with an intact Microprocessor and those with compromised activity due to genetic knockouts. We observed similar results using the system with pri-mir-16-1 (Supplemental Fig. S1F). However, the use of pri-mir-30a within the Microsensor system yielded a clearer distinction between HCT116-WT and DROSHA-KO cells compared to pri-mir-16-1. Therefore, in subsequent experiments, we opted to continue with pri-mir-30a to exploit its superior discriminatory power.
These findings collectively underscore the Microsensor system's utility in monitoring Microprocessor activity and in identifying cells with Microprocessor knockouts or mutations, offering valuable insights for studies on Microprocessor function and the investigation of Microprocessor-related genetic alterations.
Application of the Microsensor system for selective enrichment of DGCR8 knockout cells via CRISPR-Cas9
We initially designed six sgRNAs targeting a specific region in exon 7 of the DGCR8 gene, which includes the E518 amino acid (Supplemental Fig. S2A). To determine the most effective sgRNAs for Cas9-mediated cleavage in this DNA region, we performed the T7E1 assay. Our results showed that sgRNAs P1, P5, N1, N2, and N4 demonstrated comparable cleavage activity (Supplemental Fig. S2B). Based on these findings, we selected sgRNAs P5 and N1 for the DGCR8-KO experiments.
We aimed to use the Microsensor system to facilitate the selection of DGCR8-KO cells following CRISPR-Cas9-mediated gene editing, as illustrated in Figure 2A. We transfected HEK293T cells with a combination of the Microsensor plasmid system, Cas9, and sgRNA plasmids. Two days post-transfection, which allowed time for CRISPR-Cas9 to induce mutations, we added doxycycline to activate the Microsensor system. The cells were cultured for an additional day before proceeding with FACS analysis. In this setup, we considered the entire cell population as “whole cells.” Initially, we sorted these cells based on ZsGreen fluorescence to identify those successfully transfected with the plasmids (transfected cells). Within this population of transfected cells, we hypothesized that the DGCR8-KO cells would exhibit a mCherry/ZsGreen ratio similar to that of wild-type (WT) cells transfected with the Microsensor-minus system. Therefore, we selected the region on the mCherry/ZsGreen plot corresponding to the Microsensor-minus sample as the potential DGCR8-KO cell population or “Microsensor cells.”
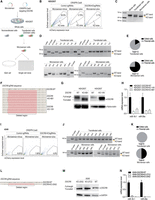
Application of the Microsensor system for selective enrichment of DGCR8 knockout cells via CRISPR-Cas9. (A) Workflow of DGCR8-KO experiments. HEK293T cells were transfected with a pair of KO sgRNAs, Cas9 plasmids, and the Microsensor system. Following transfection, the cells, referred to as “whole cells,” underwent FACS analysis. During FACS, cells emitting a ZsGreen signal were identified as “transfected cells,” and those with a high ZsGreen to mCherry ratio were categorized as “Microsensor cells.” Post-analysis, cells were either sorted collectively as bulk cells or individually as single cells, which were then cultured in separate wells for 2–3 weeks. (B) FACS results of DGCR8-KO experiments in HEK293T cells. The FACS analysis displayed ZsGreen levels on the y-axis and mCherry levels on the x-axis. Cells transfected with Microsensor-minus and control sgRNA were used as controls to define the fluorescence profile potentially indicative of successful DGCR8-KO in cells transfected with Microsensor-plus and DGCR8-KOsgRNAs. (C) PCR analysis of genomic DNA from DGCR8-KO experiments. The PCR analysis targeted genomic DNA from the cells involved in the DGCR8-KO experiments. The expected PCR product length for wild-type cells (WT-band) is 598 base pairs (bp), while the PCR product for DGCR8-KO cells (KO-band) is ∼551 bp. (D) Single-cell PCR analysis of genomic DNA from DGCR8-KO experiments. This analysis involves genomic DNA extracted from individual cells. The PCR results include a wild-type ladder showing DNA fragments of 598 bp and a knockout ladder displaying fragments of ∼551 bp. (E) Pie chart of edited cells. This pie chart illustrates the proportion of cells containing the KO-band, as identified from the PCR experiment described in D. (F) Sequencing analysis of DGCR8-KO cells. DNA regions containing mutations from DGCR8-KO cells (clones 6B1 and 1A5) were amplified via PCR and cloned into a TOPO-TA plasmid (Vayzme, C603-01) for Sanger sequencing. Each line represents one sequencing result from each TOPO-TA plasmid clone. Deletion regions are marked by dashed lines. (G) Western blot analysis. This analysis was performed on both DGCR8-KO and wild-type cells. The DGCR8 protein band in DGCR8-KO cells appeared slightly smaller than that in wild-type cells. (H) Quantification of miRNA expression. The expression levels of miR-16-5p and miR-30a-5p were quantified using qPCR in both WT and DGCR8-KO cells. The results were normalized to the expression level of U6 snRNA. (I) FACS results of DGCR8-KO experiments in A549 cells. FACS analysis plotted ZsGreen levels on the y-axis against mCherry levels on the x-axis. Cells transfected with Microsensor-minus and control sgRNA served as controls to identify potential regions of successfully edited DGCR8-KO cells from experiments using Microsensor-plus and DGCR8-KOsgRNAs. (J) Single-cell PCR analysis of genomic DNA from DGCR8-KO experiments in A549 cells. Genomic DNA was isolated from single cells in experiment in I and were amplified by PCR. The analysis included a wild-type ladder with DNA fragments of 598 bp and a knockout ladder with fragments of 551 bp. (K) Pie chart of edited cells. This pie chart displays the portion of cells that contained the KO-band from the PCR experiment in J. (L) Sequencing analysis of DGCR8-KO cells in A549. The mutated region of the DGCR8-KO 25A2 cells was PCR amplified and sequenced using Sanger sequencing. The deletion region is indicated by a dashed line. (M) Western blot analysis in A549 Cells. Western blotting was conducted on A549 DGCR8-KO cells (clones 25A2 and 27C2) and wild-type cells. The DGCR8 protein band in the DGCR8-KO cells appeared slightly smaller than in the wild-type cells. (N) miRNA expression quantification in A549 cells. The expression levels of miR-16-5p and miR-30a-5p were quantified by qPCR in both wild-type and DGCR8-KO cells, normalized to the expression level of U6 snRNA.
First, we identified the DGCR8-KO cell area by selecting the region on the mCherry/ZsGreen plots that encompassed the intact cell population transfected with the Microsensor-minus system, Cas9 plasmid, and a control sgRNA plasmid. Subsequently, we calculated the percentage of cells within this same area on the mCherry/ZsGreen plots for cells transfected with the Microsensor-plus system along with control sgRNAs and the Microsensor-plus system with DGCR8-KOsgRNAs (Fig. 2B). Interestingly, the percentage of cells in the designated area was significantly higher for the Microsensor-plus with DGCR8-KOsgRNAs (3.1%) compared to the Microsensor-plus with control sgRNAs (0.75%). In a separate experiment, we induced the expression of fluorescent proteins immediately on day 0 after transfecting the Microsensor system. A total of 3.6% of the cells exhibited knockout signals (Supplemental Fig. S2C), compared to 0.75% of cells showing knockout signals as observed in Figure 1B. These results align with previous findings (Heinz et al. 2011), which demonstrated that the Tet-On system effectively reduces background noise.
The potential DGCR8-KO cells from the experiments involving the Microsensor-plus with DGCR8-KOsgRNAs were sorted and collected either in bulk or as individual cells for subsequent genomic DNA analysis. To confirm the success of the DGCR8-KO, we performed PCR on the genomic DNA of the sorted cells in bulk. Cells successfully knocked out by the two sgRNAs would lack a DNA region of ∼47 base pairs (bp), resulting in a shortened PCR product of ∼551 bp (KO-band) compared to the 598 bp product of WT cells (WT-band) (Supplemental Fig. S2D). Figure 2C shows that the whole cell population predominantly contained WT-band. The “transfected cell” population exhibited a greater occurrence of the KO-band, suggesting a successful knockout by the CRISPR-Cas9 system. Intriguingly, within the Microsensor cell population, there was a much higher enrichment of the KO-band, indicating the effectiveness of the Microsensor system in selecting DGCR8-KO cells.
For the individual cells sorted by FACS, they were cultured for a couple of weeks before their genomic DNA was analyzed by PCR. In the “transfected cell” group, only two out of 12 cells contained the KO-band, whereas in the Microsensor group, nine out of 12 cells possessed the KO-band (Fig. 2D,E). These results demonstrate that the Microsensor system significantly enhances the selection of DGCR8-KO cells.
We selected the HEK293T DGCR8-KO-6B1 clone for further validation. Additionally, in a separate DGCR8-KO experiment using the Microsensor system equipped with pri-mir-16-1, we isolated another clone, HEK293T DGCR8-KO-1A5, which underwent the same validation experiments as DGCR8-KO-6B1. Sanger sequencing confirmed the expected deletion of the DNA region (Fig. 2F). Western blot analysis revealed a truncated DGCR8 protein in the DGCR8-KO cells (Fig. 2G). The Sanger sequencing analysis of DGCR8 mRNA from DGCR8-KO cells revealed a complete absence of exon 7, resulting in the skipping of this exon (Supplemental Fig. S2E–G). This resulted in a truncated DGCR8 protein missing 34 amino acids (Supplemental Fig. S2E–G). The qPCR results further demonstrated a significant reduction in the levels of miR-30a-5p and miR-16-5p, accompanied by a marked increase in the levels of pri-mir-30a and pri-mir-16-1 in the DGCR8-KO cells (Fig. 2H; Supplemental Fig. S2H).
Using the same sgRNA pair, we replicated the DGCR8-KO experiments in A549 cells. Similar to the results in HEK293T cells, the Microsensor system effectively facilitated the selection of DGCR8-KO cells via FACS (Fig. 2I–K). The DGCR8-KO cells from the A549 line were confirmed by genomic DNA Sanger sequencing (Fig. 2L), western blotting for protein expression (Fig. 2m), and miRNA expression analysis (Fig. 2n; Supplemental Fig. S2I). Consistent with the DGCR8-KO cells generated from HEK293T, the DGCR8-KO cells from A549 (clones 25A2 and 27C2) expressed truncated DGCR8 fragments (Fig. 2m), and the RT-PCR results indicated exon 7 skipping (Supplemental Fig. S2J).
Utilizing the Microsensor system for enrichment of DROSHA-KO cells in CRISPR-Cas9 experiments
We conducted KO experiments targeting DROSHA using the CRISPR-Cas9 system and used the Microsensor technique to isolate KO cells. Specifically, we targeted exon 29 of DROSHA, which contains the E1147K mutation hotspot associated with Wilms tumor. Initially, we designed several sgRNAs and evaluated their knockdown efficiency by determining the percentage of knockout (KO) cells caused by each sgRNA, as described in Figure 2B. We identified sgDE2, sgDE3, and sgDE6 as having strong KO efficiency and selected them for subsequent knockout experiments (Supplemental Fig. S3A,B). Subsequently, we conducted a similar KO experiment as described for DGCR8 (Fig. 2). Using the high-efficiency sgRNA pair (sgDE3 and sgDE6), (Supplemental Fig. S3C), the Microsensor system successfully identified a subset of potential DROSHA-KO cells, constituting 2.7% of the CRISPR-Cas9-treated group, compared to only 0.5% in the control group without DROSHA-KOsgRNAs (Fig. 3A). Genomic PCR was performed to differentiate between WT-band and KO-band across all experimental cells, including those transfected and those serving as Microsensor cells. As illustrated in Figure 3B, the Microsensor cells displayed a significantly higher proportion of KO-band relative to WT-band compared with both the transfected cells and the whole cell population. This result suggests that the Microsensor technique effectively enriched for DROSHA-KO cells following FACS analysis.
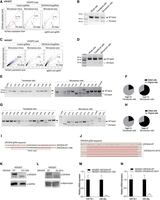
Using the Microsensor system for enrichment of DROSHA-KO cells in CRISPR-Cas9 experiments. (A,C) FACS results of DROSHA-KO experiments in HEK293T cells, using pairs of sgRNA, sgDE3 and sgDE6 in A, and sgDE2 and sgDE7 in C. FACS analysis was performed. It displayed ZsGreen levels on the y-axis and mCherry levels on the x-axis. Cells transfected with Microsensor-minus and control sgRNA served as controls to outline the fluorescence profile potentially indicative of successful DROSHA-KO in cells transfected with Microsensor-plus and DROSHA-KOsgRNAs. (B,D) PCR analysis of genomic DNA from DROSHA-KO experiments. The PCR targeted genomic DNA from cells involved in the DROSHA-KO experiments (A,C). For the sgDE3 and sgDE6 pairs, the expected PCR product size for wild-type cells is 616 bp, while for DROSHA-KO cells, it is ∼458 bp. For sgDE2 and sgDE7 pairs, the wild-type size is 269 bp, while the KO size is ∼189 bp. (E,G) Single-cell PCR analysis of genomic DNA from DROSHA-KO experiments. This analysis involves genomic DNA extracted from individual cells. PCR amplification of this DNA showed a wild-type ladder with DNA fragments of 616 bp. (F,H) Pie chart of edited cells. These pie charts illustrate the proportion of cells containing the KO-band, as identified from the PCR experiments described in E and G. (I,J) Sequencing analysis of DROSHA-KO cells. DNA regions containing mutations from DROSHA-KO cells (clones 13A6 in I and 35-1H in J) were amplified via PCR. The amplified DNA was either sequenced directly by Sanger sequencing (in I) or cloned into a TOPO-TA plasmid for further Sanger sequencing (in J). Each line represents one sequencing result from each TOPO-TA plasmid clone. Deletion regions are marked by dashed lines. (K,L) Western blot analysis performed on DROSHA-KO cells (13A6 in K and 35-1H in L) and wild-type cells, this analysis aimed to detect differences in protein expression. (M,N) Quantification of miRNA expression. The expression levels of miR-16-5p and miR-30a-5p were quantified using qPCR in both wild-type and DROSHA-KO cells (13A6 in M and 35-1H in N). Results were normalized to the expression level of U6 snRNA.
To further evaluate the capability of the Microsensor to identify DROSHA-KO cells using FACS, even with sgRNA pairs demonstrating relatively low cleavage efficiency, we conducted experiments using sgDE2 and sgDE7, predicted to have low KO efficiency. These sgRNAs showed weaker cleavage efficiency compared to the previously used pair (Supplemental Fig. S3D). Despite this lower efficiency, the Microsensor was still able to detect potential DROSHA-KO cells within the KO experiments (2.7%) compared to the control experiments (0.7%) (Fig. 3C). Subsequent genomic PCR analysis did not reveal any detectable KO-band either in the whole cell population or in the transfected cells, which reflected the low cleavage activity of this sgRNA pair. However, within the Microsensor-enriched cell population, we identified KO-band at a low density. This finding underscores the proficiency of the Microsensor system in enriching for DROSHA-KO cells, even when using sgRNAs with suboptimal cleavage efficiency (Fig. 3D).
Further analysis was performed on individual cells isolated by FACS to compare between transfected cells and Microsensor cells across two different knockout experiments using distinct sgRNA pairs. In the Microsensor cell groups, there was a higher incidence of cells harboring KO-band DNA compared to the transfected cell group (Fig. 3E–H). Specifically, in the first knockout experiment, among nine analyzed Microsensor cells, six contained the KO-band: five of these harbored both KO-band and WT-band, and one cell, clone 13A6, exclusively exhibited the KO-band (Fig. 3E,F). In contrast, among 10 analyzed transfected cells, only two contained both KO-band and WT-band (Fig. 3E,F). In the second knockout experiment, among 10 analyzed Microsensor cells, seven contained the KO-band, with six of these harboring both KO-band and WT-band, and one cell, clone 351H, exclusively exhibiting the KO-band (Fig. 3G,H). In contrast, among 14 analyzed transfected cells, only three had both KO-band and WT-band (Fig. 3E,F). This analysis highlights the Microsensor system's effectiveness in enriching for cells with successful gene KO, even when the general efficiency of the sgRNA pairs is relatively low.
Subsequent Sanger sequencing of the KO-band, amplified from genomic DNA isolated from clones 13A6 and 35-1H, confirmed the expected deletion within the DROSHA gene locus (Fig. 3I,J). Clone 13A6 completely lost exon 29, while clone 35-1H partially lost this exon. We then isolated total RNA from each clone (13A6 and 35-1H) and conducted RT-PCR to examine the mRNA sequence of DROSHA. The results showed that DROSHA mRNA from clone 13A6 completely lacked exon 29, whereas DROSHA mRNA from clone 35-1H retained a partial sequence of exon 29 (Supplemental Fig. S3E,F). Additionally, we performed qPCR for DROSHA mRNA and found that the DROSHA mRNA levels in these two mutant clones were lower than those in WT cells, suggesting that the complete or partial loss of exon 29 may cause instability of DROSHA mRNA (Supplemental Fig. S3G). Additionally, western blot analysis demonstrated the absence of the DROSHA protein in DROSHA-KO cells (Fig. 3K,L), supporting the knockout's effectiveness at the protein level. Further validation was provided by miRNA analysis using qPCR, which revealed a significant reduction in the levels of miR-16-5p and miR-30a-5p, alongside an upregulation of pri-mir-16-1 and pri-mir-30a in the knockout cells compared to the parental cells (Fig. 3m,N; Supplemental Fig. S3H). These findings collectively confirm the successful knockout of the DROSHA gene, impacting both the primary and mature miRNA profiles.
Using Microsensor-assisted CRISPR-Cas9 editing for precise DGCR8 mutation
We have developed a two-step knockout/knockin (KO/KI) strategy to create Microprocessor mutant cell lines. Initially, sgRNA-mediated deletion targets the mutation-containing DNA region, with KO cells being isolated using the Microsensor, as depicted in Figure 4A. In the subsequent step, a donor DNA containing the desired mutations is introduced into the excised region of these cells, with mutant cells again selected via the Microsensor. This dual sgRNA approach facilitates the excision of the targeted DNA region, thereby simplifying the selection of KO cells through the identification of shorter genomic DNA (gDNA) PCR bands. It also establishes a unique sequence at the KO site, allowing for the design of new sgRNAs that specifically target this locus without affecting the donor DNA during the KI step (Fig. 4B). This two-step gene-editing method enhances the efficiency of creating mutant cells compared to a single KI step. The Microsensor effectively differentiates wild-type from KO cells in the initial step and KO from mutant cells in the subsequent step, owing to the differential cleavage of pri-mir-30a. This strategy not only accelerates the generation of mutants but also provides a diverse pool of KO cells for further experimental analysis.
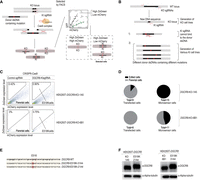
Using Microsensor-assisted CRISPR-Cas9 editing for precise DGCR8 mutation. (A) Workflow for generating DGCR8 mutant cells. The DGCR8-KO cells, which had a specific DNA region deleted containing the mutation of interest, were transfected with KI (knockin) sgRNA, Cas9 plasmids, and the Microsensor system, along with donor dsDNA harboring a mutation site. FACS was used to first select transfected cells based on the ZsGreen signal and then to identify potential mutant cells showing a high ZsGreen to mCherry ratio, which indicated DGCR8-KI cells. The cells were sorted individually and cultured in wells for 2–3 weeks for further analysis. (B) Advantages of generating mutant DGCR8 cells using a two-step approach. The KO cells generate a new DNA sequence at the mutation site, distinct from that of wild-type cells, allowing for the specific design of KI sgRNA that targets only this genomic DNA, and not the donor DNAs in knock-in experiments. The KO step produces various KO cells, serving as a platform that can be targeted by any donor DNA containing different mutations. (C) FACS results of DGCR8-KI experiments. The KI experiments conducted on two different DGCR8-KO cells, 1A5 and 6B1. The FACS analysis of the DGCR8-KI cells displayed the ZsGreen level on the y-axis and the mCherry level on the x-axis. The marked area highlighted the cells potentially modified through the KI experiments, showing a high ratio of ZsGreen to mCherry. (D) Pie chart of edited cells. These pie charts illustrate the proportion of cells containing the KI-band, as identified from the PCR experiments described in Materials and Methods. (E) Sequencing analysis of DGCR8-KI cells. DNA regions harboring mutations from DGCR8-KI cells (clones 21A4 and 31A4) were amplified via PCR, and the amplified DNA was sequenced directly using Sanger sequencing. The mutated nucleotides are highlighted. (F) Western blot analysis. This analysis was performed on DGCR8-KO cells (1A5 and 6B1) and DGCR8-KI cells (21A4 and 31A4).
To introduce the E518K mutation into the DGCR8 gene, we used CRISPR-Cas9-mediated KI techniques on DGCR8-KO cell lines, specifically DGCR8-KO-1A5 and DGCR8-KO-6B1, conducted in parallel experiments. The DGCR8-KIsgRNA was strategically designed to target only the DGCR8-KO allele, avoiding the DGCR8-WT locus. The experimental setup involved transfecting the cells with a combination of DGCR8-KIsgRNA plasmid, Cas9 plasmid, Microsensor system plasmids, and the E518K double-stranded DNA (dsDNA) donor molecule. Following transfection, the cells were cultured for 2 days and then treated with doxycycline to induce expression. The selection process involved two stages of FACS to enrich for cells with potential DGCR8-E518K cells. Initially, cells expressing ZsGreen were isolated, representing the successfully transfected cell population. Subsequent sorting focused on the potential DGCR8-E518K cells, identified as Microsensor cells, based on the mCherry/ZsGreen fluorescence ratio, as illustrated in Figure 4C.
Single cells from both the transfected and Microsensor-selected populations were then cultured for 3–4 weeks. PCR analysis of the genomic DNA from these cells aimed to confirm the KI, with expected DNA band patterns similar to those of WT cells. In the DGCR8-KO-1A5 experiments, all 15 analyzed Microsensor cells contained KI-DNA bands; two exclusively had KI-DNA bands, while 13 displayed both KI-DNA and KO-DNA bands. Conversely, among the transfected cells, eight out of nine showed only KO-DNA bands, with one cell presenting a mix of both KI-DNA and KO-DNA bands (Fig. 4D; Supplemental Fig. S4A). Parallel experiments using the HEK293T DGCR8-KO-6B1 cell line yielded comparable outcomes. Of the 11 Microsensor-analyzed cells, five had KI-DNA bands; one exclusively displayed KI-DNA bands, and four had both KI-DNA and KO-DNA bands. In contrast, all eight transfected cells contained only KO-DNA bands, with none showing a combination of KI-DNA and KO-DNA bands (Fig. 4D; Supplemental Fig. S4B). These results underscore the efficacy and specificity of our two-step CRISPR-Cas9 gene-editing approach for precise genetic modifications in targeted cell lines.
The genomic DNA of the fully KI cell lines DGCR8-E518K-31A4 and DGCR8-E518K-21A4 was validated using Sanger sequencing, as shown in Figure 4E. Western blot analysis further confirmed the expression of the DGCR8-E518K mutant protein. Notably, the molecular weight of the DGCR8-E518K mutant protein was higher than that of the truncated DGCR8 observed in the DGCR8-KO cells, as depicted in Figure 4F.
To validate the utility of the Microsensor system in generating DGCR8-E518K mutant cell lines, we transfected the Microsensor system into two different DGCR8-E518K mutant cell isolates (21A4 and 31A4). We observed that WT cells transfected with the Microsensor-plus and Microsensor-minus were separated much more effectively than mutant cells. Furthermore, the Microsensor-plus system provided better separation between WT and mutant cells compared to the Microsensor-minus system (Supplemental Fig. S4C,D). These results confirm the validity of the Microsensor system for selecting mutant cells. Subsequently, we performed qPCR to quantify the levels of pri-miR-16-1 and pri-miR-30a in both WT and DGCR8-E518K mutant cells. The results indicated that the expression levels of both pri-miRNAs were higher in mutant cells compared to WT cells. Notably, pri-miR-30a levels in mutant cells were upregulated to a greater extent than pri-miR-16-1 (Supplemental Fig. S4E). This suggests that the processing of pri-miR-30a is more significantly affected by the DGCR8-E518K mutation than pri-miR-16-1, consistent with the in vitro cleavage assay results shown in Figure 1C.
Differential impact of DGCR8-E518K mutation on miRNA expression
We measured the expression levels of miR-16-5p and miR-30a-5p in HEK293T cells, DGCR8-KO (1A5), and DGCR8-E518K-21A4 and 31A4 mutant cells. The results, which are consistent with our cleavage activity data shown in Figure 1D, revealed that miR-16-5p levels were mildly reduced, while miR-30a-5p levels were significantly reduced in mutant cells compared to WT cells (Fig. 5A). This suggests that the E518K mutation in DGCR8 might cause differential miRNA expression. Extending our analysis through miRNA sequencing (miRNA-seq) of the DGCR8-E518K-21A4 cells, we discovered that the E518K mutation broadly reduced miRNA expression (Fig. 5B, left panel). Furthermore, we showed that the impact of DGCR8-E518K on the expression of both 5p and 3p miRNAs was strongly correlated (Pearson's r = 0.8) for pri-miRNAs with detectable 5p and 3p miRNAs in small RNA-sequencing (Supplemental Fig. S5A).
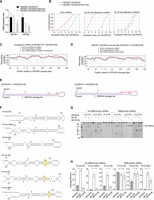
Differential impact of DGCR8-E518K mutation on miRNA expression. (A) Quantitative PCR analysis of miRNA expression. Comparison of miR-16-5p and miR-30a-5p expression levels between DGCR8-E518K mutant and wild-type cells. miRNA expression was normalized against U6 expression. (B) miRNA profile analysis in DGCR8-E518K mutant and wild-type cells. The left panel displays the cumulative fraction of miRNA expression profiles for both DGCR8-WT and DGCR8-E518K cells. The middle and right panels highlight the top 30 most affected and least affected primary miRNAs (pri-miRNAs) by DGCR8-E518K, selected based on the differential expression levels (Δ values) relative to DGCR8-WT. (C) Base-pairing probabilities in the top 30 most affected and least affected primary miRNAs (pri-miRNAs) by DGCR8-E518K from B. Analysis of the base-pairing probabilities across the 5p-strand of pri-miRNAs. RNA structures were predicted using RNAfold, and each nucleotide's base-pairing status was determined from the predicted structure. The positions of the nucleotides are marked on the x-axis in relation to the DROSHA cleavage sites. (D) Base-pairing probabilities of the top 30 most affected and least affected primary miRNAs (pri-miRNAs) by DGCR8-E518K were analyzed using data from the rescue experiments. HEK293T DGCR8-KO cells were rescued with either DGCR8-WT or DGCR8-E518K, and small RNAs were analyzed as described in B and C. (E) Impact of DGCR8-E518K mutation on pri-miRNA groups. The model differentiates between two groups of pri-miRNAs: non16BM-pri-miRNAs and 16BM-pri-miRNAs. DGCR8-E518K cells exhibited a differential impact on the miRNA expression from these two groups compared to wild-type cells. 16BM indicates bulges or mismatches at positions +16 to +20. (F) Structures and sequences of pri-miRNAs. Depiction of pri-miRNA structures and sequences, with DROSHA cleavage sites indicated by green arrowheads. Yellow boxes highlight bulges or mismatches at positions +16 to +20, termed 16BM. The fragments F1, F2 (pre-miRNA), and F3 are generated through Microprocessor cleavages. (G) In vitro cleavage of pri-miRNAs. Each pri-miRNA, with or without 16BM, was incubated with 8 pmol of DROSHA or 3 pmol of Microprocessor complex protein at 37°C for 120 min using a 5 pmol aliquot of each pri-miRNA. (MP) Microprocessor. (H) Cleavage efficiency analysis. Cleavage efficiency of the enzymes from three separate experiments was calculated and represented in bar charts.
We selected the 30 most downregulated and the 30 least downregulated miRNAs in DGCR8-E518K-21A4 cells for further analysis (Fig. 5B, middle and right panels). Using RNAfold, we analyzed the structures of the pri-miRNAs in these groups and examined the base-pairing status at different positions within the pri-miRNAs (Fig. 5C). We found that pri-miRNAs with bulges or mismatches at positions +16 to +20 relative to the DROSHA cleavage sites (referred to as 16BM-pri-miRNAs) were less affected by the E518K mutation. In contrast, pri-miRNAs without these structural irregularities (non16BM-pri-miRNAs) were more significantly impacted (Fig. 5C). In parallel, we rescued HEK293T DGCR8-KO cells by expressing either DGCR8-WT or DGCR8-E518K and performed small RNA-sequencing. The results, shown in Figure 5D, were consistent with those in Figure 5C. These findings suggest that DGCR8-WT and DGCR8-E518K exhibit differential effects on miRNAs derived from pri-miRNAs lacking 16BM (Fig. 5E).
We next selected three pri-miRNAs containing 16BM and three without 16BM, and conducted pri-miRNA processing assays using the Microprocessor (Fig. 5F). Our in vitro cleavage assays further substantiated the influence of the E518K mutation on pri-miRNA processing, demonstrating a greater reduction in cleavage efficiency for non16BM-pri-miRNAs compared to 16BM-pri-miRNAs (Fig. 5G,H; Supplemental Fig. S5B). We then added the 16BM to pri-mir-196a-2 and pri-mir-30e and observed that the Microprocessor, containing either DGCR8-WT or DGCR8-E518K, cleaved these 16BM-modified pri-miRNAs more similarly than the original non16BM-pri-miRNAs (Supplemental Fig. S5C,D). Conversely, when we removed the 16BM from pri-mir-342 and pri-mir-29b-1, we found that the Microprocessor with DGCR8-WT or DGCR8-E518K cleaved the non-16BM versions of pri-mir-342 and pri-mir-29b-1 differently (Supplemental Fig. S5E,F).
We constructed Microsensor plasmids containing pri-miR-29b-1-non16BM, pri-miR-29b-1-16BM, pri-miR-196a-2-non16BM, and pri-miR-196a-2-16BM and tested their activity in HEK293T DGCR8-WT and HEK293T DGCR8-E518K cells. We observed that the Microsensor plasmids with pri-miR-29b-1-non16BM or pri-miR-196a-2-non16BM effectively distinguished between HEK293T DGCR8-WT and HEK293T DGCR8-E518K, whereas those with pri-miR-29b-1-16BM or pri-miR-196a-2-16BM did not. This is consistent with the in vitro cleavage assay, which showed that the 16BM eliminated the differences between DGCR8-WT and DGCR8-E518K (Supplemental Fig. S5G).
Overall, our findings suggest that mutations in the Microprocessor complex, such as those observed in WiT, can selectively affect miRNA maturation.
Assessing the effects of DGCR8-E518K mutation on cell cycle, migration, and cell death
Further investigation into cell cycle dynamics revealed an increase in the G0/G1 phase population in DGCR8-KO cells compared to WT cells. Cells with the DGCR8-E518K mutation showed an intermediate G0/G1 phase population between WT and DGCR8-KO cells (Fig. 6A,B; Supplemental Fig. S6A). These observations align with previous studies in mouse embryonic fibroblast (MEF) cells, where DGCR8-KO cells rescued with either DGCR8-WT or DGCR8-E518K also displayed an elevated G0/G1 phase population (Vardapour et al. 2022).
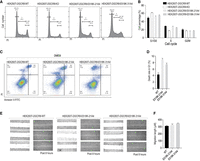
Assessing the effects of DGCR8-E518K mutation on cell cycle, migration, and cell death. (A) Cell cycle analysis in DGCR8-E518K and wild-type cells. DGCR8-E518K cells showed a slightly higher percentage of cells in the G0–G1 phase compared to DGCR8-WT cells, but fewer than DGCR8-KO cells. The distribution of cells at different stages of the cell cycle was determined using FACS. (B) Quantitative cell cycle analysis. This analysis includes data from three repeated experiments that assessed the cell cycle stages as described in A. (C) FACS analysis of cell death in DMEM medium. Representative dot plots demonstrate Annexin-V-FITC/PI staining of DGCR8-WT and DGCR8-E518K cells cultured in DMEM medium, as acquired via flow cytometry. The Q1 section indicates cell death. (D) Quantitative analysis of cell death. This analysis incorporates data from three independent experiments that assessed cell death in the Q1 section of the plot, as performed in C. (E) Wound healing assay to evaluate migration ability. A wound was introduced into dishes culturing different cells, and images were captured at the start and after 8 h. This experiment was repeated three times. (F) Measurement of wound length. The length of the wound in three repeated experiments conducted in E was measured and plotted in a bar chart.
Next, we examined cell death in the DGCR8-E518K mutant cells using the Annexin V-FITC apoptosis assay. Cell death status was analyzed by FACS and presented in the PI/Annexin V-FITC scatter plot. Cells in the Q2 and Q3 sections represent apoptosis cell, while cells in Q1 indicate cell death caused by other mechanisms. Our findings revealed that nonapoptotic cell death (in Q1) was more prevalent in DGCR8-E518K mutant cells compared to WT cells when cultured in DMEM (Fig. 6C,D). In cell migration assays, such as the wound healing test, DGCR8-E518K mutant cells migrated slightly faster than wild-type cells (Fig. 6E,F).
DISCUSSION
In this study, the Microsensor system has demonstrated remarkable effectiveness in distinguishing between Microprocessor-KO and WT cells, as well as differentiating mutant cells from Microprocessor-KO cells across various cell lines. This platform is robust, enabling the introduction of Microprocessor mutations into different cell types. These mutations are relevant to both Wilms tumor and other cellular contexts, facilitating dynamic evaluation of Microprocessor functions in various cellular environments. In our Microsensor system, we use an inducible promoter to control the expression of fluorescent proteins after transfection. This induction method is essential because proteins from the DROSHA or DGCR8 genes, present before the knockout, can persist in cells and potentially bias the results. The induction method delays the expression of fluorescent proteins after editing, ensuring that any detected effects are attributable to the knockout, rather than to residual protein activity. Nonetheless, the system could benefit from further enhancements to boost its sensitivity and specificity in identifying subtle variations in Microprocessor activity. Future improvements might involve incorporating advanced CRISPR/Cas9 technologies or additional fluorescent markers to refine the accuracy of mutation detection and analysis.
The KO/KI technique, although time-intensive due to requiring two editing steps, offers substantial advantages. KO cells are invaluable for introducing specific mutations within the targeted gene region, meaning that the generated KO cells can serve as a platform to introduce any mutation in the deletion region with a single KI step. Additionally, this approach allows for the creation of unique sgRNAs that avoid targeting DNA donors, thus minimizing the risk of off-target edits. The Microsensor system facilitates the selection of knockin cells from a KO background by enabling rapid PCR verification, where distinct product lengths differentiate KO from KI cells.
Using the Microsensor system to facilitate the generation of Microprocessor mutant cells at the native loci of genes like DGCR8 or DROSHA provides a more accurate comparison of miRNA and mRNA profiles than using cancer cells from patients, which often vary widely in genetic background and age. Furthermore, creating mutants directly at the gene locus is crucial for accurately assessing cellular phenotypes, as opposed to KO and rescue experiments, which can lead to overexpression of target genes and result in variability due to differences in transfection efficiency. Using a lentivirus to establish stable expression of DGCR8 mutants in DGCR8-KO cells can help minimize the impact of transfection variability. However, this approach carries the risk that mutant proteins may be overexpressed and that the inserted gene could integrate at various loci, potentially leading to different transcriptional regulation compared to the wild-type gene. This could affect the interpretation of the mutant's biological function.
In this study, we used the Microsensor system to generate mutant HEK293T cells harboring the DGCR8-E518K mutation to investigate its impact on miRNA biogenesis. We discovered that this mutation significantly affects pri-miRNA processing differently across two distinct groups of pri-miRNAs, those containing bulges and mismatches at positions 16–20 from the DROSHA cleavage sites and those without. Consequently, this mutation differentially affects miRNA expression in mutant cells. The E518 residue is located in the dsRBD1 domain of DGCR8, and its alteration to K518 potentially disrupts the binding interaction between RNA and DGCR8, thereby impairing normal miRNA processing. Future structural studies are crucial to elucidate the precise molecular mechanisms by which this and other mutations impair DGCR8 function. High-resolution techniques such as cryo-electron microscopy (cryo-EM) or X-ray crystallography could provide detailed insights into these interactions.
MATERIALS AND METHODS
sgRNA plasmid and Cas9 plasmid construction
The sgRNA sequences were designed with the help of the sgRNA design software, Benchling (Biology Software). The specific sequences of sgRNAs utilized in this study can be found in Supplemental Table 1. The following text describes the construction process of the sgRNA plasmids. Initially, the pU6-sgEMPTY plasmid was constructed, which contains the sgRNA scaffold under the control of the U6 promoter. This was followed by the insertion of the spacer sequence for each sgRNA into the pU6-sgEMPTY plasmid, resulting in the creation of the individual sgRNA plasmids. The pSpCas9 (BB)-2A-GFP (PX458) was generously provided by Feng Zhang (RRID: Addgene_48138). The EGFP segment was excised using overlap PCR, resulting in the construction of the pX458-noEGFP plasmid.
Construction of pU6-sgEMPTY
The plasmid pU6-Sp-pegRNA-HEK3_CTT_ins was kindly provided by David Liu (Addgene plasmid 132778; RRID: Addgene_132778). To construct the pU6-sgEMPTY, dsDNA-peg-BsmBI-HindIII, which contains the BsmBI site and an sgRNA scaffold, was PCR from the pU6-Sp-pegRNA-HEK3_CTT_ins backbone, using F-U6-BsmBI-scaffold and R-HindIII primers. The U6 promoter was amplified from an pU6-Sp-pegRNA-HEK3_CTT_ins plasmid using primers F-BamHI-U6 and R-U6. The PCR-amplified U6 promoter was mixed with the dsDNA-peg-BsmBI-HindIII for an overlap PCR reaction, using primers F-BamHI-U6 and R-HindIII. This reaction produced a DNA fragment flanked by BamHI and HindIII restriction sites. The overlap PCR product was then digested with BamHI and HindIII enzymes and cloned into the similarly digested pU6-Sp-pegRNA-HEK3_CTT_ins plasmid. The resulting construct, named pU6-sgEMPTY, was prepared for the introduction of specific sgRNA spacer sequences. The oligonucleotides used in this section can be found in Supplemental Table 1.
Insertion of spacer sequences
To insert a spacer sequence into the pU6-sgEMPTY plasmid, the plasmid was first linearized using BsmBI and purified by gel electrophoresis. Two ssDNA oligonucleotides containing the spacer sequences were annealed, generating double-stranded DNA (dsDNA) with sticky ends compatible with BsmBI. Details of these spacer sequences are shown in Supplemental Table 1. The dsDNA was then ligated into the linearized pU6-sgEMPTY vector using T4 DNA ligase. This procedure successfully produced a plasmid harboring the specific sgRNA sequence. Supplemental Table 1 lists the oligos used in this section.
Microsensor plasmid construction
The pTRE3G-Bi-α-chain plasmid, initially developed by Erin Schuman's laboratory, is catalogued under Addgene plasmid 133730 (available at http://n2t.net/addgene:133730; RRID: Addgene_133730). This vector incorporates a bidirectional TRE3G BI promoter that regulates the expression of both ZsGreen1, a green fluorescent protein, and the α-Chain.
The mCherry sequence was amplified using specific primers (F-BglII-mCherry and R-NotI-mCherry) and was subsequently digested with BglII and NotI enzymes. Similarly, the pTRE3G-Bi-α-chain plasmid was also digested with BglII and NotI to excise the α-chain. The digested mCherry sequence and the modified pTRE3G-Bi-α-chain plasmid were then ligated together to create the Microsensor-minus plasmid.
Following this, the pri-mir-30a sequence was PCR-amplified from HEK293T genomic DNA using the primers F-MicroNotI-pri30a and R-MicroEcoRV-pri30a, which introduced NotI and EcoRV restriction sites at the ends of the product. The double-stranded DNA (dsDNA) containing the pri-mir-30a sequence was then cloned downstream from the mCherry coding sequence in the Microsensor-minus plasmid using the NotI and EcoRV sites. The resulting construct, now termed the Microsensor-pri-mir-30a plasmid or Microsensor-plus plasmid, allows for the inducible coexpression of mCherry and pri-mir-30a under the TRE3G BI promoter.
A similar approach was used to construct the Microsensor-pri-mir-16-1 plasmid. Specific primers (F-MicroNotI-pri16-1 and R-MicroEcoRV-pri16-1) were used to amplify the pri-mir-16-1 sequence.
For Microsensor with miRNA target. The sense and antisense sequence of miRNA targets were synthesized from BGI and annealed to generate the NotI and EcoRV site. Then the annealed fragments were cloned into the Microsensor vector using NotI and EcoRV sites.
For the oligos used in this section, refer to Supplemental Table 2.
Donor DNA construction
This section describes the procedure for preparing donor DNA for DGCR8. The WT DGCR8 donor DNA (donor DNA-DGCR8-WT), which is ∼600 base pairs (bp) in length and includes 300 bp homology-directed repair (HDR) arms on each end, was synthesized by PCR amplification of genomic DNA (gDNA) from HEK293T cells using primers T7EI-F-DGCR8 and T7EI-R-DGCR8.
For the mutant DGCR8 donor DNA (donor DNA-DGCR8-E518K), two separate PCR amplifications were conducted. The first PCR used the primers T7EI-F-DGCR8 and T7EI-R-DGCR8-E518K to generate the left arm of the mutant donor DNA (mut-donor-DNA-L). Simultaneously, the second PCR used the primers T7EI-F-DGCR8-E518K and T7EI-R-DGCR8 to generate the right arm (mut-donor-DNA-R). These two PCR products were then combined using an overlap PCR technique, using the same primers T7EI-F-DGCR8 and T7EI-R-DGCR8 to facilitate the fusion, thus producing the complete mutant DGCR8 donor DNA (donor DNA-DGCR8-E518K).
Details of the oligos used in this section are provided in Supplemental Table 2.
In vitro pri-miRNA processing assays
Recombinant proteins’ purification
We purified multiple versions of the Microprocessor complex, including D3-G2 and NLSD3-DGCR8-WT or NLSD3-DGCR8-E518K, following the procedures outlined in previous studies (Le et al. 2023; Nguyen et al. 2023a). Briefly, we transfected sixty 100 mm dishes of HEK293E cells with pXab-D3 and pXG-G2 (NLSD3-DGCR8-WT or NLSD3-DGCR8-E518K). After 60 h, the transfected cells were harvested, and the cell pellet was resuspended in lysis buffer (20 mM Tris-HCl pH 7.5, 500 mM NaCl, 2 μg/mL RNaseA, 4 mM β-mercaptoethanol, and one protease inhibitor tablet). The lysate was incubated with Ni-NTA resin at 4°C for 15 min. Following incubation, the resin was washed with a washing solution (20 mM Tris-HCl pH 7.5, 500 mM NaCl, 4 mM β-mercaptoethanol, and 20 mM imidazole) at varying NaCl concentrations (T500, T1000, and T100). The proteins were then eluted with T100 containing 200 mM imidazole. The eluted fractions containing the target proteins were further purified using an Unosphere Q ion-exchange resin (Bio-Rad), washed, and finally eluted with T500, 10% glycerol, and 2 mM dithiothreitol (DTT) (Sigma-Aldrich). The purified proteins were aliquoted and stored at −80°C for future use.
Pri-miRNA substrate synthesis
Each double-stranded DNA (dsDNA) sequence of pri-miRNA, featuring a T7 promoter at the 5′ end followed by a pri-miRNA sequence from MirGeneDB (Fromm et al. 2020), was synthesized via PCR using primer pairs and either genomic DNA or a pri-miRNA plasmid as templates. Approximately 200 ng of each dsDNA was used as a template for in vitro transcription (IVT) utilizing the MEGAscript T7 transcription kit. The resulting RNAs were purified and quantified. This section's oligos are detailed in Supplemental Table 3.
In vitro pri-miRNA processing assays
For the assays, 5 pmol of RNA substrate was mixed with varying amounts of protein and incubated at 37°C for 2 h in a reaction buffer (50 mM Tris-HCl, 150 mM NaCl, 10% glycerol, 1 mM DTT, and 2 mM MgCl2). After the incubation, 10 μL of 2× TBE-urea buffer was added, and the mixture was further incubated for 15 min at 37°C, followed by 15 min at 50°C, and finally 5 min at 95°C. The samples were then loaded onto a 12% urea-polyacrylamide gel for electrophoresis. Post-electrophoresis, the gel was stained with SYBR and imaged using the Bio-Rad Gel Doc XR+ system. The details of the quantitative analysis for the pri-miRNA processing assays are provided in Supplemental Table 4.
mRNA and miRNA qPCR analysis
For mRNA quantification, 2 µg of total RNA was used in the reverse transcription (RT) step with oligodT primers, random hexamers, and SuperScript IV Reverse Transcriptase (Invitrogen 18080-093). For miRNA quantification, 500 ng of total RNA was used with specific stem–loop RT primers designed for each miRNA, and cDNA was synthesized using SuperScript IV Reverse Transcriptase. The resulting cDNAs from both mRNA and miRNA RT reactions were used as templates in a 10 µL qPCR reaction using iTaq Universal SYBR Green Supermix (Bio-Rad 1725122) with specific primers. GAPDH and U6 were used as internal controls for mRNA and miRNA quantification, respectively. Supplemental Table 5 provides detailed information on the RT and qPCR primers. Detailed quantitative analysis of both miRNA and pri-miRNA qPCR assays can be found in Supplemental Table 5.
Cell culture
HEK293E cells (female) were maintained in DMEM (Gibco) supplemented with 5% fetal bovine serum (Gibco) and 20 μg/mL G418 (Gibco) at 37°C with 5% CO2. HCT116 (male), DROSHA-knockout, and DICER-knockout cells were maintained in McCoy's 5A (Modified) Medium (Gibco) supplemented with 10% fetal bovine serum (Gibco) at 37°C with 5% CO2.
HEK293T cells (female) were maintained in DMEM (Gibco) supplemented with 10% fetal bovine serum (Gibco) at 37°C with 5% CO2. HEK293T-DROSHA-knockout, DGCR8KO-knockout cells were maintained in the same condition.
A549 cells (male) and HepG2 were maintained in DMEM (Gibco) supplemented with 10% fetal bovine serum (Gibco) at 37°C with 5% CO2.
Plasmid transfection and dox induction
HEK293T and A549 cells were thawed from their liquid nitrogen stock and subcultured for five to 15 generations in DMEM medium. The cells were then seeded into a 10 cm dish at 10% confluency and cultured for ∼1 day until they reached 15% confluency. Following this, the plasmids, 300 ng of tet-on plasmids, 1.8 μg of Microsensor plasmids, 6 μg of Cas9 plasmids, and 1.5 μg of sgRNA plasmids, were introduced to the dish. These were transfected using lipofectamine following the manufacturer's protocol. After 1 day, the medium was replaced with fresh medium. Two days post-transfection, doxycycline was added to the culture to achieve a final concentration of 1 mg/mL. The cells were then incubated overnight before being subjected to fluorescence-activated cell sorting (FACS) analysis.
Single-cell suspension preparation for FACS analysis
Following overnight induction with doxycycline, the cells were detached from the dishes by adding 2 mL of trypsin per 10 cm dish and incubated for a specific duration at 37°C. The incubation time should be adjusted based on the cell type (e.g., 2 min for HEK293T cells). For other cell types, cells should be monitored under the microscope every minute until all cells become rounded and fully detached. Stop the trypsinization by adding 2 mL of 20% FBS (fetal bovine serum) in HBSS (Hank's balanced salt solution, HBSS, no calcium, no magnesium) to each dish.
The cell suspension was then collected and passed through a cell strainer with a pore size of 40–70 μm into a centrifuge tube. The cells were centrifuged at 300g for 3 min, and the supernatant was discarded. The cell pellet was washed one more time and then resuspended in 1 mL of 20% FBS-HBSS solution.
For FACS analysis, the cells were stained with DAPI (4′,6-diamidino-2-phenylindole), a fluorescent stain that binds strongly to DNA, before being loaded into the flow cytometer.
Single-cell isolation by FACS
Setting up the FACS
To begin setting up the FACS (BD FACSAria III), follow the manufacturer's instructions to start the machine, install a neutral density (ND) 2.0 filter, and attach a 100 μm nozzle. Prepare your samples according to the single-cell suspension protocol and then load them into the FACS. It is essential to load cells transfected with mCherry plasmid, ZsGreen plasmid, and Microsensor-minus plasmid separately to avoid cross-contamination and ensure accurate sorting.
Set the flow speed to the lowest setting, which is rate = 1, to minimize cell damage during sorting. Proceed to gate the cells from debris using forward scatter (FSC-A) and side scatter (SSC-A) settings. Adjust the FSC voltage to 30 and the SSC voltage to 270 for HEK293T, HepG2, and HCT116 cells. For A549 cells, adjust the SSC voltage to 230. This step is crucial for accurately distinguishing cells from debris based on size and internal complexity.
Next, measure the fluorescence signals of ZsGreen and mCherry using the FITC and mCherry channels, respectively. Initial findings should indicate that the ZsGreen fluorescence is higher than mCherry in the Microsensor-minus samples, as well as in cells transfected solely with the ZsGreen plasmid. To facilitate accurate comparisons, adjust the voltages of the FITC and mCherry channels until the ZsGreen to mCherry fluorescence ratio approaches 1:1.
Finally, create plots for both mCherry and ZsGreen. For mCherry-plasmid transfected cells, isolate those expressing mCherry from nonexpressors and determine the mCherry signal values for future gating. Perform a similar process for ZsGreen-plasmid transfected cells using the FITC plot. This preparation allows for precise gating of cells expressing each fluorescent marker in subsequent experiments, ensuring reliable data collection and analysis.
FACS analysis of cells transfected with Microsensor-plus or Microsensor-minus system
We initiated our experiment by transfecting various cell lines, HEK293T, A549, HCT116, and HepG2, with either the Microsensor-plus or Microsensor-minus plasmid. Following transfection, we stained the samples with DAPI and then loaded them into the FACS machine for analysis. To identify and gate living cells, we used both the FSC-A/SSC-A parameters to differentiate cells from debris and the absence of DAPI fluorescence to exclude dead cells. For precise single-cell analysis, we used FSC-W/FSC-H values, setting them at ∼120 for HEK293T, HCT116, and HepG2 cells, and at 160 for A549 cells, to effectively gate individual cells.
Our next step was to identify cells that were successfully transfected. We did this by selecting cells that exhibited a ZsGreen signal within the range of 0–250,000 on the FITC channel, as ZsGreen expression is independent of the cellular Microprocessor activity. After confirming ZsGreen expression, we then assessed the mCherry signals within the range of 1000–250,000. Both ZsGreen and mCherry are expressed from a bidirectional promoter in the Microsensor plasmids, which typically results in their linear coexpression.
By analyzing the FITC/mCherry plot, we were able to verify successful transfection and concurrent expression of the proteins indicated by a linear relationship in the FITC/mCherry ratio. We strictly selected only those cells that displayed both FITC and mCherry signals within the defined range, excluding any cells that fell outside these parameters. The final step involved obtaining a comprehensive FITC/mCherry plot specifically for the Microsensor-transfected samples, ensuring that we only analyzed cells that fit our strict criteria for successful transfection and expression.
Sorting the cells from the knockout experiments by FACS
In our knockout experiments, we started by transfecting cells with control sgRNA plasmids, which do not target any specific region of the human genome, along with the Cas9 plasmid and either the Microsensor-minus system (referred to as Microsensor-minus sample) or the Microsensor-plus system (referred to as Microsensor-plus sample). We then used FACS to gate or select the cells from debris based on the FSC-A/SSC-A parameters, setting the FSC voltage at 30. For SSC, we used a voltage of 270 for HEK293T, HepG2, and HCT116 cells and 230 for A549 cells. For single-cell gating, we used FSC-W/FSC-H values of 120 for HEK293T and 160 for A549.
Our initial selection involved identifying cells that exhibited a FITC signal ranging from 1000 to 250,000, indicative of ZsGreen expression, to consider them as successfully transfected in the knockout (KO) or knockin (KI) experiments. Subsequently, we monitored the mCherry signals, also within the range of 0–250,000, and generated FITC/mCherry plots. We then overlapped these plots for both the Microsensor-minus and Microsensor-plus samples.
We overlaid these plots and manually selected a specific region, designated as the KO area, to emphasize significant differences between the two samples. This KO area contained a minimal percentage of cells (0.5%–2%) in the Microsensor-plus sample and at least five times more in the Microsensor-minus sample.
Concurrently, we conducted additional knockout experiments targeting the DROSHA or DGCR8 gene using sgRNA plasmids, alongside the Cas9 plasmid and the Microsensor-plus system, now referred to as the Microprocessor-KO sample. We applied the same FSC-A/SSC-A parameters and single-cell gating values as in the previous setups. The previously defined KO area was used to gate potential KO cells in these experiments, with the understanding that this area might vary based on factors such as transfection efficiency, doxycycline induction, and the sgRNAs used.
The gated cells were collected using two methods for further analysis. Bulk collection method: Approximately 300 cells were collected into one well and cultured for 7 days before performing genomic DNA analysis by PCR. Single-cell collection method: Around 100 cells were individually collected into 100 wells and cultured for 3–4 weeks, followed by genomic DNA analysis by PCR and sequencing.
Sorting the cells from the knockin experiments by FACS
In our knockin experiments, which were structured similarly to our knockout experiments, we transfected cells with the Cas9 plasmid, donor double-stranded DNA (dsDNA), and either knockin sgRNAs or a control sgRNA plasmid. We incorporated the Microsensor-plus system to monitor gene-editing outcomes, ensuring consistent gating settings for fluorescence-based sorting as used in the knockout experiments.
Theoretically, knockin cells with successful integration of the mutant DGCR8 gene should exhibit partially restored pri-miRNA cleavage activity, which can be identified by a high FITC to mCherry fluorescence ratio. For valid selection, the area representing potential knockin cells in our experiments should contain at least 0.5% of cells, compared to <0.5% in the control sgRNA experiment. A minimum twofold difference in cell percentages between the control and knockin experiments would indicate successful gene integration.
The analysis of gated cells followed a similar procedure to that used in the knockout setup. Single cells were isolated in a 96 well plate. Approximately 2 weeks later, we used cell lysates to confirm the knockin status through PCR, thus verifying the genetic modifications.
Genomic DNA analysis by PCR
When the sorted single cells in the 96 well plate reached ∼80% confluence, we removed the media and administered 20 µL of trypsin per well, allowing it to act for 2 min before neutralizing it with an equal volume of culture media. The cells were then split into two portions: 20 µL was transferred into 100 µL of fresh culture media for continued culturing, and the remaining 20 µL was mixed with 20 µL of direct-lysis buffer (composition: 20 mM Tris pH 8.0, 5 mM EDTA, 0.4 m NaCl, 0.3% SDS, and 0.6% Tween-20). This cell-lysis buffer mixture underwent a series of heating and cooling cycles, 65°C for 30 sec, 8°C for 30 sec, 65°C for 1.5 min, 97°C for 3 min, 8°C for 1 min, 65°C for 3 min, 97°C for 1 min, 65°C for 1 min, and 80°C for 10 min, to ensure complete lysis, after which the lysates were diluted with 80 µL of water and prepared for PCR analysis to verify knockin and knockout status.
Small RNA-sequencing and analysis
The small RNA fraction was separated from extracted total RNA using 12% denaturing urea-PAGE and was purified using the IPA precipitation method. Small RNA libraries were then prepared using NEBNext Small RNA Library Prep Set for Illumina (E7330S) with the purified small RNA fraction as input. The final dsDNA libraries were subjected to a next-generation sequencing platform in a paired-end sequencing mode.
First, adapter sequences were removed from sequencing reads using cutadapt (cutadapt ‐‐a AGATCGGAAGAGCACACGTCT -A GATCGTCGGACTGTAGAACTCTGAAC). The trimmed paired-end reads were then joined using fastq-join (Aronesty 2013) (fastq-join -p 5), and low-quality reads were removed using fastq_quality_filter (http://hannonlab.cshl.edu/fastx_toolkit/index.html, version 0.0.14) (fastq_quality_filter -q 30 -p 90). The remaining reads were next mapped to reference human genome (GRCh38) using bowtie2 (Langmead and Salzberg 2012) in the local alignment mode (bowtie2 ‐‐local -p 4 ‐‐score-min L,-4,2 ‐‐ma 2 -k 5). Reads mapped to miRNA loci at both ends within the range from −4 to +4 to the annotated sites deposited in miRbase (Kozomara et al. 2019) were collected for downstream analysis. The raw read counts of each pri-miRNA, which are the sum of its derivative 5p and 3p miRNAs, were normalized to the total read count of the reported 257 DROSHA-independent pri-miRNAs, which were summarized in a previous study. The base-pairing probability of each nucleotide in the sequence of the DROSHA-dependent pri-miRNAs (with 30 nt extension at both ends of pre-miRNAs) detected in the sequencing libraries were calculated using RNAfold (Lorenz et al. 2011) (RNAfold -p).
Cell cycle analysis
For cell cycle analysis, cells were first harvested from 6 well plates by removing the media and adding 300 µL of trypsin to each well. After a 2 min incubation, the cells were collected and washed with PBS. Subsequently, cells were fixed by adding cold 70% ethanol dropwise to the cell pellet while vortexing, ensuring even fixation and minimizing clump formation. The fixation process lasted for 2 h at 4°C. Post-fixation, the cells were washed twice with PBS and centrifuged at 850g. Care was taken to avoid cell loss during supernatant removal, particularly after ethanol fixation. Next, 300 µL of PI staining buffer (50 µg/mL propidium iodide and 10 µg/mL RNase A in PBS) was added to the cells. The prepared samples were then analyzed using a FACS machine to assess the propidium iodide staining profile. For a detailed quantitative analysis of cell cycle, see Supplemental Table 6.
Cell migration by wound healing experiment
The wound healing experiment was conducted using the Culture-Insert 4 Wells (Ibidi 80206). We prepared the cell suspension in the usual manner, incorporating a centrifugation step to eliminate dead cells and debris. The cell density was then adjusted to 3 × 10⁴ cells/mL. We added 110 µL of this suspension into each well of the Culture-Insert, achieving a fully confluent single-cell layer within 24 h. To initiate the migration assay, the Culture-Insert was carefully removed using sterile tweezers, and the dish was immediately filled with medium. Images were captured at 0 and 8 h using a microscope equipped with a CCD camera. For a detailed quantitative analysis, see Supplemental Table 6.
Annexin V-FITC apoptosis assay
To analyze cell apoptosis, cells were initially dissociated from the culture dishes using trypsin. The trypsin reaction was halted by adding culture medium. Following this, the cells were returned to the incubator for a 30 min recovery period. After incubation, the cells were harvested and washed three times with phosphate-buffered saline (PBS) to remove any residual medium or trypsin.
The cells were then resuspended in 100 µL of staining buffer. Propidium iodide (PI) and Annexin V-FITC were added to the resuspended cells according to the protocol provided in the Apoptosis Assay Kit (Proteintech PF00005).
Finally, 400 µL PBS was added to the prepared samples and the stained samples were loaded onto a flow cytometer to measure the percentage of dead and apoptotic cells, facilitating precise quantification. Supplemental Table 6 provides a detailed quantitative analysis of the apoptosis assays.
mRNA stability assay
Actinomycin D was used to stop the gene transcription in the cells. HEK293T cells were seeded into a 6 well plate at 10% confluency and cultured for ∼1 day until they reached 15%–20% confluency. Following this, the plasmids, 100 ng of tet-on plasmids, 300 ng of Microsensor plasmids, were transfected into the dish. These were transfected using lipofectamine following the manufacturer's protocol. After 1 day, the medium was replaced with fresh medium. Then, actinomycin D was added to the wells with 10 µg/mL final concentration. Then collect the cells with actinomycin D treatment at 0 day and keep the cells lysated by TRizol in −80°C. Collect other cells at 1 and 2 days after actinomycin D addition and treat the cells like day 0 sample. After the collection of all samples, mCherry mRNA level was analyzed by qPCR and normalized to GAPDH and ZsGreen. The detailed fold change is provided in Supplemental Table 6.
Western blot
The edited and wild-type cells were harvested and resuspended using T500 buffer. Following sonication, 20 µg of the cell lysates were separated on 12% SDS-polyacrylamide gels. Proteins from the SDS gels were then transferred to PVDF membranes (Bio-Rad 1620177). After the transfer, membranes were blocked with 5% skim milk in 0.05% PBS with Tween 20 (PBST) and subsequently incubated with the antibodies against DROSHA and DGCR8, and a commercial α-tubulin antibody (Proteintech 66031-1-Ig) at a dilution of 1:3000. The DROSHA antibody (Z1D3) and DGCR8 antibody (19A1) were kindly provided as gifts by Dr. Narry Kim at Seoul National University. The membranes, post-primary antibody incubation, were washed in 0.05% PBST and incubated with a horseradish peroxidase–conjugated secondary antibody (Proteintech) at a 1:3000 dilutions. Detection was performed using the ECL SuperSignal West Femto Maximum Sensitivity Substrate (Thermo Fisher Scientific).
Quantification and statistical analysis
Quantification of miRNA from small RNA-sequencing data was performed using Python v3.12.
DATA DEPOSITION
The small RNA-sequencing data sets have been deposited in the Gene Expression Omnibus (GEO) under accession number GSE276799. The reviewer access code for GSE276799 is “ipgtgeyoxjolxyd.”
SUPPLEMENTAL MATERIAL
Supplemental material is available for this article.
ACKNOWLEDGMENTS
We wish to thank Dr. Narry Kim from Seoul National University for providing the DROSHA-KO and DGCR8-KO cell lines, sourced from HCT116 cells and HEK293 EBNA1, along with corresponding antibodies. Appreciation is also extended to Dr. Angela Wu and Dr. Karl Tsim at HKUST for sharing the HepG2 and A549 cell lines, respectively. Gratitude is further owed to the Biosciences Central Research Facility at HKUST (Clear Water Bay) for their exceptional service and support. This research was funded by the National Natural Science Foundation of China under project number 32371355. C.T.L. is a recipient of the Hong Kong PhD Fellowship Scheme, Research Grants Council.
Footnotes
-
Article is online at http://www.rnajournal.org/cgi/doi/10.1261/rna.080338.124.
- Received November 25, 2024.
- Accepted April 2, 2025.
This article is distributed exclusively by the RNA Society for the first 12 months after the full-issue publication date (see http://rnajournal.cshlp.org/site/misc/terms.xhtml). After 12 months, it is available under a Creative Commons License (Attribution-NonCommercial 4.0 International), as described at http://creativecommons.org/licenses/by-nc/4.0/.




