


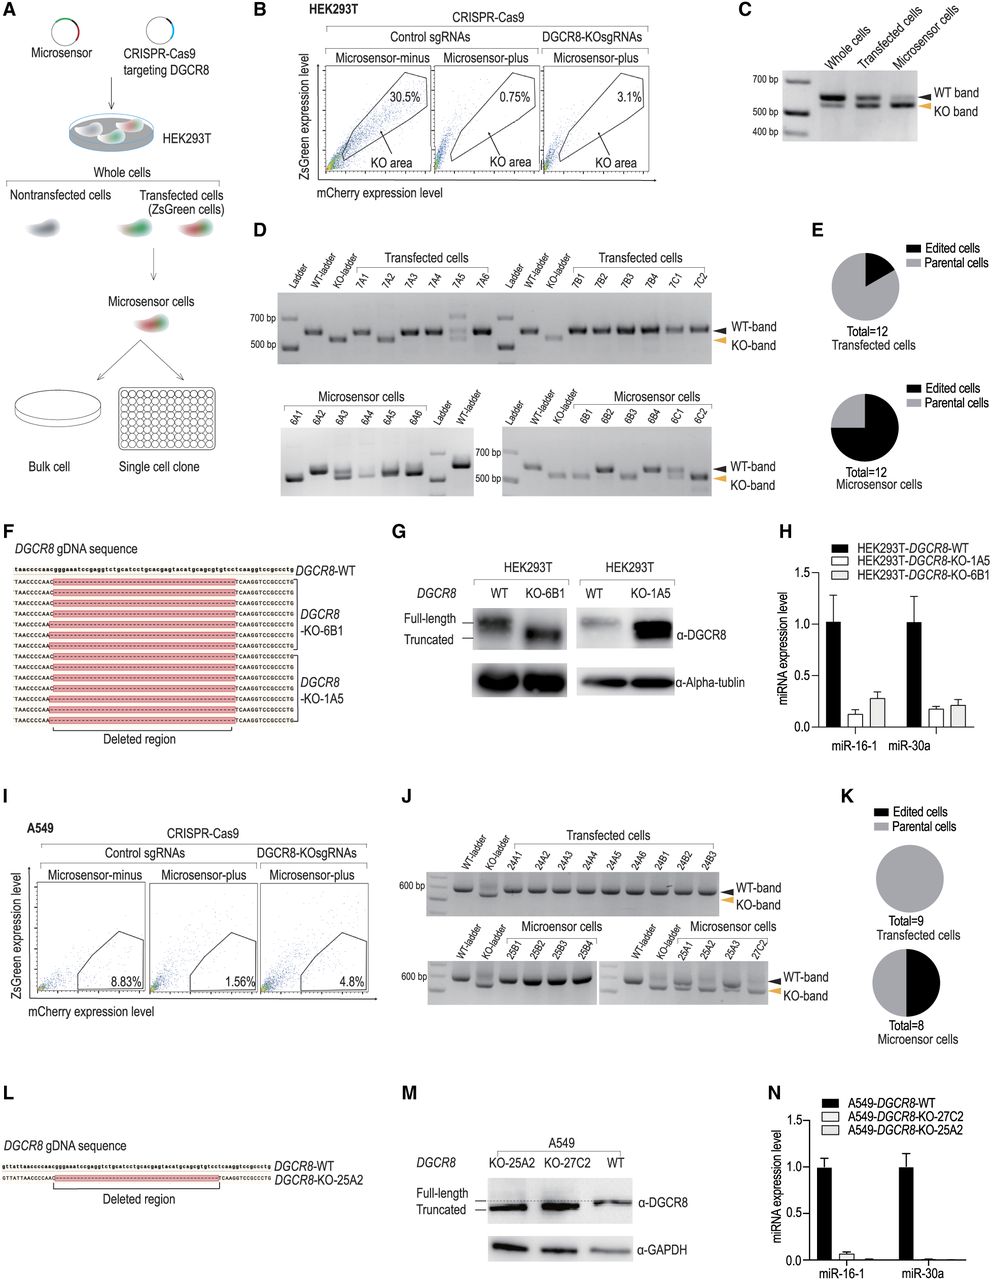
Application of the Microsensor system for selective enrichment of DGCR8 knockout cells via CRISPR-Cas9. (A) Workflow of DGCR8-KO experiments. HEK293T cells were transfected with a pair of KO sgRNAs, Cas9 plasmids, and the Microsensor system. Following transfection, the cells, referred to as “whole cells,” underwent FACS analysis. During FACS, cells emitting a ZsGreen signal were identified as “transfected cells,” and those with a high ZsGreen to mCherry ratio were categorized as “Microsensor cells.” Post-analysis, cells were either sorted collectively as bulk cells or individually as single cells, which were then cultured in separate wells for 2–3 weeks. (B) FACS results of DGCR8-KO experiments in HEK293T cells. The FACS analysis displayed ZsGreen levels on the y-axis and mCherry levels on the x-axis. Cells transfected with Microsensor-minus and control sgRNA were used as controls to define the fluorescence profile potentially indicative of successful DGCR8-KO in cells transfected with Microsensor-plus and DGCR8-KOsgRNAs. (C) PCR analysis of genomic DNA from DGCR8-KO experiments. The PCR analysis targeted genomic DNA from the cells involved in the DGCR8-KO experiments. The expected PCR product length for wild-type cells (WT-band) is 598 base pairs (bp), while the PCR product for DGCR8-KO cells (KO-band) is ∼551 bp. (D) Single-cell PCR analysis of genomic DNA from DGCR8-KO experiments. This analysis involves genomic DNA extracted from individual cells. The PCR results include a wild-type ladder showing DNA fragments of 598 bp and a knockout ladder displaying fragments of ∼551 bp. (E) Pie chart of edited cells. This pie chart illustrates the proportion of cells containing the KO-band, as identified from the PCR experiment described in D. (F) Sequencing analysis of DGCR8-KO cells. DNA regions containing mutations from DGCR8-KO cells (clones 6B1 and 1A5) were amplified via PCR and cloned into a TOPO-TA plasmid (Vayzme, C603-01) for Sanger sequencing. Each line represents one sequencing result from each TOPO-TA plasmid clone. Deletion regions are marked by dashed lines. (G) Western blot analysis. This analysis was performed on both DGCR8-KO and wild-type cells. The DGCR8 protein band in DGCR8-KO cells appeared slightly smaller than that in wild-type cells. (H) Quantification of miRNA expression. The expression levels of miR-16-5p and miR-30a-5p were quantified using qPCR in both WT and DGCR8-KO cells. The results were normalized to the expression level of U6 snRNA. (I) FACS results of DGCR8-KO experiments in A549 cells. FACS analysis plotted ZsGreen levels on the y-axis against mCherry levels on the x-axis. Cells transfected with Microsensor-minus and control sgRNA served as controls to identify potential regions of successfully edited DGCR8-KO cells from experiments using Microsensor-plus and DGCR8-KOsgRNAs. (J) Single-cell PCR analysis of genomic DNA from DGCR8-KO experiments in A549 cells. Genomic DNA was isolated from single cells in experiment in I and were amplified by PCR. The analysis included a wild-type ladder with DNA fragments of 598 bp and a knockout ladder with fragments of 551 bp. (K) Pie chart of edited cells. This pie chart displays the portion of cells that contained the KO-band from the PCR experiment in J. (L) Sequencing analysis of DGCR8-KO cells in A549. The mutated region of the DGCR8-KO 25A2 cells was PCR amplified and sequenced using Sanger sequencing. The deletion region is indicated by a dashed line. (M) Western blot analysis in A549 Cells. Western blotting was conducted on A549 DGCR8-KO cells (clones 25A2 and 27C2) and wild-type cells. The DGCR8 protein band in the DGCR8-KO cells appeared slightly smaller than in the wild-type cells. (N) miRNA expression quantification in A549 cells. The expression levels of miR-16-5p and miR-30a-5p were quantified by qPCR in both wild-type and DGCR8-KO cells, normalized to the expression level of U6 snRNA.




