


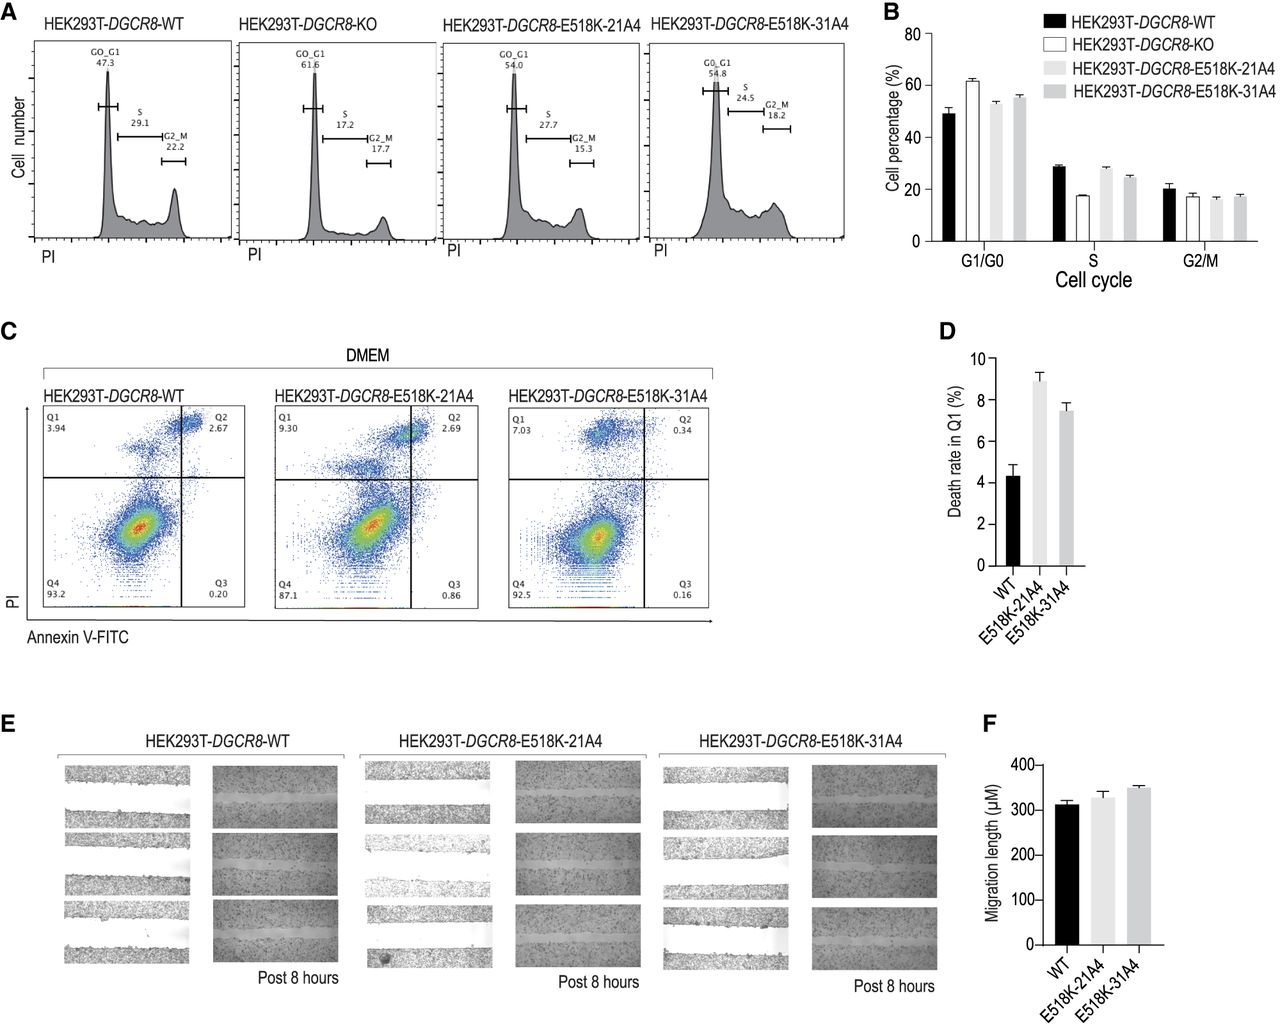
Assessing the effects of DGCR8-E518K mutation on cell cycle, migration, and cell death. (A) Cell cycle analysis in DGCR8-E518K and wild-type cells. DGCR8-E518K cells showed a slightly higher percentage of cells in the G0–G1 phase compared to DGCR8-WT cells, but fewer than DGCR8-KO cells. The distribution of cells at different stages of the cell cycle was determined using FACS. (B) Quantitative cell cycle analysis. This analysis includes data from three repeated experiments that assessed the cell cycle stages as described in A. (C) FACS analysis of cell death in DMEM medium. Representative dot plots demonstrate Annexin-V-FITC/PI staining of DGCR8-WT and DGCR8-E518K cells cultured in DMEM medium, as acquired via flow cytometry. The Q1 section indicates cell death. (D) Quantitative analysis of cell death. This analysis incorporates data from three independent experiments that assessed cell death in the Q1 section of the plot, as performed in C. (E) Wound healing assay to evaluate migration ability. A wound was introduced into dishes culturing different cells, and images were captured at the start and after 8 h. This experiment was repeated three times. (F) Measurement of wound length. The length of the wound in three repeated experiments conducted in E was measured and plotted in a bar chart.




