


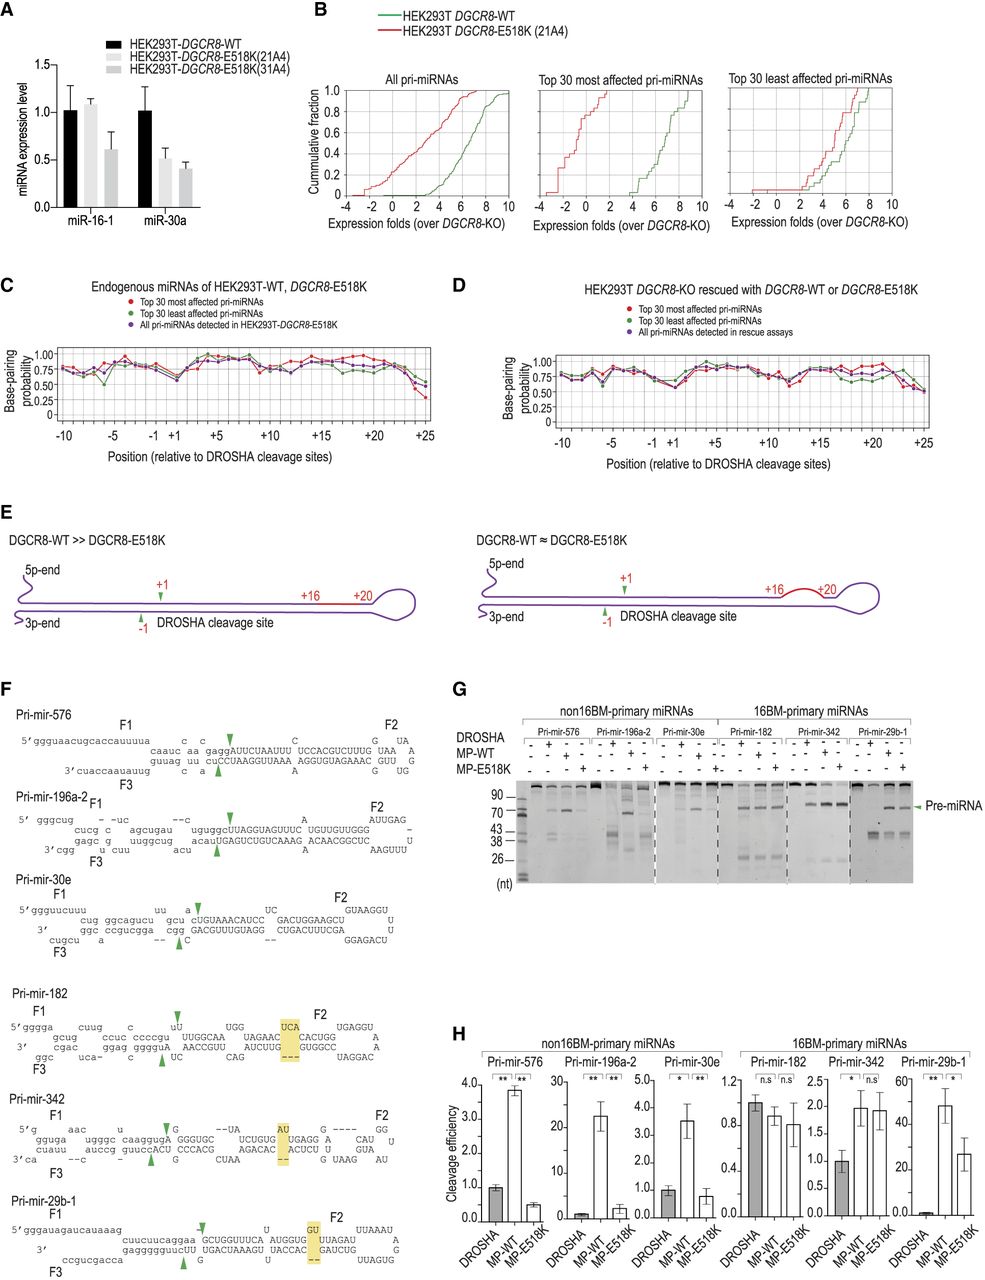
Differential impact of DGCR8-E518K mutation on miRNA expression. (A) Quantitative PCR analysis of miRNA expression. Comparison of miR-16-5p and miR-30a-5p expression levels between DGCR8-E518K mutant and wild-type cells. miRNA expression was normalized against U6 expression. (B) miRNA profile analysis in DGCR8-E518K mutant and wild-type cells. The left panel displays the cumulative fraction of miRNA expression profiles for both DGCR8-WT and DGCR8-E518K cells. The middle and right panels highlight the top 30 most affected and least affected primary miRNAs (pri-miRNAs) by DGCR8-E518K, selected based on the differential expression levels (Δ values) relative to DGCR8-WT. (C) Base-pairing probabilities in the top 30 most affected and least affected primary miRNAs (pri-miRNAs) by DGCR8-E518K from B. Analysis of the base-pairing probabilities across the 5p-strand of pri-miRNAs. RNA structures were predicted using RNAfold, and each nucleotide's base-pairing status was determined from the predicted structure. The positions of the nucleotides are marked on the x-axis in relation to the DROSHA cleavage sites. (D) Base-pairing probabilities of the top 30 most affected and least affected primary miRNAs (pri-miRNAs) by DGCR8-E518K were analyzed using data from the rescue experiments. HEK293T DGCR8-KO cells were rescued with either DGCR8-WT or DGCR8-E518K, and small RNAs were analyzed as described in B and C. (E) Impact of DGCR8-E518K mutation on pri-miRNA groups. The model differentiates between two groups of pri-miRNAs: non16BM-pri-miRNAs and 16BM-pri-miRNAs. DGCR8-E518K cells exhibited a differential impact on the miRNA expression from these two groups compared to wild-type cells. 16BM indicates bulges or mismatches at positions +16 to +20. (F) Structures and sequences of pri-miRNAs. Depiction of pri-miRNA structures and sequences, with DROSHA cleavage sites indicated by green arrowheads. Yellow boxes highlight bulges or mismatches at positions +16 to +20, termed 16BM. The fragments F1, F2 (pre-miRNA), and F3 are generated through Microprocessor cleavages. (G) In vitro cleavage of pri-miRNAs. Each pri-miRNA, with or without 16BM, was incubated with 8 pmol of DROSHA or 3 pmol of Microprocessor complex protein at 37°C for 120 min using a 5 pmol aliquot of each pri-miRNA. (MP) Microprocessor. (H) Cleavage efficiency analysis. Cleavage efficiency of the enzymes from three separate experiments was calculated and represented in bar charts.




