


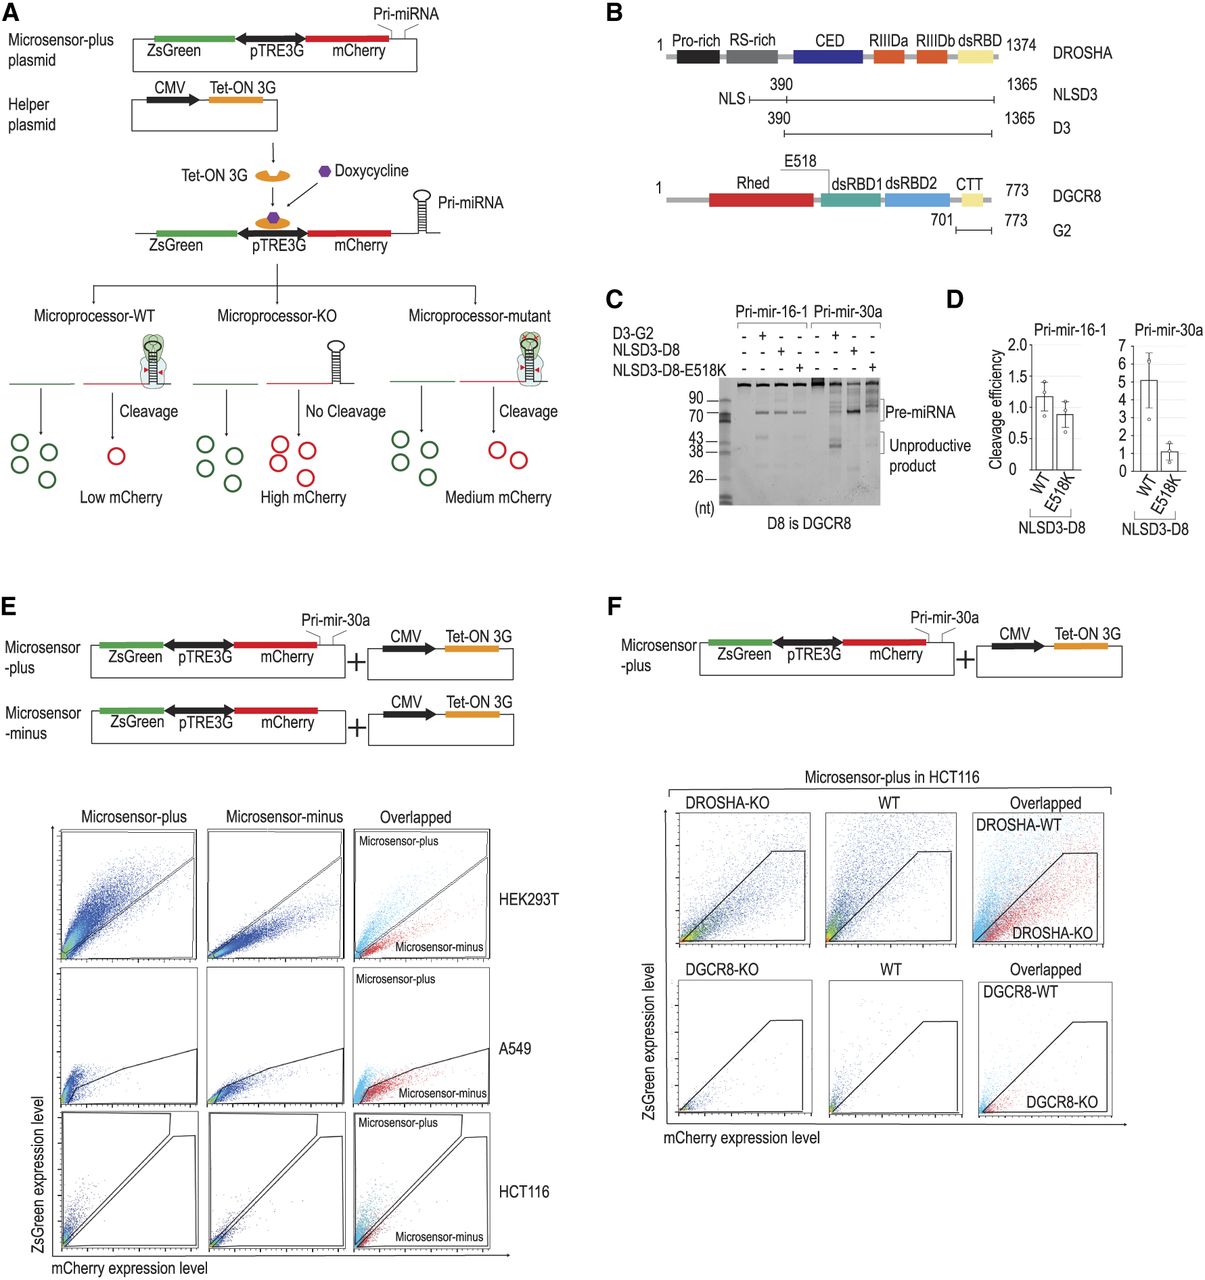
Development and validation of the Microsensor system for monitoring Microprocessor activity in human cells. (A) Construction of the Microsensor system. The Microsensor system includes the Microsensor and helper plasmids. Pri-miRNA is inserted into the mCherry 3′ UTR of the pTRE3G plasmid backbone, which is regulated by the bidirectional Tet-ON 3G promoter, activated by a doxycycline and Tet-ON 3G complex, enabling simultaneous expression of mCherry and ZsGreen. The CMV promoter governs the Tet-ON 3G in the helper plasmid. Microprocessor-mediated cleavage of pri-miRNA reduces mCherry expression relative to ZsGreen. (B) Protein domain mapping. The diagram highlights the protein domains of DROSHA and DGCR8, with specific amino acid positions noted. Key domains include P-rich (proline-rich domain), R/S-rich (arginine/serine-rich domain), CED (central domain), RIIIDa and RIIIDb (RNase III domains), dsRBD (double-stranded RNA binding domain), Rhed (RNA-binding heme domain), and CTT (C-terminal tail region). The nuclear localization sequence (NLS) is also marked. Notably, the E518 (glutamic acid at 518th position) residue mutation is located in dsRBD1 of DGCR8. (C) Pri-miRNA processing analysis. Assays performed to evaluate the processing of 5 pmol pri-miRNA by DROSHA (D3-G2, 8 pmol), NLSD3-D8 (3 pmol) and the NLSD3-D8-E518K (3 pmol). D8 is full-length DGCR8. (D) Quantitative assessment of cleavage efficiency. The efficiency of pri-miRNA cleavage was quantified as the ratio of cleaved products (pre-miRNAs) to the total pri-miRNA substrate, based on three replicate assays detailed in C. The final relative efficiency was normalized to DROSHA-only cleavage. (E) Verification of the Microsensor system across cell lines. The functionality of the Microsensor system, with (Microsensor-plus) and without (Microsensor-minus) pri-mir-30a, alongside helper plasmids, was tested in HEK293T, HCT116, and A549 cells. FACS analysis (BD FACSAria III) was used to detect mCherry and ZsGreen signals, with the plot percentages reflecting cells within specific areas. (F) Discriminative analysis of wild-type and Microprocessor-deficient cells using the Microsensor system. The ability of the Microsensor-plus system to distinguish between wild-type and Microprocessor knockout (MP-KO) cells is demonstrated. Transfections were performed in HCT116 wild-type, DROSHA-KO, and DGCR8-KO cells, with subsequent FACS analysis to measure mCherry and ZsGreen fluorescence.




