


Comprehensive analysis of m6A-seq data reveals distinct features of conserved and unique m6A sites in mammals
- Guo-Shi Chai1,2,
- Hong-Xuan Chen1,3,
- Dong-Zhao Ma1,
- Ze-Hui Ren1,3,
- Xue-Hong Liu1,
- Zhang Zhang1 and
- Guan-Zheng Luo1,3,4
- 1State Key Laboratory of Biocontrol, MOE Key Laboratory of Gene Function and Regulation, Guangdong Province Key Laboratory of Pharmaceutical Functional Genes, School of Life Sciences, Sun Yat-sen University, Guangzhou 510275, China
- 2Westlake Laboratory of Life Sciences and Biomedicine, Hangzhou, Zhejiang 310024, China
- 3Sun Yat-sen University Institute of Advanced Studies Hong Kong, Science Park, Hong Kong SAR 999077, China
- 4Innovation Center for Evolutionary Synthetic Biology, Sun Yat-sen University, Guangzhou 510275, China
- Corresponding author: luogzh5{at}mail.sysu.edu.cn
-
Handling editor: Ling-Ling Chen
Abstract
N6-methyladenine (m6A) stands out as the most prevalent internal chemical modification on mammalian mRNA, playing a vital role in diverse biological processes. However, the characteristics of m6A across different cell lines and tissues remain poorly understood. In this study, we systematically evaluated 193 published m6A-seq data sets using newly established quality metrics, identifying ∼1.5 million high-confidence m6A sites in human and mouse. By categorizing m6A sites into different consistency levels, we observed that high-consistency m6A sites were enriched near mRNA stop codons and lncRNA 5′ ends, exhibited stronger interactions with canonical m6A-binding proteins, and contributed to mRNA/lncRNA expression homeostasis. Furthermore, the promoters of genes marked by these consistent sites exhibited higher CpG density, with METTL3 preferentially binding to these regions. Conversely, low-consistency or unique m6A sites were enriched near mRNA start codons and distributed evenly across lncRNA, interacting with newly discovered m6A-binding proteins. These findings enhance our understanding of the diverse characteristics and potential functional roles of m6A in mammals.
Keywords
INTRODUCTION
Eukaryotic mRNAs are subject to a variety of chemical modifications that significantly impact their metabolism and function (Wiener and Schwartz 2021; Boccaletto et al. 2022). Among these modifications, N6-methyladenosine (m6A) is the most prevalent internal modification and has received substantial attention due to its roles in diverse biological processes (Fu et al. 2014). The dynamic and reversible nature of m6A is governed by “writers” that add methyl groups, “erasers” that remove them, and “reader” proteins that selectively bind to the modified RNA (Fu et al. 2014). These reader proteins, particularly the YTH domain-containing family (e.g., YTHDF1–3, YTHDC1–2) and IGF2BPs, regulate gene expression in an m6A-dependent manner by influencing mRNA stability, translation, splicing, and nuclear export (Wang et al. 2014, 2015; Xiao et al. 2016; Roundtree et al. 2017; Huang et al. 2018; Kasowitz et al. 2018).
To explore m6A modifications comprehensively across the transcriptome, several mapping methods have been developed, such as miCLIP (Linder et al. 2015), m6A-seq2 (Dierks et al. 2021), DART-seq (Meyer 2019), m6A-label-seq (Shu et al. 2020), MAZTER-seq (Garcia-Campos et al. 2019), m6A-REF-seq (Zhang et al. 2019), GLORI (Liu et al. 2023), eTAM-seq (Xiao et al. 2023), m6Anet (Hendra et al. 2022), m6ABasecaller (Cruciani et al. 2025), and SingleMod (Xie et al. 2023). Among these methods, m6A-seq/MeRIP-seq (Dominissini et al. 2012; Meyer et al. 2012) remains the most widely used due to its relatively simple workflow and cost-effectiveness. This method relies on immunoprecipitation with m6A-specific antibodies to enrich for modified RNA fragments. However, m6A-seq suffers from limitations, including a relatively low resolution, rRNA contamination, low library complexity, and variable m6A antibody enrichment efficiency, leading to the detection of false positives and low-confidence m6A sites, which can hinder accurate interpretation of m6A's biological roles (Slama et al. 2019; McIntyre et al. 2020). Therefore, rigorous quality control and data evaluation are crucial for identifying high-confidence m6A sites for downstream analysis.
While m6A is known to regulate various aspects of RNA metabolism and influence gene expression (Fu et al. 2014; Roignant and Soller 2017), a comprehensive understanding of how m6A site distribution and characteristics vary across different cell types and tissues, and the functional consequences of this variation, is currently lacking. Previous studies have shown that m6As play a role in regulating gene expression homeostasis in human fetal tissues, with enrichment in genes containing CpG-rich promoters (Xiao et al. 2019). However, a systematic analysis of m6A site consistency across diverse cell lines and tissues, and its relationship to m6A-binding protein interactions, gene expression, and promoter CpG density, remains to be fully elucidated. Addressing this knowledge gap is crucial for understanding the full spectrum of m6A's regulatory roles in development, disease, and cellular homeostasis. Furthermore, identifying cell type–specific or tissue-specific m6A sites may provide novel biomarkers or therapeutic targets for various diseases.
In this study, we conducted a comprehensive evaluation of 193 published m6A-seq data sets using newly developed quality metrics and identified ∼1.5 million high-confidence m6A sites in human and mouse. By categorizing these sites based on their consistency across cell lines and tissues, we reveal distinct features associated with different levels of m6A site conservation. Highly consistent m6A sites are enriched near mRNA stop codons and the 5′ ends of lncRNA, interacted preferentially with known m6A-binding proteins, and correlated with increased gene expression homeostasis and promoter CpG density, suggesting a role in maintaining cellular identity and fundamental cellular processes. Additionally, the key m6A writer METTL3 displays preferential binding to the promoter of genes marked by high-consistency m6A sites. Conversely, low-consistency or unique m6A sites are enriched near mRNA start codons and are distributed evenly across lncRNA, interacting with newly discovered m6A-binding proteins, potentially contributing to dynamic responses to environmental stimuli or developmental cues. These findings, conserved across both human and mouse, provide novel insights into the diverse characteristics and functional roles of m6A in mammalian transcriptomes and lay the foundation for future investigations into the role of m6A in development, disease, and therapeutic interventions.
RESULTS
Quality control and identification of high-confidence m6A sites
To construct comprehensive and reliable data sets of high-confidence m6A sites, we compiled 193 publicly available m6A-seq (IP) and corresponding RNA-seq (Input) data sets from 36 different research groups. These data sets encompassed 20 mouse and 44 human tissue samples and cell lines, all obtained under wild-type or control conditions with at least two biological replicates (Fig. 1A; Supplemental Tables 1–4).
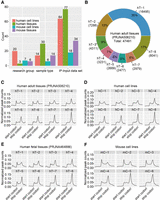
Sample information in this study and the proportion and distribution patterns of m6A sites of different consistency levels. (A) The number of research groups, sample types, and IP-Input data sets in human cell lines, human tissues, mouse cell lines, and mouse tissues. (B) m6A sites detected in eight different adult tissues are classified into eight consistency levels, and the number and proportion of m6A sites of eight consistency levels are shown. (C–F) Distribution of m6A sites with varying consistency levels across mRNA transcripts. Metagene profiles were generated using MetaPlotR (Olarerin-George and Jaffrey 2017), dividing the 5′-UTR, CDS, and 3′-UTR regions into 150 bins. The y-axis represents the normalized peak count, calculated as the number of m6A sites in each bin divided by the total number of m6A sites for that consistency level. (hT) Human tissue, (hC) human cell line, (mT) mouse tissue.
To ensure the reliability of subsequent analyses, we implemented a series of quality control metrics, including rRNA contamination rate, library complexity, and IP enrichment efficiency. First, we assessed rRNA contamination rate in all samples, confirming that all the data sets we used for further analysis exhibited low library contamination (Supplemental Fig. 1A,B). Next, we evaluated the library complexity using three metrics defined by the ENCODE project: NRF (Non-redundant Fraction), PBC1 (PCR Bottlenecking Coefficient 1), and PBC2 (PCR Bottlenecking Coefficient 2) (Landt et al. 2012). While Input samples displayed higher complexity than IP samples, as expected due to the sequence sampling inherent in the IP procedure (Supplemental Fig. 1C–H), we found that the standard ENCODE ChIP-seq quality thresholds were not directly applicable to m6A-seq IP data. Specifically, only a small fraction of IP samples met the ENCODE NRF threshold (Landt et al. 2012), and the majority showed moderate or higher PCR bottlenecking based on PBC1 and PBC2. Therefore, we established empirical thresholds based on the performance of the majority (75%) of IP samples: NRF > 8%, PBC1 > 0.2, and PBC2 > 2.
Third, we employed FRiP (fraction of reads in peaks) score, which measures the proportion of reads that fall within identified peak regions, to assess the enrichment efficiency of the IP procedure (Supplemental Fig. 1I,J). Applying consistent peak calling parameters across all samples, we observed significantly higher FRiP values in IP samples (median = 59.6%) compared to Input samples (median = 8%). Based on the distribution of FRiP scores, we set an empirical threshold of FRiP > 45% for IP samples. The rigorous quality control is crucial for filtering low-quality data and identifying reliable m6A modification sites, which are essential for downstream analyses.
After applying these quality control criteria, we retained data sets representing 30 human tissue samples, eight human cell line samples, 11 mouse tissue samples, and six mouse cell line samples. Within these data sets, we identified ∼1.5 million high-quality m6A sites, with an average of ∼30,000 m6A sites per human sample and ∼20,000 m6A sites per mouse sample (Supplemental Fig. 2). To further verify the authenticity of these sites, we examined their distribution pattern across the transcriptome (Supplemental Figs. 3, 5A, 6A). Consistent with previous reports (Dominissini et al. 2012; Meyer et al. 2012), we observed a prominent enrichment of m6A sites in the CDS and 3′-UTR regions, with significant enrichment near the stop codon. Furthermore, sequence analysis revealed a strong enrichment of the canonical DRACH motif (Supplemental Figs. 4, 5B, 6B). Notably, m6A sites in the mouse cell lines 3T3-L1 and MEF also exhibited significant enrichment near the start codon, consistent with previous findings (Xiong et al. 2021), and the presence of the DRACH motif suggests these are also bona fide m6A sites. These results confirm the overall quality and reliability of the identified m6A sites, providing a robust foundation for downstream analyses.
Transcriptomic distribution of m6A sites varies with consistency
To investigate the characteristics of m6A sites further, we categorized them based on their consistency, defined as the number of samples in which each site was detected. A large proportion of m6A sites were unique to a single tissue or cell line, while a smaller, but substantial number was detected across all samples (Fig. 1B; Supplemental Fig. 7). This wide range of consistency suggests that some m6A sites may play tissue-specific or cell type–specific roles, while others may have more conserved functions.
We then analyzed the distribution of m6A sites with varying consistency levels across the transcriptome (Fig. 1C–F; Supplemental Fig. 8). This analysis revealed that low-consistency m6A sites (those found in only a few tissues/cell lines) exhibited a bimodal distribution, with peaks occurring near both the start and stop codons. This bimodal distribution suggests that low-consistency m6A sites may have distinct roles depending on their location, potentially regulating translation initiation or termination, or other aspects of mRNA metabolism. As the consistency level increased, the enrichment of m6A sites near start codons gradually diminished, while the enrichment near stop codons increased. This pattern was conserved across humans and mice (Fig. 1C–F; Supplemental Fig. 8). The m6A sites with the highest consistency (those found in all of tissues/cell lines) displayed remarkable stability and were predominantly located in CDS and 3′-UTR regions, with a strong enrichment near stop codons. Conversely, the m6A sites with the lowest consistency, or sites that were uniquely present in one cell or tissue, exhibited a significant preference for start codons.
We also examined the distribution patterns of m6A sites with different consistency levels on lncRNA across different samples. Interestingly, the distribution patterns of m6A sites on lncRNA differ from those observed on mRNA: the m6A sites with the lowest consistency level (unique m6A sites) were evenly distributed across lncRNA, while the most consistent m6A sites showed a significant enrichment at the 5′ end of lncRNA (Supplemental Figs. 9, 10), suggesting that m6A may play distinct regulatory roles in these two classes of RNA molecules.
m6A sites with varying consistency associate with different m6A-binding proteins
m6A-binding proteins, or “readers,” are known to mediate the functional effects of m6A modifications by selectively recognizing and binding to m6A-modified RNA. To explore the potential functional consequences of m6A sites with varying consistency levels, we conducted an integrated analysis of nearly 34 million binding sites of 171 RNA-binding proteins (RBPs) from previously published data sets (Zhao et al. 2022). We first focused on the most consistent m6A sites and identified three RBPs (YTHDF1–3) that were significantly enriched at these sites, while 21 RBPs were significantly depleted (Fig. 2A). Conversely, analyzing the unique m6A sites, we identified 20 RBPs that exhibited preferential enrichment and eight RBPs (YTHDF1–3, RBM15, RBM15B, CPSF7, IGF2BP1, and YTHDC1) that were significantly depleted (Fig. 2B).
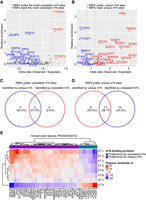
m6A-binding proteins identified by m6A sites of eight consistency levels in eight adult tissues. (A) Three m6A-binding RBPs (red dots) that prefer binding to the most consistent m6A sites and 21 m6A-binding RBPs (blue dots) that repel these sites are identified through the most consistent m6A sites’ enrichment analysis. (B) Twenty m6A-binding RBPs (red dots) that prefer binding to unique m6A sites and eight m6A-binding RBPs (blue dots) that repel unique m6A sites are identified through unique m6A sites’ enrichment analysis. (C) Overlap analysis of m6A-binding proteins that prefer binding to consistent m6A sites. (D) Overlap analysis of m6A-binding proteins that prefer binding to unique m6A sites. (E) The affinity of 38 m6A-binding proteins to m6A sites of eight consistency levels in eight adult tissues. The thresholds: (1) odds ratio ≥ 1.2 or odds ratio ≤ 0.8; (2) relative contribution > 0.2 was used to identify RBPs with preference for m6A sites. Pearson residuals were used for showing preferential binding or avoidance.
Interestingly, we observed a high degree of inverse correlation in RBP preferences: RBPs enriched at consistent m6A sites tended to be depleted at unique m6A sites, and vice versa (Fig. 2C,D). We further examined the preference levels of these identified 38 RBPs for m6A sites across a range of consistency levels (hT-1 to hT-8 m6A sites). The results revealed that eight RBPs exhibited a preference for relatively consistent m6A sites (hT-7 and hT-8 m6A sites), while 30 RBPs exhibited a preference for m6A sites with relatively low consistency (hT-1 to hT-6 m6A sites), suggesting their potential as m6A-binding proteins (Fig. 2E).
Similar analyses were performed on eight human fetal tissues (Supplemental Fig. 11), 14 adult tissues (Supplemental Fig. 12), and eight human cell lines (Supplemental Fig. 13). These analyses consistently identified known m6A readers (e.g., YTHDF1–3, RBM15, YTHDC1) as preferentially binding to highly consistent m6A sites, while newly identified RBPs showed a preference for unique m6A sites. These results demonstrate that m6A site consistency is a significant determinant of RBP binding and suggest a general principle of m6A-mediated regulation, where conserved m6A sites are recognized by known readers to mediate core cellular functions, while unique m6A sites are targeted by novel readers to regulate context-specific processes.
Novel potential m6A-binding proteins interact with known m6A regulators
To further investigate the functional roles of RBPs showing differential preferences for m6A sites, we examined their overlap across different data sets. Specifically, we compared the RBPs identified in human cell lines with those identified in two types of adult human tissues and one type of fetal tissue (Fig. 3A,B). We identified nine RBPs that consistently showed enrichment at highly consistent m6A sites across multiple data sets. Among these, YTHDF1, YTHDF2, and RBM15 were found in both cell lines and all three tissue types. RBM15B was unique to adult tissues (PRJNA506210), while CPSF6 was unique to cell lines. We also identified 40 RBPs that consistently showed enrichment at unique m6A sites. Among these, nine RBPs (BUD13, DDX3X, DROSHA, EFTUD2, GEMIN5, GTF2F1, NCBP2, PPIG, and PRPF8) were identified in both human cell lines and the three types of human tissues. Additional RBPs were unique to specific tissues: six to adult tissues (GPKOW, NOL12, SND1, U2AF1, UCHL5, and EIF3A), four to fetal tissues (EIF3D, FKBP4, DDX59, and XRCC6), and three to cell lines (SERBP1, GRSF1, and TRA2A).
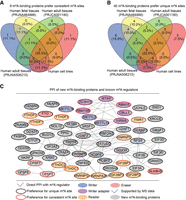
Overlap analysis and protein–protein interaction network of m6A-binding proteins identified in human cell lines and three types of human tissues. (A) Overlap analysis of nine m6A-binding proteins that prefer binding to consistent m6A sites. (B) Overlap analysis of 40 m6A-binding proteins that prefer binding to unique m6A sites. (C) Experimentally determined protein-protein interactions between newly identified m6A-binding proteins (gray) and known m6A regulators (other colors). (PPI) Protein-protein interaction. (MS) Mass spectrometry.
To explore potential functional relationships, we constructed protein–protein interaction (PPI) networks between potential m6A-binding proteins and known m6A regulators, including writers, readers, and erasers (Fig. 3C). This analysis revealed several interesting connections. For instance, the RNA helicase DDX3X, which was enriched at unique m6A site, interacted with the m6A demethylase ALKBH5 (Shah et al. 2017; Xiong et al. 2021), suggesting a potential role for DDX3X in recruiting ALKBH5 to demethylate these specific m6A sites. Several other RBPs enriched at unique m6A sites (U2AF2, EFTUD2, SERBP1, CPSF5/NUDT21, PRPF8, TRA2A, HNRNPK, NCBP2, and PCBP2) interacted with known m6A writers or readers, suggesting their potential role as “adapter” proteins, facilitating the recruitment of m6A machinery to specific RNA targets. A complex was formed by five splicing factors (PRPF8, SRSF1, SF3B4, U2AF2, and SF3A3) that were enriched at unique m6A sites, with PRPF8 interacting with YTHDC2, suggesting a potential link between m6A-mediated regulation and pre-mRNA splicing. Four translation initiation factors (EIF3A, EIF3B, EIF3D, and EIF3G), also enriched at unique m6A sites, formed a separate complex, with EIF3B interacting with the RNA helicase DDX3X, suggesting the regulatory role of unique m6A sites in mRNA translation initiation.
Additionally, two m6A-binding proteins, CPSF6 and CPSF7, involved in the cleavage and polyadenylation of mRNA precursors, were enriched at highly consistent m6A sites. These proteins formed a complex with CPSF5 and interacted with the nuclear m6A reader proteins YTHDC1 and YTHDC2. In contrast, the demethylase FTO, which showed enrichment at unique m6A sites, did not interact with the known m6A regulators or the other potential m6A-binding proteins in our network, suggesting that FTO may regulate unique m6A sites independently of other m6A machinery. Notably, previous work using in vitro m6A RNA probe pull-down and protein mass spectrometry experiments identified a total of 19 novel m6A-binding proteins that predominantly bound to unique m6A sites in our analysis (Arguello et al. 2017; Edupuganti et al. 2017; Huang et al. 2021). These independent experimental findings provide further support for our computational identification of novel m6A-binding proteins that preferentially target unique m6A sites (Yang et al. 2018).
Relationship between m6A consistency and gene expression
To investigate the relationship between gene expression and m6A modification, we leveraged the matched m6A-seq and RNA-seq data from multiple data sets, allowing us to directly correlate m6A site consistency with gene expression levels. In the eight adult tissues (PRJNA506210), we identified 30,996 mRNA-consistent m6A sites and 16,495 mRNA-unique m6A sites (Fig. 4A,B). For lncRNA, we identified 3203 consistent m6A sites and 3306 unique m6A sites (Fig. 4C,D).
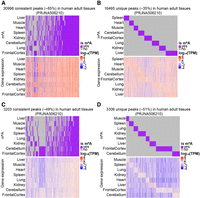
mRNA and lncRNA m6A modification and gene expression profiles in eight different adult tissues. (A) mRNA-consistent m6A sites and expression levels of genes marked by these sites. (B) mRNA-unique m6A sites and expression levels of genes marked by these sites. (C) lncRNA-consistent m6A sites and expression levels of genes marked by these sites. (D) lncRNA-unique m6A sites and expression levels of genes marked by these sites. Rows denote different tissues, and columns denote different m6A sites (upper panel) and genes marked by these sites (lower panel).
The number of mRNA-consistent m6A sites in individual tissues ranged from ∼16,000 to 21,000, with the highest number observed in the frontal cortex (21,384) (Supplemental Fig. 14A). The number of mRNA-unique m6A sites ranged from ∼1300 to 3600, with the frontal cortex having the second highest number (2332) (Supplemental Fig. 15A). As for lncRNA, consistent m6A sites ranged from ∼1000 to 2200, with the frontal cortex exhibiting the most sites (2246) (Supplemental Fig. 16A), while lncRNA-unique m6A sites varied from 175 to 1000, with the highest number found in the frontal cortex (1000) (Supplemental Fig. 17A). Notably, the frontal cortex had the highest number of m6A sites compared to the other seven tissues, suggesting a crucial role of m6A modification in regulating gene expression in this brain region. Furthermore, the expression of genes marked by mRNA-consistent m6A sites exhibited significantly lower variance across tissues compared to genes without m6A sites or genes marked by unique m6A sites. A similar trend was also observed for lncRNA-consistent and lncRNA-unique m6A sites (Fig. 4C,D).
We observed similar patterns across a broader range of samples, including eight human fetal tissues (PRJNA464886), 14 adult tissues (PRJCA001180), eight human cell lines, 11 mouse tissues, and six mouse cell lines (Supplemental Fig. 14–22). Notably, the cerebrum in adult tissues and the midbrain in mouse tissues exhibited the highest number of mRNA- and lncRNA-unique m6A sites, highlighting the importance of dynamic m6A modifications in regulating specialized brain functions (Supplemental Figs. 15C,E, 17C,E).
To distinguish between m6A sites arising from tissue-specific gene expression versus those arising from differences in m6A, we categorized m6A sites as either transcriptome-specific or epitranscriptome-specific (see Materials and Methods for details). We found that only a small proportion of unique m6A sites were transcriptome-specific: ∼3%–13% for mRNA and ∼6%–15% for lncRNA in human tissues (Supplemental Fig. 23A–C), and ∼9% for mRNA and ∼20% for lncRNA in human cell lines (Supplemental Fig. 23D); and ∼3% and ∼7% for mRNA and lncRNA, respectively, in mouse tissues, and ∼10% and ∼21%, respectively, in mouse cell lines (Supplemental Fig. 23E,F). Furthermore, transcriptome-specific unique m6A sites showed no significant enrichment in any specific region of the mRNA (5′ UTR, CDS, and 3′ UTR) (Supplemental Fig. 23), suggesting that tissue-specific gene expression is not the primary driver of unique m6A site occurrence.
m6A consistency correlates positively with gene expression homeostasis
Based on previous findings linking m6A to gene expression homeostasis (Xiao et al. 2019) and our observation of lower expression variance for genes with consistent m6A sites, we hypothesized that the degree of m6A site consistency across tissues/cell lines would quantitatively correlate with the stability of gene expression. To further investigate this relationship, we categorized m6A sites into three consistency levels: Low (present in only a few tissues/cell lines), Middle (present in an intermediate number of tissues/cell lines), and High (present in the majority of tissues/cell lines) (see Materials and Methods for details). We then assessed the expression stability of genes marked by these different categories of m6A sites using the Tau value, a metric of tissue specificity where lower values indicate broader expression and higher values indicate tissue-restricted expression (Kryuchkova-Mostacci and Robinson-Rechavi 2017).
We first examined the relationship between mRNA m6A sites consistency and mRNA gene expression homeostasis. In eight human fetal tissues, genes marked by mRNA m6A sites with higher consistency levels displayed lower Tau values, indicating more stable expression levels across tissues (Fig. 5A). Furthermore, this positive correlation between mRNA m6A site consistency and mRNA gene expression homeostasis was also observed in eight adult tissues (PRJNA506210), 14 adult tissues (PRJCA001180), eight human cell lines, 11 mouse tissues, and six mouse cell lines (Fig. 5B–F), underscoring a potentially conserved regulatory principle linking consistent m6A modification to the maintenance of stable gene expression for core cellular functions. Next, we investigated the relationship between lncRNA m6A sites consistency and lncRNA gene expression homeostasis. Similar to mRNA, the consistency level of lncRNA m6A sites exhibited a positive correlation with lncRNA gene expression homeostasis in both humans and mice (Supplemental Fig. 24).
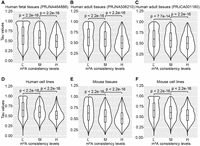
mRNA m6A consistency levels positively correlated with gene expression homeostasis. (A) Relative expression stability of m6A-modified genes (L, M, and H sets containing 8735, 4242, and 5279 mRNA genes, respectively) among eight different human fetal tissues. (B) Relative expression stability of m6A-modified genes (L, M, and H sets containing 12,228, 5824, and 7130 mRNA genes, respectively) among eight different adult tissues. (C) Relative expression stability of m6A-modified genes (L, M, and H sets containing 10,470, 5104, and 6842 mRNA genes, respectively) among 14 different adult tissues. (D) Relative expression stability of m6A-modified genes (L, M, and H sets containing 10,031, 4769, and 4442 mRNA genes, respectively) among eight different human cell lines. (E) Relative expression stability of m6A-modified genes (L, M, and H sets containing 12,906, 3913, and 2913 mRNA genes, respectively) among 11 different mouse tissues. (F) Relative expression stability of m6A-modified genes (L, M, and H sets containing 10,653, 4754, and 4449 mRNA genes, respectively) among six different mouse cell lines. Significance was evaluated by two-sided Mann–Whitney test.
To determine if the observed correlation was dependent on the location of the m6A site within the transcript, we examined different regions of mRNA (5′ UTR, CDS, and 3′ UTR) separately. We found that the positive correlation between m6A consistency and expression homeostasis held true for m6A sites within each region (Supplemental Figs. 25, 26), indicating the relationship we found was independent to the relative position of m6A. Overall, these results demonstrate a positive association between m6A consistency level and gene expression homeostasis across diverse human and mouse tissues and cell lines, strongly suggesting a role for conserved m6A sites in ensuring the stable expression of genes fundamental to cellular identity and function.
METTL3 preferentially binds promoters of genes with consistent m6A sites and high CpG density
Given that m6A deposition is largely cotranscriptional, the localization and binding preferences of the core m6A writer enzyme, METTL3, may provide clues about how different m6A sites are established and regulated. METTL3 can directly or indirectly interact with the genome to regulate chromatin states and transcription processes (Huang et al. 2019; Li et al. 2020; Liu et al. 2020; Xu et al. 2021). To investigate its binding preferences, we first mapped the binding sites of METTL3 on the genome (Supplemental Figs. 27, 28). In HeLa cells, we identified 3477 METTL3 binding sites. Approximately 96% of these sites were located within the gene promoter region and were highly concentrated around the transcription start site (TSS) (Supplemental Fig. 27), consistent with its role in cotranscriptional m6A deposition. In mESCs, we identified 16,169 METTL3 binding sites, with ∼46% located in gene promoter regions, also showing a strong enrichment near the TSS (Supplemental Fig. 28). These findings confirm that METTL3 preferentially binds gene promoters, particularly near the TSS.
To investigate whether METTL3 binding is associated with m6A site consistency, we classified the 2907 protein-coding genes identified in HeLa cells into three categories: genes marked by consistent m6A sites (“consistent genes”), genes marked by unique m6A sites (“unique genes”), and genes marked by both types of m6A sites (“both genes”). In human tissues obtained from three distinct research groups (PRJNA506210, PRJNA464886, and PRJCA001180) and human cell lines, METTL3 showed significantly higher binding affinity to promoters of “consistent genes” and “both genes” compared to “unique genes” (Fig. 6). We then classified the 5250 protein-coding genes detected in mESCs into the same three categories. Consistent with the findings in human tissues and cell lines, METTL3 exhibited a higher binding affinity to promoters of “both genes” compared to “unique genes” in mouse tissues and cell lines. However, no significant difference in METTL3 binding was observed between “consistent genes” and “unique genes” (Supplemental Fig. 29). This might suggest potential species-specific nuances in METTL3 recruitment or regulation, although the overall trend points toward METTL3 involvement with genes bearing consistent m6A.
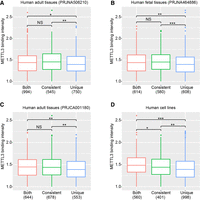
Binding intensity of METTL3 on three types of genes for HeLa. (A–D) The METTL3-binding genes in HeLa were classified into three categories, and METTL3 binding intensity is shown for the adult tissues (A, C), human fetal tissues (B), and human cell lines (D). Significance was evaluated by two-sided Mann–Whitney test. (*) P-value between 0.01 and 0.05; (**) P-value <0.01; (***) P-value <0.001. (NS) No significant difference. The numbers in parentheses denote the number of genes.
To interrogate the biological functions of METTL3-bound genes, we identified protein-coding genes bound by METTL3 in HeLa cells, which were also marked by the most consistent m6A sites. The results of gene function enrichment analysis indicated that these genes are involved in histone modification and the Wnt signaling pathways in human tissues, and in histone modification and methylation pathways in human cell lines (Supplemental Fig. 30). These pathways are often involved in fundamental cellular processes and development, aligning with the idea that consistent m6A sites contribute to the stable expression of core functional genes.
Since m6A deposition is a cotranscription-dependent process and the promoter region of m6A host genes can influence m6A regulation (Xiao et al. 2019; Zhou et al. 2019; He and He 2021), we investigated the relationship between m6A and the CpG density of the m6A host gene promoter region. Similar to the classification method described earlier, m6A sites are categorized into three consistency levels: low, middle, and high (see Materials and Methods for details). In eight adult tissues (PRJNA506210), the consistency levels of mRNA m6A sites were positively associated with the CpG density of the promoter region in the corresponding genes (Supplemental Fig. 31A). This positive correlation was also observed in eight fetal tissues, 14 adult tissues (PRJCA001180), eight human cell lines, 11 mouse tissues, and six mouse cell lines (Supplemental Fig. 31B–F). Similarly, higher consistency levels of lncRNA m6A sites were also associated with higher CpG density in their respective gene promoter regions (Supplemental Fig. 32). This positive correlation was consistent across human and mouse tissues and cell lines. Furthermore, when considering different regions of mRNA (5′ UTR, CDS, and 3′ UTR), we found that the consistency level of m6A sites within each region was positively correlated with the CpG density of the corresponding mRNA gene promoter regions (Supplemental Figs. 33, 34).
Based on these findings, we hypothesize that METTL3 preferentially binds to gene promoter regions characterized by higher CpG density. To test this, we divided protein-coding genes bound by METTL3 into two categories: those with high CpG density promoters (high) and those with low CpG density promoters (low). The results demonstrated that METTL3 displays a preference for binding to gene promoter regions with higher CpG density in both HeLa cells and mESCs (Supplemental Fig. 35). This provides a potential mechanism linking METTL3 recruitment to the establishment of consistent m6A marks on genes with specific promoter features. We also examined the quality of METTL3 ChIP-seq data from two human cell lines (IMR-90 and MOLM-13). However, these data sets exhibited low signal-to-noise ratios and inconsistent peak profiles, making them unsuitable for reliable analysis (Supplemental Figs. 36, 37). In summary, our results demonstrate that METTL3 preferentially binds to gene promoters, particularly near the TSS and those with high CpG density. This binding preference correlates with the presence of consistent m6A sites on the transcripts originating from these genes. These findings suggest a mechanistic model where METTL3 is guided to specific genomic locations (CpG-rich promoters) to cotranscriptionally install m6A marks that are maintained across cell types and contribute to gene expression homeostasis.
DISCUSSION
Understanding the functional landscape of m6A modification requires robust and comprehensive data sets. While m6A-seq has been widely adopted, inherent technical variability necessitates rigorous quality control (Slama et al. 2019; McIntyre et al. 2020). In this study, we addressed this challenge by systematically evaluating 193 m6A-seq data sets and establishing practical quality metrics (NRF, PBC, and FRiP). These metrics not only facilitated the curation of a large-scale, high-confidence m6A map across diverse mammalian contexts, but also provide a valuable resource for the community to assess future m6A-seq experiments. This extensive, quality-controlled data set provides an unprecedented foundation to dissect the heterogeneity of m6A sites and explore the biological significance underlying their conservation patterns.
A key finding of our study is that m6A sites can be stratified based on their consistency across tissues and cell lines, revealing distinct features strongly correlated with biological function. We demonstrate that highly consistent m6A sites, predominantly located near stop codons, mark genes exhibiting high expression stability. This strongly suggests a fundamental role for these conserved m6A marks in maintaining gene expression homeostasis, likely ensuring the reliable production of proteins and functional RNAs essential for core cellular identity and function across diverse biological contexts. Conversely, low-consistency or unique m6A sites mark genes with more variable expression. Our finding that tissue-specific gene expression accounts for only a minor fraction of these unique sites points toward active, context-specific regulation at the epitranscriptomic level. These dynamic m6A marks may be crucial for fine-tuning gene expression during development, differentiation, or in response to specific environmental stimuli, contributing to cellular plasticity and specialized functions. Further investigation into the “writers” and “erasers” preferentially acting at these sites is warranted.
The distinct biological roles suggested by m6A consistency are further supported by differential interactions with RNA-binding proteins. Our analysis identified two broad classes of RBPs: known m6A readers (e.g., YTHDF1–3, IGF2BP1, YTHDC1, RBM15/B) preferentially binding to high-consistency sites, and a larger set of potential novel m6A-interacting proteins enriched at low-consistency/unique sites. The preference of YTHDF1–3 and IGF2BPs for consistent sites aligns perfectly with their established roles in modulating mRNA stability and translation, reinforcing the link between conserved m6A and expression homeostasis. The enrichment of CPSF6/7 (involved in polyadenylation) at consistent sites near stop codons further suggests a role for conserved m6A in regulating 3′ end processing or nuclear export via interactions with nuclear readers like YTHDC1. Conversely, the association of unique m6A sites with factors like EIF3 components and the helicase DDX3X (which interacts with ALKBH5) points toward roles in regulating translation initiation or dynamic demethylation. The enrichment of splicing factors at unique sites also suggests context-specific regulation of splicing mediated by m6A. We found that the proportion of adenine residues within high-consistency m6A regions was significantly higher than the proportion of adenine residues within regions identified as unique m6A sites (Supplemental Fig. 38), suggesting that regions with a higher density of adenine residues may be more likely to contain multiple m6A modifications, thereby influencing the binding of RNA-binding proteins. These RBPs enriched at unique sites represent exciting candidates for novel m6A effectors that mediate tissue-specific or condition-specific responses.
Our findings provide a potential mechanism for the establishment of conserved m6A patterns. We demonstrate that METTL3, the core m6A writer, preferentially binds to promoter regions, particularly those with high CpG density, and that these promoters belong to genes harboring high-consistency m6A sites. This suggests a model where METTL3 is recruited to CpG-rich promoters, potentially via interactions with chromatin factors or specific DNA sequences, to efficiently deposit m6A marks cotranscriptionally onto nascent transcripts destined for stable expression. This links a specific genomic feature (promoter CpG density) directly to the establishment of a conserved epitranscriptomic mark. The presence of METTL3 at promoters, beyond its canonical role on RNA, raises intriguing questions. It is possible that promoter-bound METTL3 directly influences transcription initiation or chromatin state, perhaps independently of its catalytic activity, or its localization simply ensures efficient cotranscriptional methylation. Furthermore, METTL3 binding at the promoter may somehow “prime” the transcript for subsequent m6A deposition events. Distinguishing these possibilities represents an important avenue for future research.
While antibody-based methods like m6A-seq remain widely used, antibody-independent detection methods, such as MAZTER-seq, m6A-REF-seq, GLORI, and eTAM-seq, offer the potential for m6A identification with higher resolution. The m6A sites should be validated using multiple antibody-independent methods. However, at present, data sets generated using these methods are largely limited to a few model cell lines, precluding a comprehensive cross-validation across the diverse tissues and cell lines analyzed in our study. To address this concern to the extent possible, we performed a cross-validation analysis using publicly available GLORI data from HeLa cells (Liu et al. 2023). We compared the m6A sites identified in our analysis of human tissues and cell lines with the m6A sites identified in the HeLa GLORI data set. We found that the overlap ratio between our identified unique m6A sites (those found in only one tissue/cell line) and the HeLa GLORI sites ranged from 11% to 16% (Supplemental Fig. 39). As the consistency of the m6A sites increased (i.e., as they were found in more tissues/cell lines), the overlap ratio with the HeLa GLORI data also increased, reaching 78%–89% for the most consistent m6A sites (Supplemental Fig. 39). While the relatively low overlap for unique sites might initially seem concerning, it is important to consider that the GLORI data are derived from a single-cell line (HeLa), whereas our unique m6A sites are specific to different tissues or cell lines. Therefore, a substantial portion of the nonoverlapping unique sites likely reflects genuine biological differences in m6A distribution between HeLa cells and the various tissues/cell lines in our study. However, we cannot rule out the possibility that some of the nonoverlapping unique sites represent false positives in our m6A-seq data. The increasing overlap with increasing consistency strongly suggests that our identified consistent m6A sites are highly reliable. Future studies using antibody-independent methods across a wider range of tissues and cell lines will be crucial for further validating and refining our understanding of m6A site distribution and consistency.
While our study provides a comprehensive view based on site consistency, we acknowledge certain limitations. The binary classification of site presence or absence across samples is a simplification; factors like varying modification stoichiometry, alternative splicing, and detection sensitivity could influence consistency measures. Future studies incorporating quantitative m6A mapping and single-cell approaches will refine our understanding. Furthermore, while our analyses reveal strong correlations between consistency, RBP binding, and promoter features, causal relationships require direct experimental validation, particularly for the newly identified potential m6A-binding proteins.
In conclusion, our comprehensive analysis of m6A-seq data reveals distinct characteristics of m6A sites based on their conservation across tissues and cell lines. These findings highlight the complex interplay between m6A modification, gene expression, RBP interactions, and promoter features, providing valuable insights into the diverse regulatory roles of m6A in mammalian transcriptomes.
MATERIALS AND METHODS
Data source
The m6A-seq and corresponding RNA-seq sequencing data were downloaded from GEO (Barrett et al. 2013), EBI (Cantelli et al. 2022), and GSA (CNCB-NGDC Members and Partners 2022). Details of m6A-seq sequencing data from human cell lines, human tissues, mouse cell lines, and mouse tissues were provided in Supplemental Tables 1–4. ChIP-seq sequencing data of human cell lines and mESCs were downloaded from GEO and EBI databases, and details are shown in Supplemental Table 5.
The human and mouse genome sequences and annotation files were downloaded from GENCODE (Frankish et al. 2021). The binding sites of 171 RBPs were downloaded from the POSTAR2 database (Zhao et al. 2022).
Reads alignment
The trimfastq.py (https://github.com/georgimarinov/GeorgiScripts) script (Marinov and Shipony 2021) was used to extract the first 36 bp of the read sequence in the FastQ file. FastQC (https://www.bioinformatics.babraham.ac.uk/projects/fastqc/) was used to check the quality of the reads. HISAT2 (Kim et al. 2019) was used to align reads to the mouse or human genome. For paired-end sequencing, we used the parameters “‐‐no-mixed ‐‐no-discordant ‐‐no-unal.” For single-end sequencing, we used “‐‐no-unal.” SAMtools (http://www.htslib.org/doc/samtools.html) was used to convert SAM files into BAM files. To avoid bias, we removed reads mapped to the mitochondrial genome. We used the infer_experiment.py script in the RSeQC package to infer whether RNA-seq and m6A-seq libraries are strand-specific (Wang et al. 2012). If the library was strand-specific, we divided the BAM file into two files (forward and reverse) according to the SAM flag. We used the bamCoverage tool in deepTools (Ramirez et al. 2016) to convert BAM files into bigwig files. We visualized read signal distribution using IGV (Thorvaldsdottir et al. 2013).
m6A sites detection
We used BEDTools (Quinlan and Hall 2010) to convert BAM files into BED files, MACS2 (Zhang et al. 2008) to detect m6A sites, and the parameter of “-g hs -f BEDPE -p 1e-1 ‐‐keep-dup all ‐‐nomodel ‐‐min-length 150 ‐‐max-gap 50” was set. We changed the parameter to “-g mm” for the mouse genome. For samples with strand-specific library construction, m6A sites were detected separately by aligning reads to the positive and negative strands of the genome. We used the IDR framework (Marinov and Shipony 2021) to identify co-occurring m6A sites between replicate samples. The IDR framework does not rely on artificial P-value settings. We used IGV to check whether the m6A site was credible.
m6A site annotation, distribution pattern analysis, and motif analysis
ChIPseeker (Yu et al. 2015) was used to annotate the detected m6A site to the gene, and IGV was used to check the accuracy of the annotation. The MetaPlotR pipeline (Olarerin-George and Jaffrey 2017) was used to analyze the distribution pattern of m6A sites on the transcriptome. The script findMotifsGenome.pl in HOMER (http://homer.ucsd.edu/homer/motif/) software was used to check the m6A site–enriched motif sequences.
m6A-seq library quality evaluation
The metrics NRF, PBC1, PBC2, and FRiP defined by ENCODE were used to evaluate library quality. The URL is https://www.encodeproject.org/data-standards/terms/#library, where NRF, PBC1, and PBC2 were used to assess library complexity. FRiP was used to evaluate antibody enrichment efficiency.
-
rRNA contamination rate M0
 (1)
(1)
-
NRF
 (2)
(2)
-
PBC1
 (3)
(3)
-
PBC2
 (4)
(4)
-
FRiP
 (5)
(5)
RNA-seq data analysis
featureCounts (Liao et al. 2014) was used to calculate the count of reads mapped to the gene, and R script was used to calculate the gene expression transcripts per million (TPM) value.
Classifying m6A sites into different consistency levels
The BEDTools command was used to merge m6A sites. The parameters are “-s -d 10 -c 4,6 -o collapse, collapse.” Based on the number of cell lines or tissues, m6A sites were classified into different consistency levels. In the section “Relationship between m6A consistency and gene expression,” we classified m6A sites into mRNA- or lncRNA-consistent m6A sites and mRNA- or lncRNA-unique m6A sites. m6A sites present simultaneously in at least two tissues or cell lines are defined as mRNA- or lncRNA-consistent m6A sites. m6A sites present only in one tissue or cell line are defined as mRNA- or lncRNA-unique m6A sites.
In the sections “m6A consistency correlates positively with gene expression homeostasis” and “METTL3 preferentially binds promoters of genes with consistent m6A sites and high CpG density,” m6A sites are classified into three categories. For eight adult tissues (PRJNA506210), m6A sites present in one to three tissues are defined as Low-consistency m6A sites (L); m6A sites present in four to six tissues are defined as Middle-consistency m6A sites (M); and m6A sites present in seven to eight tissues are defined as High-consistency m6A sites (H). For eight fetal tissues (PRJNA464886), the classification method is the same as for eight adult tissues. For 14 adult tissues, m6A sites present in one to five tissues are defined as Low-consistency m6A sites (L); m6A sites present in six to 10 tissues are defined as Middle-consistency m6A sites (M); and m6A sites present in 11–14 tissues are defined as High-consistency m6A sites (H). For eight human cell lines, m6A sites present in one to three cell lines are defined as Low-consistency m6A sites (L); m6A sites present in four to six cell lines are defined as Middle-consistency m6A sites (M); and m6A sites present in seven to eight cell lines are defined as High-consistency m6A sites (H). For 11 mouse tissues, m6A sites present in one to three tissues are defined as Low-consistency m6A sites (L); m6A sites present in four to seven tissues are defined as Middle-consistency m6A sites (M); and m6A sites present in eight to 11 tissues are defined as High-consistency m6A sites (H). For six mouse cell lines, m6A sites present in one to two cell lines are defined as Low-consistency m6A sites (L); m6A sites present in three to four cell lines are defined as Middle-consistency m6A sites (M); and m6A sites present in five to six cell lines are defined as High-consistency m6A sites (H).
Tissue- or cell-specific m6A sites analysis
m6A sites only present in one tissue or cell line are defined as unique m6A sites. Unique m6A sites are classified into two categories according to whether the genes marked by the unique m6A sites are exclusively expressed in the specific tissue or cell line. Unique m6A sites produced by gene-specific expression are defined as transcriptome-specific unique m6As. Unique m6A sites resulting from epitranscriptome regulation are defined as epitranscriptome-specific unique m6As. Tissue- or cell line–specific gene expression is defined as the expression level in this tissue or cell line being more than 10 times higher than in other tissues or cell lines.
Gene expression homeostasis analysis
The tissue-specific index Tau value (Kryuchkova-Mostacci and Robinson-Rechavi 2017) was used to measure gene expression homeostasis among tissues or cell lines.
 (6)
xi represents the TPM value of the gene in tissue i, and n represents the number of tissues. The lower the Tau value, the more stable the gene expression level is between tissues or
cell lines.
(6)
xi represents the TPM value of the gene in tissue i, and n represents the number of tissues. The lower the Tau value, the more stable the gene expression level is between tissues or
cell lines.
CpG density of gene promoter region
We defined 1000 bp upstream of and 100 bp downstream from the TSS as the gene promoter region. For genes with multiple TSS,
the average CpG o/e ratio is used as the CpG o/e ratio of the gene. We used the script CpGoe.pl in the Notos tool (Bulla et al. 2018) to calculate the CpG o/e ratio of each gene promoter region. The calculation method was as follows:
 (7)
#C, #G, and #CpG represent the number of C, G, and CG bases in the promoter sequence, respectively, and l represents the length of the promoter sequence.
(7)
#C, #G, and #CpG represent the number of C, G, and CG bases in the promoter sequence, respectively, and l represents the length of the promoter sequence.
Enrichment analysis between RBP binding sites and m6A sites of varying consistency levels
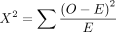
To identify novel m6A-binding proteins that prefer m6A sites of different consistency levels, we performed enrichment analysis of overlapping sites between m6A sites and RBP binding sites. The 171 RBP binding sites were downloaded from the POSTAR2 database, and then the χ2 test (McHugh 2013) was used to conduct enrichment analysis. The steps are as follows:
-
Calculate the Observed Counts Matrix O. Use the BEDTools intersect command to calculate the number of overlapping sites between 171 RBP binding sites and m6A sites of different consistency levels. The number of overlapping sites is the observed number and is named O (Observed) matrix. The matrix rows represent m6A sites with different consistency levels, and the matrix columns represent 171 RBPs protein binding sites. Each cell in the matrix contains the observed number of overlaps between the binding sites of a specific RBP and the m6A sites of a specific consistency level.
-
Calculate the Expected Counts Matrix E. Use the R function chisq.test to calculate the expected number of overlapping sites. The function calculates the expected number of overlapping sites for each cell in the matrix O, based on the row and column totals. The formula for calculating E is:
 (8)
(8)
E represents the expected number of overlapping sites between RBP binding sites such as YTHDF1 and m6A sites of a specific consistency level. MR represents the sum of the O matrix row, and MC represents the sum of the O matrix column. n represents the sum of overlapping sites between RBP binding sites and m6A sites.
-
Calculation of odds ratio
 (9)
(9)
-
Calculation of Pearson residuals (r)
 (10)
(10)
-
Calculation of the χ2 statistic X2
 (11)
(11)
-
Calculation of Relative contribution
 (12)
(12)
To identify potential m6A-binding proteins, we used the following thresholds: (1) odds ratio ≥ 1.2 or odds ratio ≤ 0.8 and (2) relative contribution > 0.2.
Protein–protein interaction network analysis
We used the STRING database (Szklarczyk et al. 2021) to construct an interaction network between potential m6A-binding proteins and known m6A regulators (writer, reader, and eraser), retaining only experimentally confirmed interaction information. Interaction networks were visualized using Cytoscape (Killcoyne et al. 2009).
ChIP-seq data analysis
The trimfastq.py script was used to extract the first 36 bp of the read sequence. FastQC was used to check the read quality. Reads were mapped to the human or mouse genome using Bowtie2 (Langmead and Salzberg 2012). The bamCoverage tool in deepTools was used to convert the BAM file into a bigwig file. computeMatrix and plotHeatmap tools were used to analyze the distribution of read signals in the gene body region. IGV was used to visualize read signal distribution. MACS2 was used to detect the binding sites of the target protein on the genome, and ChIPseeker to examine the distribution pattern of binding sites in different genomic regions.
The distribution pattern of m6A on lncRNA
The distribution pattern of RNA m6A on lncRNA was analyzed using the MetaPlotR pipeline (Olarerin-George and Jaffrey 2017). First, the positions of m6A sites on lncRNA were calculated, and the position coordinates were normalized to the 0–1 interval, where 0 represents the 3′ end of the lncRNA, and 1 represents the 5′ end. Finally, the density distribution plot was obtained using the geom_density() function in the ggplot2 R package (Ito and Murphy 2013). The results are shown in Supplemental Figures 9 and 10. For eight adult tissues, eight fetal tissues, and eight human cell lines, m6A sites were classified into three categories: m6A sites that exist only in one tissue or cell line, termed Unique m6A sites; m6A sites that exist simultaneously in all eight tissues or cell lines, termed the most consistent m6A sites; and m6A sites that exist in two to seven tissues or cell lines, termed Relatively consistent m6A sites. For 14 adult tissues, m6A sites were classified into three categories: m6A sites that exist only in one tissue, termed Unique m6A sites; m6A sites that exist simultaneously in all 14 tissues, termed the most consistent m6A sites; and m6A sites that exist in two to 13 tissues, termed Relatively consistent m6A sites. For 11 mouse tissues, m6A sites were classified into three categories: m6A sites that exist only in one tissue, termed Unique m6A sites; m6A sites that exist simultaneously in all 11 tissues, termed the most consistent m6A sites; and m6A sites that exist in two to 10 tissues, termed Relatively consistent m6A sites.
Functional enrichment analysis of METTL3-bound protein-coding genes
Functional enrichment analysis was conducted using METTL3-bound protein-coding genes in HeLa cells (PRJNA464886). The overlap analysis was conducted between 2907 METTL3-bound protein-coding genes in HeLa cells (as shown in Supplemental Fig. 27) and genes marked by the most consistent m6A sites in human tissues and cell lines. Functional enrichment analysis was performed on the overlapping genes. GO term enrichment was conducted using the enrichGO function in the clusterProfiler package (Yu et al. 2012), with parameters set as OrgDb = “org.Hs.eg.db,” ont = “BP,” pAdjustMethod = “BH,” minGSSize = 10, maxGSSize = 500, and qvalueCutoff = 0.1. The results are shown in Supplemental Figure 30.
The calculation of the adenine (A) proportion
First, the RNA sequences of the m6A sites were extracted using the bedtools getfasta command with the parameters -s, -name, and -rna. Then, the number of adenine bases (A) at the m6A sites was counted and denoted as n. Subsequently, the total number of bases at the m6A sites was calculated and denoted as N. Finally, the adenine proportion was determined by the formula n/N × 100. The results are shown in Supplemental Figure 38.
Cross-validation of m6A sites
The m6A sites (GSM6432595_Hela-1, containing 137,662 m6A single-base sites) detected in HeLa cells using the GLORI method (Liu et al. 2023) were used to cross-validate m6A sites with different consistency levels in human tissues and cell lines. The intersection of the two sets of m6A sites (137,662 m6A single-base sites in HeLa cell and m6A sites with different consistency levels in human tissues and cell lines) was obtained using the bedtools intersect command. The number of m6A sites overlapping with 137,662 m6A single-base sites was recorded as A, and the total number of m6A sites with different consistency levels was recorded as B. The overlap ratio was calculated as A/B × 100. The calculation results are shown in Supplemental Figure 39.
Statistical analysis and visualization
Use the R function wilcox.test to test significant differences between two samples. The results were visualized using the R package ggplot2 (Ito and Murphy 2013). Heat maps were generated using the R package ComplexHeatmap (Gu et al. 2016).
SUPPLEMENTAL MATERIAL
Supplemental material is available for this article.
ACKNOWLEDGMENTS
This work was supported by the National Key R&D Program of China (2022YFC3400400 and 2022YFA0912900), National Natural Science Foundation of China (32425034, 92253202, 32271499, 32270644, and 32100461), and Shenzhen Bay Scholars Program.
Footnotes
-
Article is online at http://www.rnajournal.org/cgi/doi/10.1261/rna.080222.124.
- Received August 9, 2024.
- Accepted April 4, 2025.
This article is distributed exclusively by the RNA Society for the first 12 months after the full-issue publication date (see http://rnajournal.cshlp.org/site/misc/terms.xhtml). After 12 months, it is available under a Creative Commons License (Attribution-NonCommercial 4.0 International), as described at http://creativecommons.org/licenses/by-nc/4.0/.




