


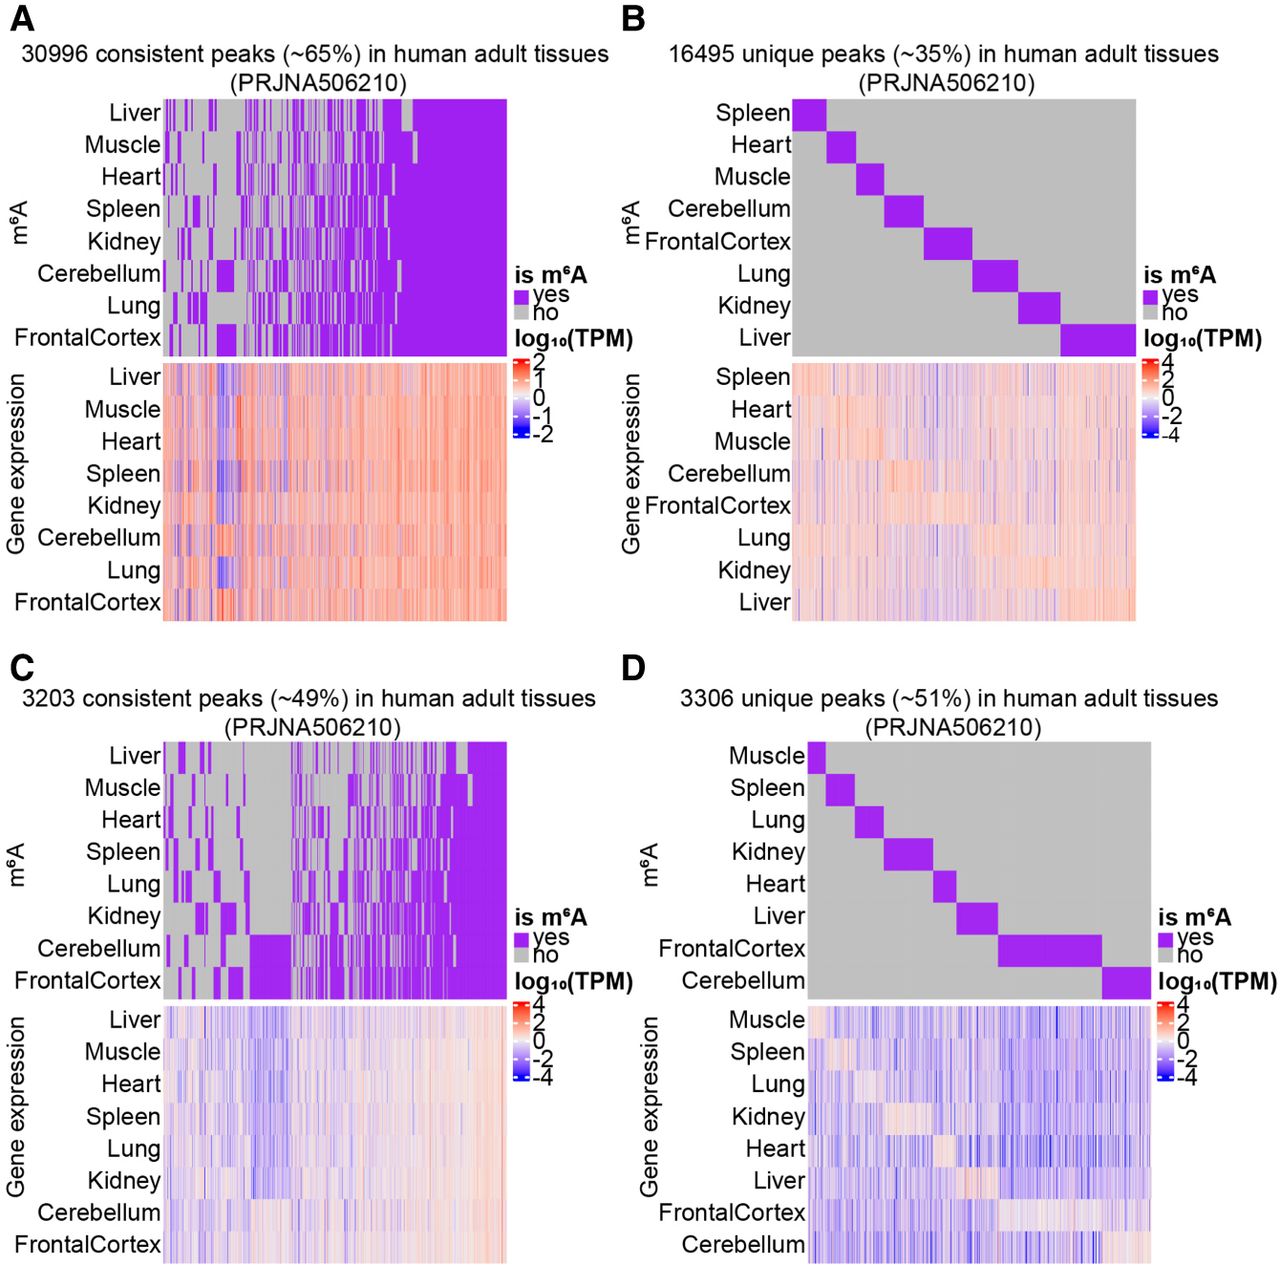
FIGURE 4.
mRNA and lncRNA m6A modification and gene expression profiles in eight different adult tissues. (A) mRNA-consistent m6A sites and expression levels of genes marked by these sites. (B) mRNA-unique m6A sites and expression levels of genes marked by these sites. (C) lncRNA-consistent m6A sites and expression levels of genes marked by these sites. (D) lncRNA-unique m6A sites and expression levels of genes marked by these sites. Rows denote different tissues, and columns denote different m6A sites (upper panel) and genes marked by these sites (lower panel).




