


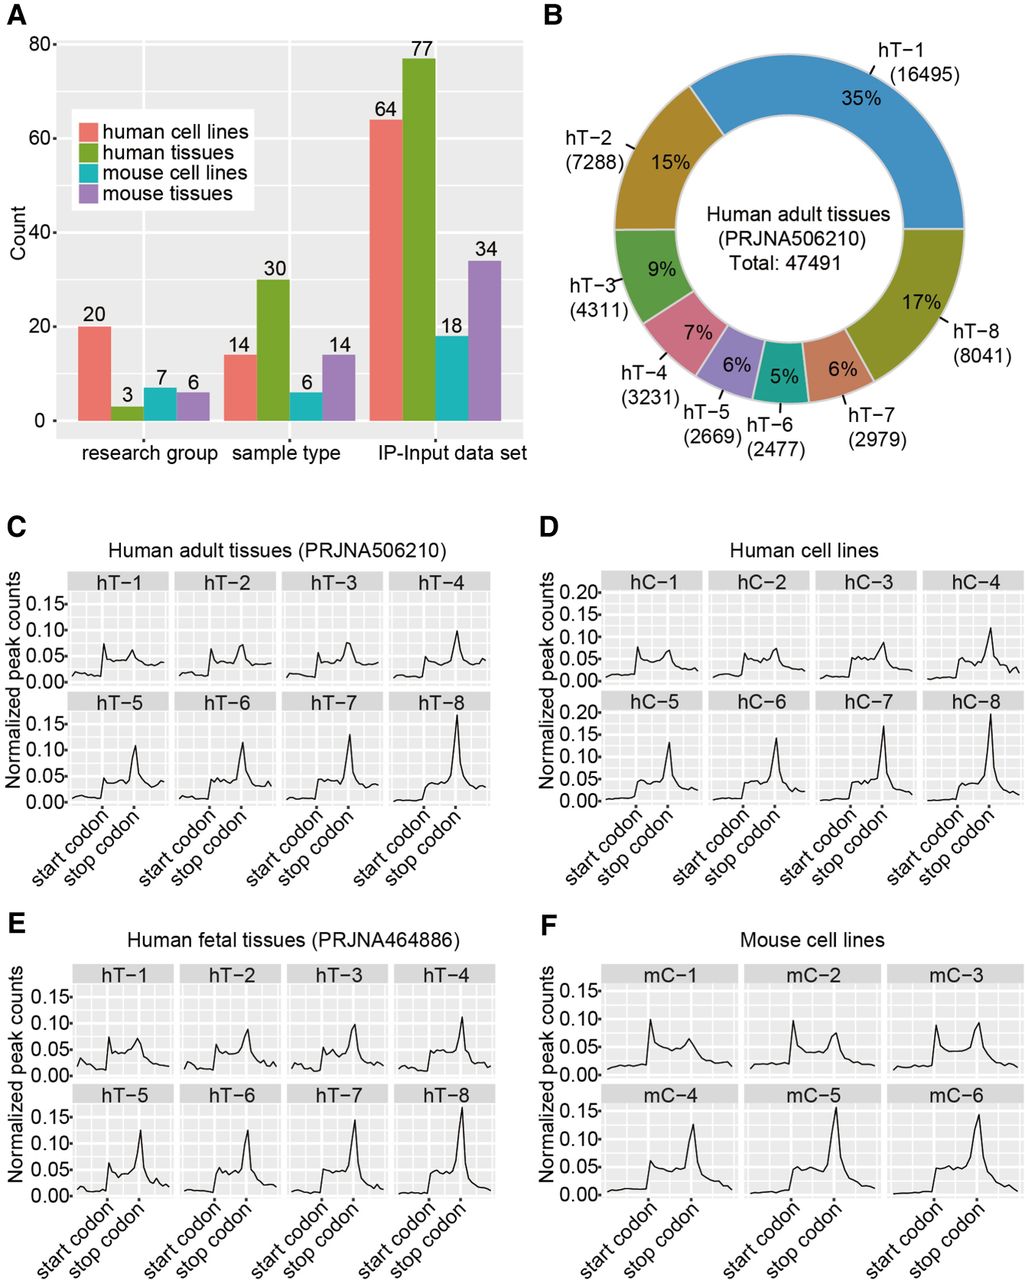
Sample information in this study and the proportion and distribution patterns of m6A sites of different consistency levels. (A) The number of research groups, sample types, and IP-Input data sets in human cell lines, human tissues, mouse cell lines, and mouse tissues. (B) m6A sites detected in eight different adult tissues are classified into eight consistency levels, and the number and proportion of m6A sites of eight consistency levels are shown. (C–F) Distribution of m6A sites with varying consistency levels across mRNA transcripts. Metagene profiles were generated using MetaPlotR (Olarerin-George and Jaffrey 2017), dividing the 5′-UTR, CDS, and 3′-UTR regions into 150 bins. The y-axis represents the normalized peak count, calculated as the number of m6A sites in each bin divided by the total number of m6A sites for that consistency level. (hT) Human tissue, (hC) human cell line, (mT) mouse tissue.




