


A new reagent for in vivo structure probing of RNA G and U residues that improves RNA structure prediction alone and combined with DMS
- 1Department of Biochemistry and Molecular Biology, Pennsylvania State University, University Park, Pennsylvania 16802, USA
- 2Center for RNA Molecular Biology, Pennsylvania State University, University Park, Pennsylvania 16802, USA
- 3Department of Chemistry, Pennsylvania State University, University Park, Pennsylvania 16802, USA
- Corresponding author: pcb5{at}psu.edu
-
Handling editor: John Woolford
Abstract
A key to understanding the roles of RNA in regulating gene expression is knowing their structures in vivo. One way to obtain this information is through probing the structures of RNA with chemicals. To probe RNA structure directly in cells, membrane-permeable reagents that modify the Watson–Crick (WC) face of unpaired nucleotides can be used. Although dimethyl sulfate (DMS) has led to substantial insight into RNA structure, it has limited nucleotide specificity in vivo, with WC face reactivity only at adenine (A) and cytosine (C) at neutral pH. The reagent 1-ethyl-3-(3-dimethylaminopropyl) carbodiimide (EDC) was recently shown to modify the WC face of guanine (G) and uracil (U). Although useful at lower concentrations in experiments that measure chemical modifications by reverse transcription (RT) stops, at higher concentrations necessary for detection by mutational profiling (MaP), EDC treatment leads to degradation of RNA. Here, we demonstrate EDC-stimulated degradation of RNA in Gram-negative and Gram-positive bacteria. In an attempt to overcome these limitations, we developed a new carbodiimide reagent, 1-ethyl-3-(3-dimethylaminopropyl) carbodiimide methiodide (ETC), which we show specifically modifies unpaired Gs and Us in vivo without substantial degradation of RNA. We establish ETC as a probe for MaP and optimize the RT conditions and computational analysis in Escherichia coli. Importantly, we demonstrate the utility of ETC as a probe for improving RNA structure prediction both alone and with DMS.
Keywords
INTRODUCTION
RNA relies, in part, on base-pairing to adopt dynamic and functional structures for regulating gene expression. These folded RNAs can change their structure in response to a number of stimuli such as temperature and ligand binding and, in some instances, regulate RNA polymerase pausing, transcription termination, and translational frame shifting (Serganov and Patel 2007; Corley et al. 2020; Mandell et al. 2022; Jolley et al. 2023). Thus, understanding RNA structure as it exists in the cell is crucial to understanding its function. To infer genome-wide in vivo RNA structure, one widespread method uses cell-permeable chemicals that covalently modify accessible bases. Chemicals such as dimethyl sulfate (DMS), glyoxal, and 1-ethyl-3-(3-dimethylaminopropyl) carbodiimide (EDC) modify the Watson–Crick (WC) face of unpaired nucleotides (Ding et al. 2014; Rouskin et al. 2014; Mitchell et al. 2018, 2019b; Wang et al. 2019). Alternatively, selective 2′ hydroxyl acylation and primer extension (SHAPE) reagents react with the 2′ OH of the sugar in flexible regions (Lee et al. 2017; Marinus et al. 2021). In each case, the resulting covalent modifications can be detected by reverse transcription (RT) as either an RT stop 1 nt before the site of modification, or as a mutation in the extended cDNA across from the site of modification. Sequencing libraries prepared by these methods can then be analyzed to quantitate reactivity with single-nucleotide resolution.
The WC face in vivo modifiers DMS and EDC are nucleotide-specific. At neutral pH, DMS methylates the N1 of A and the N3 of C. It also methylates the N7 of G, although this position is not on the WC face and thus not informative for canonical base-pairing. In these reactions, the imino nitrogen acts as a nucleophile and attacks a methyl group of DMS. Alternatively, EDC, a carbodiimide, probes the N1 of G and the N3 of U. In this case, a nitrogen of the carbodiimide abstracts the imino proton from the nucleobase, leaving an anionic nitrogen on the nucleobase that attacks the carbon of the protonated carbodiimide (Mitchell et al. 2019b). This reaction results in a covalent adduct between the imino nitrogen of the nucleobase and the carbon of the carbodiimide (Supplemental Fig. S1). Thus, in using both DMS and a carbodiimide, it is possible to obtain structural information on all four nucleobases at the WC face at neutral pH (Mitchell et al. 2019a; Sieg et al. 2023).
To date, EDC adducts have only been detected by RT stops (Mitchell et al. 2019b; Wang et al. 2019; Sieg et al. 2023). Although RT stops remain a reliable method for determining changes in reactivity profiles between experimental conditions, they provide only one piece of structural information per sequencing read, which can limit mapping back to the transcriptome and, therefore, knowledge of whether reads on smaller RNAs correspond to full length RNAs (Yamagami et al. 2022). In contrast, mutational profiling (MaP) can detect multiple mutations on a single read, which corresponds to a single RNA molecule in the cell (Siegfried et al. 2014; Zubradt et al. 2017). Computational pipelines such as RING-MaP, DREEM, and DRACO have taken advantage of this property to directly cluster MaP reads into distinct structural conformations before calculating reactivities (Homan et al. 2014; Tomezsko et al. 2020; Morandi et al. 2021). Likewise, PAIR-MaP takes advantage of these multiple signals per read and correlates simultaneously modified bases to detect base pairs (Mustoe et al. 2019; Mitchell et al. 2023). Nonetheless, despite the large array of chemical probes available for structure probing, to date only DMS and SHAPE reagents have been used for MaP (Zubradt et al. 2017; Smola and Weeks 2018). Moreover, of these, only DMS is suitable for methods like DREEM, DRACO, and PAIR-MaP (Tomezsko et al. 2020; Morandi et al. 2021; Mitchell et al. 2023), largely limiting these techniques to reactivity of As and Cs (Mitchell et al. 2019a).
In this work, we developed a new in vivo probe for MaP of the WC face of Gs and Us. Although EDC has been established as a useful reagent for RT stops in vivo, at high concentrations, such as those necessary for MaP, we previously found that it degraded RNA (Mitchell et al. 2019b). Additionally, prior attempts at MaP with EDC did not yield appreciable mutations (Wang et al. 2019). In this study, we identified an alternative carbodiimide, 1-ethyl-3-(3-dimethylaminopropyl) carbodiimide methiodide (ETC), which serves as an in vivo probe with improved RNA quality and increased modification levels as compared to EDC. In ETC, the terminal amine is changed from dimethyl, a tertiary amine, to trimethyl, a quaternary amine, eliminating the lone pair on the amine (Fig. 1A). We also optimized experimental and computational protocols for MaP of ETC-modified rRNAs. The results showed a reduction of RNA degradation in vivo and a low but reliable mutation rate for unpaired Gs and Us in Escherichia coli rRNA. Finally, we demonstrated the utility of ETC reactivities as pseudo–free energy restraints for the folding of a set of rRNAs and showed an improvement in structure prediction accuracy, both alone and in combination with DMS.
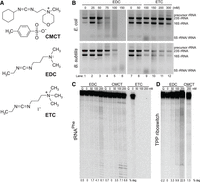
Carbodiimide in vivo and in vitro degradation assays. (A) The three carbodiimides used in this study: CMCT, EDC, and ETC. The quaternary amine of CMCT leads to a permanent positive charge and, thus, the counterion (p-toluene sulfonate) is present alongside the carbodiimide. Likewise, ETC has a counterion (iodide). EDC is shown in its neutral form, although a sizeable fraction is protonated at the amine. (B) Total RNA from Escherichia coli and Bacillus subtilis treated in vivo with EDC and ETC, visualized by 1% agarose gels. (C) 5′-end-labeled Saccharomyces cerevisiae tRNAPhe treated in vitro with EDC, CMCT, and ETC. (D) 5′-end-labeled E. coli TPP riboswitch treated with EDC and CMCT. Both C and D are 10% denaturing PAGE, with percent degradation, “% deg,” provided at the bottom.
RESULTS
Quaternary amines reduced degradation of RNA in vivo and in vitro
To date, two carbodiimides have been used to probe the WC face of G and U, 1-cyclohexyl-(2-morpholinoethyl) carbodiimide metho-p-toluene sulfonate (CMCT) and EDC (Fig. 1A; Ehresmann et al. 1987; Mitchell et al. 2019b; Wang et al. 2019). Both reagents have a terminal amine that enhances the water solubility of the reagent either because of hydrogen bonding capabilities, electrostatic charge, or both. One notable difference between CMCT and EDC is that CMCT has a quaternary amine, whereas EDC has a tertiary amine.
Although CMCT has long been presumed to be limited to in vitro use, likely because of its large terminal groups and positive charge, EDC has been used in vivo by our group and others (Mitchell et al. 2019b; Wang et al. 2019; Sieg et al. 2023). However, at increasing EDC concentrations in minimally buffered systems, EDC treatments yield increasingly poor RNA quality in E. coli (Mitchell et al. 2019b). Conversely, buffered in vivo systems did not show the same evidence of degradation (Wang et al. 2019). Generally, chemical degradation of RNA is catalyzed by general acid–base chemistry by deprotonating the 2′ OH nucleophile and protonating the 5′ O leaving group, and the electron lone pairs on primary, secondary, and tertiary amino groups provide this chemistry, especially in the case of diamines (Yoshinari et al. 1991; Komiyama and Yoshinari 1997). On this basis, we reasoned that the electron lone pair on the tertiary amine of EDC, which has a pKa of ∼10 (Hall 1957), might induce RNA degradation by general acid–base chemistry, perhaps in combination with the imino nitrogens of the carbodiimide, especially in poorly buffered systems. With this idea in mind and to avoid this issue of buffering, we tested a new carbodiimide candidate, ETC, which has a terminal quaternary amine (Fig. 1A). This commercially available chemical is similar to EDC, but with an additional methyl group on the terminal amine. We reasoned that ETC, like its sister chemical EDC, might be small enough to pass through the cell membrane but avoid degradation of RNA due to the quaternary amine, which it shares with CMCT.
In the present work, we monitored in vivo RNA degradation at increasing EDC concentrations for E. coli and Bacillus subtilis. For both organisms, cells were grown to mid-exponential phase in Luria broth (LB) at 37°C and treated with EDC. RNA was extracted from the treated cells and its quality was visualized by agarose gels (Fig. 1B), where intact 16S and 23S rRNA bands indicated high-quality RNA, whereas missing bands or smearing between and below these bands indicated low-quality RNA. In E. coli (Fig. 1B, upper left), we observed high-quality rRNA at 0 and 25 mM EDC (lanes 1, 2, and 7), low-quality rRNA beginning ∼50–75 mM EDC (lanes 3, 4, and 8), and low-quality rRNA at 100 and 150 mM EDC (lanes 5 and 6). For B. subtilis (Fig. 1B, lower left), a similar trend was observed. Appreciable rRNA degradation in B. subtilis began at a slightly higher concentration of EDC than in E. coli, but both organisms had little to no distinguishable 16S and 23S rRNA bands by 100 mM EDC (lane 5). In contrast, with ETC (Fig. 1B, right), both E. coli and B. subtilis ETC-treated cells had intact rRNA even with much higher concentrations of reagent (lanes 9–12). Moreover, most ETC-treated samples exhibited evidence of precursor rRNA as a band migrating above the 23S rRNA, a hallmark of particularly high-quality extractions.
Next, we quantified the carbodiimide-mediated degradation of RNA in vitro. We focused on two in vitro transcripts with different types of structure, tRNAPhe from Saccharomyces cerevisiae and the TPP riboswitch aptamer from E. coli. These transcripts were 5′-end-radiolabeled, treated with a series of carbodiimides, quenched with DTT, and visualized by polyacrylamide gel electrophoresis (PAGE) (Fig. 1C,D). We first compared the extent of RNA degradation upon treatment with the established carbodiimides, EDC and CMCT. For these experiments, two controls were performed: a quench control (Q) in which DTT quench was added before 200 mM chemical probe, and an untreated control (0) in which DTT was added, but the chemical probe was not. For tRNAPhe (Fig. 1C), the degradation increased with EDC concentration, reaching 8.1% at 200 mM reagent, with increased band intensity at almost every position along the transcript. In contrast, for CMCT, most degradation was at specific bands and peaked at 7.1%. The increased and generalized degradation with EDC as compared to CMCT was more apparent for the TPP riboswitch aptamer (Fig. 1D). In this case, EDC treatment led to 22.5% degradation of the RNA at 200 mM reagent, again evenly along the transcript, whereas CMCT treatment led to almost no degradation (1.5%) at 200 mM reagent. The increased degradation of the TPP riboswitch as compared to tRNAPhe may be because the TPP riboswitch aptamer has flexible regions, which in general are more susceptible to degradation.
Given that CMCT, which has a quaternary amine, led to less degradation of the tRNAPhe and TPP riboswitch RNAs, we attempted to test RNA degradation in vitro with ETC, which also has a quaternary amine. Because RNA degradation was suppressed by ETC in vivo, we expected a similar effect in vitro. Surprisingly, however, the RNA from ETC-treated reactions was not present on the gel (Fig. 1C). We found evidence that these RNAs reverse electrophorese (i.e., travel toward the negative electrode [Supplemental Fig. S2A]), which may be due to phase separation observed in vitro (Supplemental Fig. S2B). We hypothesize that the phase separation is driven by interactions between negatively charged RNA and excess positively charged ETC molecules but do not fully understand its properties. Nonetheless, droplet formation does not seem to inhibit extraction from in vivo–treated samples, and these samples run normally on a gel. Overall, although ETC may not be an optimal probe in vitro, it is a suitable candidate for RNA structure probing in vivo.
ETC improved the sensitivity and specificity of RNA structure mapping in vivo
To assess the ability of ETC to be an effective in vivo probe, we compared it to the established probe EDC. Primer extension and denaturing PAGE were used to quantify RT stops from in vivo–treated RNA samples, allowing for structure probing near the 5′ end of three different rRNAs: the 16S rRNA of E. coli and the 5S and 23S rRNAs of B. subtilis. Because ETC does not appreciably degrade RNA, we were able to use high concentrations of the reagent, up to 300 mM. With EDC, only 40 or 50 mM reagent was used to maintain RNA quality.
We first consider E. coli 16S rRNA (Fig. 2A). On the gel, reactive nucleotides can be visualized by an increase in intensity 1 nt before the site of modification as compared to the untreated control. Quantification of reactive nucleotides was mapped onto the known RNA secondary structure obtained from comparative analysis (Cannone et al. 2003). We found that ETC reactivity agreed well with established EDC reactivity, targeting primarily unpaired G and U residues, with an approximate twofold preference for Us. Specifically, we observed that unpaired nucleotides U20, G31, C83, U84, and U85 were modified (true positives) by both EDC and ETC. Additionally, there were five unpaired Gs and Us that were unreactive (false negatives) with both chemicals. To investigate this apparent discrepancy, we first used an E. coli ribosome crystal structure to calculate the solvent-accessible surface area for the N1 of Gs and N3 of Us, and then to identify the hydrogen bonds to the solvent-accessible nucleotides (see Materials and Methods). Three of the five unreactive nucleotides, G15, G64, and G86, were fully solvent-inaccessible, whereas the other two, U14 and G38, formed stabilizing hydrogen bonds at their WC faces (Supplemental Fig. S3A,B). Thus, there were clear structural explanations for all five false negatives. Although both carbodiimides mostly probed unpaired regions, there were a few Gs and Us in regions that were depicted as paired that were reactive (false positives). For instance, in E. coli 16S rRNA, both chemicals modified paired G11 and U12; however, these residues are part of GC and U•G pairs that are adjacent to another U•G that closes a short helix (Fig. 2A), suggesting that they may breathe. Similarly, reactive U49 and U62 are in U•G wobbles adjacent to a bulge or a closing base pair. Finally, reactive G68 is part of a sheared GA pair that turns the WC face of the G out toward the solution (Mitchell et al. 2019b).
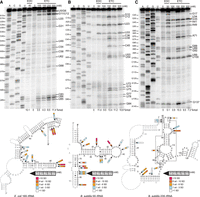
In vivo modification of different rRNAs by EDC and ETC. (A) Escherichia coli 16S rRNA, (B) Bacillus subtilis 5S rRNA, and (C) B. subtilis 23S rRNA probed with the indicated concentrations of EDC and ETC, and the corresponding structure with mapped reactivities. (Top panels) Ten percent denaturing PAGE. Dideoxy sequencing lanes (A,C,G,U) and an untreated control (0) are provided. Nucleotide labels to the left refer to the sequencing ladder, whereas labels to the right indicate significantly modified nucleotides. (Bottom panels) Pencils indicate reactivity values at each probing condition, where “SD” represents reactivity as a number of standard deviations away from the average signal of unmodified nucleotides. Gray nucleotides indicate regions without probing data.
Next, we turned to B. subtilis 5S and 23S rRNAs (Fig. 2B,C). In the 5S rRNA, EDC reactivities overlapped with ETC (Fig. 2B), although ETC reacted with multiple additional nucleotides, thus increasing its sensitivity compared to EDC. This increased reactivity likely occurred because of the higher RNA modification levels afforded by the higher concentration of ETC, which was made possible because of reduced RNA degradation. Both chemicals modified unpaired nucleotides G10, U23, U33, and U75 (true positives). Notably, ETC also modified unpaired nucleotides U12, C36, U38, and C45 (additional true positives). Likewise, in 23S rRNA (Fig. 2C), unpaired U34, U99, and U100 were modified by both chemicals, whereas ETC uniquely modified A49, A71, G88, U89, and G92.
In both B. subtilis transcripts, there were also nucleotides with reactivity that were inconsistent with the known structure (i.e., unpaired nucleotides that were unreactive [false negatives] or paired nucleotides that were reactive [false positives]) (Fig. 2B,C). As with 16S rRNA from E. coli, these false negatives and false positives can be understood. Beginning with the false negatives in B. subtilis 5S rRNA, of the 12 unpaired nucleotides within the region we probed, only G22, G42, and G57 were unreactive; G42 and G57 were solvent-inaccessible, whereas G22 formed stabilizing interactions (Supplemental Fig. S3C). In the case of 23S rRNA, its 5′ region had many more false negatives, with 19 unpaired unreactive Gs and Us. Of these, 14 were solvent-inaccessible (U25, G26, G27, U29, G48, G51, G60, U72, U74, G75, G83, U98, U111, and G123). Of the remaining five, U33 and U119 had stabilizing interactions (Supplemental Fig. S3D,E), whereas U50, G101, and U112 were positioned near basic amino acids in the ribosome, which might have interfered with the approach of the positively charged ETC reagent (Supplemental Fig. S3F,G).
Turning to the false positives, both B. subtilis 5S and 23S rRNA have examples of paired reactive nucleotides in regions expected to have weakened structures (Fig. 2B,C). Specifically, in 5S rRNA, both chemicals probed three paired nucleotides, G77, U78, and G84. Of these, G77 and U78 are members of consecutive G•U and U•G wobbles that are adjacent to an internal loop. Likewise, G84 is in the closing base pair of a hairpin triloop. Four additional paired nucleotides were modified by just ETC. Of these, U54 and G74 were located in noncanonical closing base pairs, and U53 and U72 were in base pairs adjacent to a mismatch. Many of the above reactive paired nucleotides in 5S rRNA were in a highly noncanonical stretch that includes three G•U wobbles, one GG shear, two AG shears, one UC shear, and a 2 × 2 internal loop. Additionally, when looking at this noncanonical stretch in the crystal structure, U72 interacts with G100 in such a way that its N3 is outside of typical hydrogen bond distance and thus accessible for modification (Supplemental Fig. S4). Likewise, for G74 both the N1 and N2 share polar contacts with the O6 of G98, suggesting a weakened pairing interaction (Supplemental Fig. S4). In 23S rRNA, G35 is the only paired nucleotide that is highly reactive (false positive) with both chemicals, and it is a closing base pair of an internal loop. In sum, although the binary pairing state explained the true positives and true negatives, structural evidence beyond this binary state that includes solvent inaccessibility and hydrogen bonding explained all of the apparent false negatives and apparent false positives for ETC. However, in a limited number of cases, EDC alone showed reactivity that did not conform to even these rules. For instance, in B. subtilis 23S rRNA, G17 and A41, which are canonical WC pairs inside stable stems, showed weak reactivity with EDC only (i.e., unexplainable false positives). This observation suggests that ETC has slightly improved specificity over EDC for modifications by RT stops, perhaps afforded by its reduced degradation of RNA.
Although both carbodiimides are expected to react with Gs and Us at the protonated imino nitrogen, they may also react with As and Cs that are protonated on the imino nitrogen due to elevated pKas. In fact, low levels of EDC modification were previously reported on select As and Cs as background in Xist, a human long noncoding RNA, which mapped to unstructured regions (Wang et al. 2019). In this work, we also detected the reactivity of ETC and EDC with select As and Cs in bacterial rRNAs. In E. coli 16S rRNA, ETC and EDC reacted strongly with C83 (true positive), whereas ETC alone reacted with C54 and C58, both of which are in GC base pairs (false positives) with one or two A residue 3′-dangling ends, which are strong stackers (Fig. 2A; Turner and Mathews 2010). Reactivity with ETC at C54 and C58, along with a weakly paired U49 that is also present in this region, may be indicative of breathing of this structural element. In B. subtilis 5S rRNA, we observed low but significant reactivity of ETC alone at C36 and C45, which are two unpaired Cs (true positives) (Fig. 2B). Finally, in B. subtilis 23S rRNA, unpaired A49 and A71 (true positives) were moderately reactive with ETC alone (Fig. 2C). Thus, ETC appears capable of reporting on a limited number of A and C nucleotides that are either unpaired or part of weakened pairs, which may reflect shifting of the pKas of A and C toward neutrality.
Upon examining the overall modification levels for EDC and ETC, two trends emerged. First, more than twice as much ETC as EDC was necessary to achieve similar levels of RNA modification. For instance, in E. coli, 200 mM ETC and 40 mM EDC exhibited similar extents of modification, at 9.5% and 10.1%, respectively (Fig. 2A). Likewise, in B. subtilis, 100 mM ETC had a similar extent of modification as 50 mM EDC in 5S rRNA, at 9.5% and 11.4%, respectively, whereas in 23S rRNA these levels were 0.9% and 5.1%, respectively (Fig. 2B,C). We suspect that more ETC is needed because its positive charge limits membrane permeability. Second, the extent of modification did not always increase consistently with ETC concentration. For instance, in E. coli the overall modification levels were highest at 300 mM ETC, but some nucleotides, such as G11 and G68, peaked at 200 mM ETC (Fig. 2A). Similarly, in B. subtilis, the overall modification levels peaked at 150 mM ETC and decreased at higher ETC concentrations. This decrease at the highest concentration appears to be due to enrichment of unmodified RNA during extraction, as supported by decreased RNA modification and yield at high ETC concentrations. Perhaps the positive charge of the ETC adduct interferes with purification.
In sum, the primer extension experiments described in this section demonstrated that ETC functions as an effective in vivo RNA structure probe for Gs and Us, as detected by RT stops. However, we suspect that cell membrane permeability and RNA extraction efficiency were limited by the positive charge from the quaternary amine. Nonetheless, ETC is an improved reagent for probing Gs and Us compared to EDC, which we attribute to increased ETC-mediated modification at high ETC concentrations afforded by decreased RNA degradation. With a tool for increased modification by carbodiimides in hand, we tested whether ETC is amenable to transcriptome-wide probing with MaP by first optimizing RT conditions (next section) and then filtering mutation signatures (subsequent section).
Optimizing RT conditions for mutational profiling with ETC
Although ETC has an increased modification level over EDC, as necessary for MaP, we still suspected that the large, cationic ETC adduct on the WC face of nucleotides could interfere with RT readthrough. We thus set out to optimize RT conditions for detecting ETC modifications by conducting MaP on rRNA from E. coli. Our first pilot experiment aimed to identify an RT enzyme and temperature for MaP. Sequencing libraries of ETC-treated and untreated (control) RNAs were prepared with the following four RT enzymes: (1) TGIRT-III, (2) Marathon RT, (3) SuperScript-II (SSII), and (4) HIV-RT. These enzymes were chosen for several reasons: TGIRT-III (Zubradt et al. 2017) and Marathon RT (Yamagami et al. 2022) were previously used for DMS-MaP, whereas SSII was used in SHAPE-MaP experiments (Smola and Weeks 2018), and HIV-RT has readthrough CMCT-modified pseudouridine (Zhou et al. 2018). SuperScript-III was not tested, as it was previously reported to not produce usable MaP libraries with EDC (Wang et al. 2019). Finally, we reasoned that increased temperature might help readthrough of the large ETC adduct, and so we tested 65°C and 70°C extension temperatures with TGIRT-III, whereas the other enzymes were tested at their previously published temperatures (see Materials and Methods). To assess the nucleotide specificity of the ETC-probing libraries from each RT method, we compared the populations of mutation rates between the treated and untreated control samples. We found a significant increase in mutation rates in the ETC-treated samples as compared to the untreated samples at U and G with all four enzymes (Supplemental Fig. S5; Supplemental Table S1). Next, we assessed the RNA pairing specificity by comparing background-subtracted mutation rates of paired to unpaired Us and Gs (Fig. 3A,B; Supplemental Tables S2 and S3). Here, we observed a significant increase in mutation rates of unpaired Us and Gs in all conditions, with the most prominent increase using TGIRT-III with extension at 65°C (4.0-fold for U and 2.8-fold for G) and the poorest with HIV-RT (1.3-fold for U and 1.1-fold for G). We also observed that U has a more prominent increase in mutation rate between paired and unpaired residues compared to G (Fig. 3A,B; Supplemental Tables S2 and S3), consistent with our primer extension experiments (see above) that showed an approximately twofold preference for U over G. To further assess how well these mutation rates predicted the binary model of pairing state, we plotted receiver operating characteristic (ROC) curves using the phylogenetic structure as the reference pairing state (Cannone et al. 2003) and calculated the area under the curve (AUC) for background-subtracted mutation rates at both U and G. With ROC curves, AUCs closer to 1 reflect a better prediction of the secondary structure model, whereas an AUC of 0.5 reflects random chance. By this metric, HIV-RT performed poorly, consistent with its modest ability to distinguish unpaired and paired nucleotides (Fig. 3A,B; Supplemental Tables S2 and S3), whereas the other RTs did markedly better (Fig. 3C,D), and among these, TGIRT-III at 65°C was the best and chosen for further analysis.
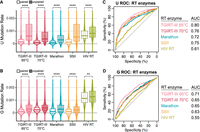
Comparison of RT enzymes for sequencing libraries of Escherichia coli 16S rRNA and 23S rRNA probed in vivo with ETC. (A,B) Violin plots showing background-subtracted mutation rates for paired and unpaired (A) Us and (B) Gs. Medians are provided in Supplemental Table S2. The significance of Wilcox tests is denoted with asterisks comparing paired and unpaired residues, and P-values are provided in Supplemental Table S3. The upper and lower portions of some violins were clipped to better visualize the data. Temperatures are for the extension step of RT. (C,D) ROC curves of background-subtracted mutation rates for (C) U and (D) G for each enzyme.
To complement our optimized ETC pilot experiments, which were detected by TGIRT-III at 65°C, we included a positive control library probed with DMS, the gold standard for RNA chemical probing (Fig. 4). Because ETC and DMS have different nucleotide specificities, we compared background-subtracted mutation rates for DMS at As and Cs with background-subtracted mutation rates for ETC at Gs and Us (Fig. 4A; Supplemental Table S4). We saw significant increases in mutation rates of paired versus unpaired nucleotides with DMS, with a 2.2-fold increase for As and an 11.3-fold increase for Cs, as expected, but also a 1.8-fold increase for Us with essential no change for Gs. Notably, ETC had larger increases in mutation rates of unpaired Gs and Us with increases of 2.8-fold and 4.0-fold, respectively (Fig. 4A,B), with a more limited increase in mutation rates at unpaired As and Cs. Although the differences were significant in both ETC and DMS samples, the fold-increase in modification, determined by comparing the median between paired and unpaired mutation rates, was lower for ETC at its target nucleotides than for DMS at its target nucleotides (Fig. 4A). Additionally, the median mutation rate for unpaired nucleotides was ∼10-fold lower for ETC at its target nucleotides of G and U (3.0 × 10⁻⁴ and 6.1 × 10⁻⁴, respectively) compared to DMS at its target nucleotides of A and C (72 × 10−4 and 42 × 10−4, respectively) (Supplemental Table S4). These results suggest that although ETC modification exhibits a detectable preference for unpaired Gs and Us as expected, the data are limited by low signal. This limitation cannot be addressed by simply increasing the ETC concentration, as these higher concentrations of ETC did not consistently lead to increased modification rates (Fig. 2). Similarly, a pilot MaP experiment comparing standard 200 mM ETC with 300 mM ETC led to the same conclusion of reduced mutation rate at the highest ETC concentration, with medians of 14 × 10−4 mutations per read for G and 7.6 × 10⁻⁴ mutations per read for U at 200 mM, and medians of 13 × 10−4 mutations per read for G and 6.6 × 10⁻⁴ mutations per read for U at 300 mM (Fig. 4B; Supplemental Tables S5 and S6). Perhaps this result was largely due to the depletion of highly modified transcripts during extraction, as described for the primer extension experiments.
Comparison of DMS and ETC for sequencing libraries of Escherichia coli 16S rRNA and 23S rRNA probed in vivo using TGIRT-III at 65°C. (A) Violin plots showing background-subtracted mutation rates for all residues modified by 100 mM DMS and 200 mM ETC. The significance of Wilcox tests is denoted with asterisks comparing paired and unpaired residues, and medians and P-values are reported in Supplemental Table S4. (B) Violin plots showing raw mutation rates for Gs and Us in untreated (UT), 200 mM ETC (1× ETC), and 300 mM ETC (1.5× ETC) samples. Medians are provided in Supplemental Table S5. The significance of Wilcox tests is denoted with asterisks, and P-values are reported in Supplemental Table S6.
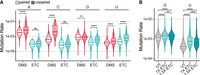
In the next set of experiments, we aimed to further optimize the temperature of RT with TGIRT-III, which worked better at 65°C than at 70°C. We prepared ETC libraries with extension steps at 50°C, 55°C, and 60°C in biological triplicate. Libraries at a given temperature were highly correlated (Supplemental Fig. S6), and thus reads were pooled for further analysis. To compare the background noise between these conditions, we first compared mutation rates of the untreated control samples, which represents the propensity for random mutations by each RT condition that is independent of ETC modifications. We found extension at 55°C had the lowest background rate, and thus the lowest background noise (Supplemental Fig. S7A; Supplemental Table S7). We then compared raw mutation rates between treated and untreated control samples and saw a significant increase in the mutation rate for both G and U residues at 50°C and 55°C (Supplemental Fig. S7B; Supplemental Table S8). Next, we compared background-subtracted mutation rates between paired and unpaired residues and observed, as expected, that Gs and Us had a significant increase in mutation rates of unpaired residues for all extension temperatures (Fig. 5). When quantifying the increase in reactivity, we found that at 50°C there was a 1.5-fold increase for G and 3.4-fold increase for U, for 55°C there was a 1.4-fold increase for G and a 20.0-fold increase for U, and for 60°C there was a 4.7-fold increase for U, although the median for G was negative for both paired and unpaired at this temperature (Fig. 5A,B; Supplemental Tables S9 and S10). Notably in this plot, the median of paired Us is centered around 0 in all conditions, whereas for G the median is much higher, possibly indicating excess noise in the G data (Fig. 5A,B). Finally, AUC values from ROC curves suggested that extension at 50°C is slightly improved compared to extension at 55°C and 60°C (Fig. 5C,D), although the error bars in the AUCs overlap when considering replicate variation (Supplemental Table S11). Apparently, TGIRT-III is robust across a range of temperatures. Nonetheless, the 50°C extension temperature with TGIRT-III was used in the remainder of our study.
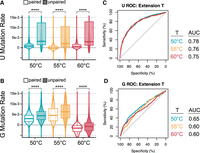
Comparison of TGIRT-III extension temperatures for sequencing libraries of E. coli rRNA probed in vivo with ETC. (A,B) Violin plots showing background-subtracted mutation rates for paired and unpaired (A) Us and (B) Gs. Medians are provided in Supplemental Table S9. The significance of Wilcox tests is denoted with asterisks comparing paired and unpaired residues, and P-values are reported in Supplemental Table S10. The upper and lower portions of some violins were clipped to better visualize the data. (C,D) ROC curves of background-subtracted mutation rates for (C) U and (D) G at each extension temperature. Comparisons between AUCs of replicates are reported in Supplemental Table S11.
Filtering mutation signatures for mutational profiling with ETC
Throughout our analyses, we noticed that G had a much higher raw mutation rate (i.e., without background subtraction) than the other nucleotides, even under untreated conditions; the median mutation rate for G was 1.2 × 10⁻³ compared to 0.42 × 10⁻³ for U (Fig. 4B; Supplemental Table S5). We posited that this high background signal may lead to excess background noise that may reduce the predictive power at G, as suggested by the smaller AUC for G in its ROC plots (Figs. 3C vs. D and 5C vs. D). In this section, we sought to reduce this noise by computationally filtering mutation signatures that are not indicative of pairing state (Fig. 6), as motivated by recent work (Mitchell et al. 2023).
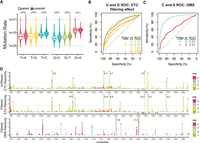
Mutation filtering for sequencing libraries of Escherichia coli rRNA probed in vivo with ETC. (A) Violin plots of background-subtracted mutation rates of paired and unpaired Us and Gs separated by the three possible single-nucleotide mismatches. These and other mutation types are provided in Supplemental Figure S8. The significance of Wilcox test is denoted with asterisks comparing the paired and unpaired residues. Medians are provided in Supplemental Tables S12 and S14, P-values are provided in Supplemental Tables S13 and S15. (B) ROC curve of U and G reactivities with ETC; filtered (+) and unfiltered (−). (C) ROC curve of C and A reactivities with filtered DMS. (D) Example per nucleotide reactivity distributions for unfiltered ETC, filtered ETC, and filtered DMS. Nucleotides with reactivity of >1.5 are marked with an asterisk, and reactivity values clipped of >4 are annotated on the plot. A–C are across all three rRNAs, whereas D is for the 16S rRNA 3′ major domain.
First, we determined the ETC mutation signatures that were most informative of the pairing state of Gs and Us. For each nucleotide, these mutation signatures include mismatches, insertions, and deletions at single or multiple nucleotides, as well as complex signatures that combine mismatches and insertions or deletions (Supplemental Fig. S8). Beginning with U, almost all these mutation signatures, including the three single-nucleotide mismatches, showed highly significant increases in background-subtracted mutation rates between paired and unpaired residues, with median fold changes of 1.1–1.3 for T to A, T to G, and T to C, suggesting that they were informative of pairing state (Fig. 6A; Supplemental Fig. S8A; Supplemental Tables S12 and S13). In the case of G, only the two single-nucleotide mismatch transversions of G to C and G to T gave highly significant increases in mutation rate between paired and unpaired residues, with median fold changes of 1.3. All other signatures, including the G to A transition, gave little to no significant increase (Fig. 6A; Supplemental Fig. S8B; Supplemental Tables S14 and S15). For both U and G, the single-nucleotide mismatch transitions gave higher mutation rates than all other mutation signatures (Supplemental Fig. S8). Based on these observations, we applied mutation filtering by including (i.e., not filtering out) only the single-nucleotide mismatches for U and G except for G to A, even though some authentic mutations would be lost by this filtering. To assess whether this mutation filtering increased the predictive power of ETC reactivities, we examined ROC curves for all E. coli rRNA residues (Fig. 6B). This filtering regime improved the AUC for Gs by four percentage points from 65% to 69%, whereas for Us the AUC decreased by two percentage points from 79% to 77% (Fig. 6B). Given this overall improvement, we chose to filter the data as described.
To visualize the effect of filtering on the signal to noise in reactivities, we plotted the unfiltered and filtered ETC reactivities, as well as the filtered DMS reactivities as a positive control, for each nucleotide of the 16S rRNA 3′ major domain (Fig. 6D). We first evaluated the background, modeled as the average ± standard deviation (SD) of all reactivities for the paired bases in this domain. For unfiltered and filtered ETC reactivities, we observed similar average background reactivities but about half of the noise for filtered data, 0.13 ± 0.47 and 0.17 ± 0.25, respectively. Notably, the average baseline for filtered DMS data was about twofold lower than for filtered ETC data at 0.05 ± 0.12. To measure the increased ETC reactivity signal upon filtering, we focused on residues with reactivity over a threshold of 1.5, which represents those residues with background-subtracted mutation rates above the average of the top 2%–10% of mutation rates within a transcript. In the unfiltered data, there were nine residues with ETC reactivity of >1.5, whereas in the filtered data this increased to 15 residues, which was comparable to that of DMS with 13 highly reactive residues in this domain (Fig. 6D). Notably, because ETC and DMS target different bases, we expected differences in the location and number of reactive bases. When comparing specificity using the binary model of pairing state, DMS performed better, with all 13 of its highly reactive residues unpaired (i.e., true positives). In the case of ETC, 11 of the 15 highly reactive residues were true positives, whereas the remaining four were explainable false positives (see below). The decreased specificity of ETC for pairing is not surprising because this reagent queries weak G•U wobbles in addition to the two stronger canonical WC pairs, whereas DMS only probes the two canonical pairs. Overall, at high reactivities such as 1.5, filtered ETC and DMS data resulted in fairly comparable sensitivity and specificity in this example domain, with DMS performing more accurately and with approximately twofold less noise.
We next tested whether these trends hold across all rRNA domains by comparing the predictive power of ETC and DMS reactivities using ROC curves for filtered data in all three E. coli rRNAs (Fig. 6B,C). For DMS, Cs had the largest AUC of 0.91, whereas As had a more modest AUC of 0.67 (Fig. 6C). For ETC, filtered Us performed best with an AUC of 0.77, whereas filtered Gs had an AUC of 0.69 (Fig. 6B), as described above. Comparing the pyrimidines, C (DMS) outperformed U (ETC), whereas for the purines, A (DMS) and G (ETC) performed similarly. These trends may reflect the fact that C participates only in very stable GC pairs, whereas the other three bases can form weaker AU pairs and/or G•U wobbles, which are more likely to breathe and thus give rise to false positives. To summarize, ETC is a reliable in vivo probe for MaP that tends to have reactivity at unpaired Gs and Us, which gains improvements from mutation filtering and RT optimization. Nonetheless, ETC libraries are limited by lower mutation rates than DMS libraries, leading to higher background when normalized.
RNA structure prediction is improved by ETC alone and when combined with DMS
With ETC established as an in vivo probe with a detectable signal by MaP, we next explored the utility of applying ETC reactivities as pseudo–free energy restraints for the prediction of in vivo rRNA structures. We folded the 11 domains of the three rRNAs from E. coli using the following four sets of reactivity pseudo–free energy restraints (Fig. 7): (1) no pseudo-free energy restraints (sequence alone); (2) ETC reactivities for only Us and Gs (ETC); (3) DMS reactivities for only As and Cs (DMS); and (4) ETC and DMS reactivities combined to restrain all four types of residues (ETC + DMS). For each of these sets of restraints, the sensitivity and positive predictive value (PPV) of the minimum free energy structure were calculated, and their geometric mean, referred to as Matthew's correlation coefficient (MCC), was used as a measure of prediction accuracy (Wu et al. 2015). Next, the MCC was plotted for each of the rRNA domains with the four sets of restraints, ranging from lowest to highest accuracy with respect to sequence alone (Fig. 7). When no restraints were applied, the prediction accuracy ranged widely, from 25% to 80%, with a mean accuracy across all domains of only 59%. When either ETC or DMS restraints were applied alone, the mean accuracy across all domains improved to 76% and 79%, respectively, and the range narrowed to ∼30% for each. Notably, when ETC and DMS restraints were applied together, the mean accuracy across all domains improved further, to 84%, and the range narrowed even further, to ∼15%.
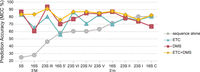
Prediction accuracy for folding of rRNA domains from Escherichia coli in RNAstructure quantified by the MCC. Folding was done with four sets of reactivity restraints: (1) sequence alone (gray circles), (2) ETC reactivities at Gs and Us as restraints (aqua triangles), (3) DMS reactivities at As and Cs as restraints (red squares), and (4) ETC and DMS reactivities combined (yellow diamonds).
When ETC reactivities alone for Us and Gs were applied and compared to sequence alone, six rRNA domains showed marked improvement in prediction accuracy (up to 58%), four rRNA domains showed no substantial difference in accuracy, and 23S domain I had slightly decreased (∼5%) accuracy. With DMS reactivities alone at As and Cs, eight domains showed increased prediction accuracy (up to 62%), one domain had no effect, and the 23S domain I and the 16S central domain showed decreased (∼6% and ∼14%) prediction accuracy. When DMS and ETC alone were compared to each other, DMS showed large increases in prediction accuracy more often than ETC (eight vs. six times), often outperforming ETC, although ETC alone outperformed DMS alone twice (Fig. 7). Finally, with combined ETC and DMS reactivities, which cover all four nucleobases, nearly all of the domains (10 of 11) exhibited accuracy equal to or better than sequence alone, with only 23S domain I having slightly decreased accuracy than sequence alone. Moreover, combining both chemicals did not result in any notable decrease in accuracy compared to either ETC alone or DMS alone (i.e., combining chemicals did no harm), and the combination outperformed either of the single chemicals in three of the 11 cases, with up to 20% improvement in the case of the 16S 3′ major domain. Thus, combining reactivities from ETC and DMS provides an improved approach for RNA structure prediction.
To understand how ETC and DMS reactivities help improve structure prediction, we mapped these reactivities onto the known rRNA secondary structures (Cannone et al. 2003). We then compared regions with both improved and worsened prediction accuracy upon application of each type of restraint. However, because MFE structures are calculated based on information from the entire structure, we can only speculate about the influence of reactivities. To illustrate our findings, we begin with the 16S 3′ major domain from E. coli, which showed large improvements in prediction accuracy for both single and the combined chemicals. For the most part, ETC and DMS reactivities mapped accurately to the known secondary structure, with the highest reactivity at unpaired or weakly paired residues (Fig. 8A). Circle plots, which are annotated with the standard helix names, show how these reactivities influenced folding (Fig. 8B–E). In comparing the predicted structures with ETC or DMS reactivities applied independently to the predicted structure with no restraints, in each case we saw improved folding of stems 29, 30, 35, 37, 39, and 43 (Fig. 8C,D compared to 8B). In the case of each chemical, when reactivities were mapped to the accepted secondary structure in Figure 8A, we saw a combination of low reactivity at canonical pairs (e.g., helices 29, 30, and 35), as well as some high reactivity in loops (e.g., loops 37, 39, and 40) that aided accurate folding (Fig. 8A). In the case of stem 37, the two lower closing base pairs both have false positives with ETC, although the free energy penalties that these reactivities provided only compromised the predicted folding of these bases and were not enough to misfold the entire helix. Despite these improvements, ETC and DMS independently failed to improve the prediction of stems 32, 33, and 34, although ETC alone performed better than DMS alone for substem 33.2 and much of stem 34. Inaccurate folding at these stems may have been driven, in part, by the presence of false positives throughout this region of the RNA with both chemicals. However, for substem 33.2 and stem 34 that were not predicted with DMS reactivities, inaccurate folding was driven by a lack of information on the many Gs and Us. In other words, these substructures have relatively high proportions of G•U pairs, which can only be rewarded for nonreactivity or low reactivity in the ETC condition. On the other hand, in the case of stem 28, which has two G•U pairs that are destabilized by a bulged G and are highly reactive (false positives), having information on reactivities of Gs and Us penalizes correct folding and decreases prediction accuracy at the base of this stem as compared to DMS. Remarkably, when ETC and DMS reactivities were combined as restraints, they had a synergistic effect, leading to correct predictions at stems 32–34. Of the inaccurately predicted pairs with both ETC and DMS reactivities, most extend accurately predicted stems (i.e., yellow arcs enclosing blue arcs in Fig. 8E), which is unsurprising because minimum free energy structures favor pairing.
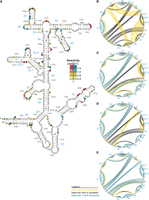
Folding of the 16S 3′ major domain from Escherichia coli. (A) DMS reactivity at As and Cs and ETC reactivity at Gs and Us mapped onto the known structure. Reactivity values are provided in the legend. Nucleotides without reactivity values are gray. (B–E) Circle plots comparing the known structure to the predicted structure using (B) no pseudo-free energy restraints, (C) ETC reactivities at Gs and Us as restraints, (D) DMS reactivities at As and Cs as restraints, and (E) combined ETC and DMS reactivities as restraints. Incorrect base pairs are yellow, unpredicted base pairs are black, and correct base pairs are blue.
Although the most striking example of prediction accuracy improvement occurred in the 16S 3′ major domain of E. coli rRNA, other regions of rRNA also showed marked improvements. Here, we illustrate example cases of other rRNA helices where ETC alone is better (Fig. 9A,B) and where DMS alone is better (Fig. 9C,D). In general, ETC outperformed DMS in stems with high proportions of internal G•U wobbles. A clear example of this was found in stem 26 of the 16S central domain that includes 5 G•U wobbles within the 12-bp stem (Fig. 9A). In this case, both sequence alone and ETC reactivities alone result in accurate folding, whereas DMS reactivities alone disrupted prediction of this stem (Supplemental Fig. S9B,C compared to D). When examining combined reactivities, the free energy bonuses from the low reactivity with ETC at the G•U wobbles stabilized stem 26 sufficiently to restore accurate prediction (Supplemental Fig. S9E). Similarly, stem 76 of the 23S domain V (Fig. 9B) was predicted correctly with sequence alone and ETC alone, but not with DMS alone (Supplemental Fig. S10A–C). Again, we observed a large proportion of noncanonical U-containing pairs alongside false positives at As with DMS. In this case, the few unreactive Gs and Us were insufficient to restore accurate prediction with combined chemicals (Supplemental Fig. S10D).
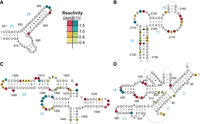
Example 16S and 23S rRNA stems from Escherichia coli comparing ETC and DMS prediction accuracy. DMS reactivity at As and Cs and ETC reactivity at Gs and Us were mapped onto the known structure of rRNA. Reactivity values are provided in the legend. (A) 16S central domain stems 25 and 26, (B) 23S domain V stems 76–78, (C) 23S domain III stems 57 and 58, and (D) 16S 5′ domain stems 3, 4, 15, and 16. Supplemental Figures S9–S12 provide accompanying circle diagrams for sequence alone, individual chemicals, and combined chemicals.
As seen above, we observed that DMS tends to outperform ETC in stems with terminal or destabilized G•U wobbles (Fig. 9C,D). In addition to stem 28 of the 16S 3′ major domain described above, the 23S domain III stems 57 and 58 were predicted correctly with DMS but not ETC (Supplemental Fig. S11). In this case, both stems have multiple instances of closing G•U wobbles, many of which had appreciable ETC reactivity in the case of stem 58 (Fig. 9C). Likewise, long-distance stem 4 in the 16S 5′ domain was predicted accurately with DMS reactivities, whereas ETC reactivities failed at accurate prediction (Supplemental Fig. S12). This stem is mostly comprised of GC WC pairs and did not show appreciable reactivity from either chemical, except for moderate ETC reactivity at U398 adjacent to a bulge (Fig. 9D). This false positive, combined with less reliable G reactivities throughout the structure (see above), was sufficient to disrupt accurate prediction of this long-distance stem. However, in both of the last two examples (Fig. 9C,D), combining DMS and ETC reactivities also restored prediction accuracy. Thus, although ETC and DMS have their weaknesses, when combined they tend to compensate for each other, resulting in an overall improvement of RNA prediction accuracy.
DISCUSSION
In this work, we identified ETC as an improved carbodiimide reagent for in vivo RNA structure probing of Gs and Us. We demonstrated that it exhibits reduced degradation of RNA in minimally buffered systems when compared to the previously established in vivo probe, EDC (Fig. 1; Wang et al. 2019; Mitchell et al. 2023). This reduced degradation afforded lower background and increased modification of RNA and, as such, increased the sensitivity and specificity as detected by RT stops (Fig. 2). Furthermore, we optimized the use of this reagent in MaP experiments, benchmarking it against well-studied E. coli rRNA structures. Specifically, we optimized RT conditions by testing a range of reverse transcriptases and extension temperatures, as well as refined the computational analysis by implementing mutation filtering (Fig. 6). Even with the optimized condition, we found that ETC MaP libraries are still limited by low modification levels of Gs and Us. We also demonstrated that, despite low signal, applying reactivities from ETC alone as pseudo–free energy restraints increased folding prediction accuracy, especially at internal G•U pairs, albeit less than DMS alone on average (Figs. 7⇑–9). Nevertheless, ETC's performance is notable considering it contends with unstable G•U pairs, whereas DMS primarily probes A and C residues that participate in canonical A-U and G-C base pairs. Importantly, in several cases, the combined reactivities from these two reagents more accurately predicted rRNA structures than when applied independently, and in no case did combining the chemicals markedly weaken the predictive power compared to each chemical alone (Fig. 7). Not only did the combination of chemicals increase the average prediction accuracy over the chemicals used individually, but it also narrowed the range of prediction accuracy across domains from ∼30% to 15%. We attribute this improvement to probing information at the WC face of all four bases.
Although we did not pursue it, our results with PAGE analysis suggest that ETC may serve as a useful probe for transcriptome-wide probing experiments detected by RT stops, similar to EDC (Wang et al. 2019; Mitchell et al. 2023; Sieg et al. 2023). In fact, our primer extension experiments also showed improved sensitivity and specificity of ETC over EDC, which is likely due to higher modification and decreased RNA degradation (Fig. 2), suggesting that ETC is an improved in vivo probe for RT stop studies. Conversely, given the similarity between EDC and ETC, the RT conditions optimized here for ETC may be applicable to detect in vitro EDC modifications by MaP. Although we selected one optimized temperature, TGIRT-III proved to be robust within a range of extension temperatures from 50°C to 65°C. Within this range, TGIRT-III accurately detected large charged ETC adducts, as well as DMS methylations. Finally, ETC may serve as a useful probe transcriptome-wide for MaP, albeit with some reservations. In general, MaP experiments have a higher minimum coverage threshold than for stops, decreasing the number of RNAs with sufficient coverage in transcriptome-wide experiments (Zubradt et al. 2017). In our work, ETC also proved to be sensitive to read coverage because of its limited modification and lower signal-to-noise ratio. Thus, the high coverage threshold necessary for reliable probing data with all MaP studies, and with ETC in particular, presents a limitation to using ETC as a MaP reagent transcriptome-wide, although increased read coverage and sequencing depth can likely overcome this barrier. Likewise, because of ETC's limited signal, and thus minimal number of reads with more than one mutation, modification levels were not high enough for deconvolutional methods like DREEM, DRACO, and DANCE MaP (Tomezsko et al. 2020; Morandi et al. 2021; Olson et al. 2022).
Although this work provided substantial steps toward the improvement of RNA structure predictions, there are a few limitations of the study. First, RNA structure probing was performed in only two organisms, E. coli and B. subtilis. Despite this limitation, because both EDC and CMCT modify RNA in human cells as detected by RT stops, we speculate that ETC will be able to do so as well (Wang et al. 2019). Likewise, because CMCT has been used successfully for in vivo S. cerevisiae studies (Xiao et al. 2023), we suspect ETC will also be able to probe RNA structure in this organism. In addition to probing a limited number of organisms, we also limited the number of transcripts we probed to rRNA. Although this limitation provided us with an abundant, well-studied set of model RNAs with complex secondary and tertiary interactions, it is possible that some of our findings, particularly with folding improvements, may not show the same degree of improvement for mRNAs. Finally, our mutation filtering only included single-nucleotide mutations because of limitations within data analysis frameworks. However, it is also possible that further improvements in the prediction accuracy of RNA structure could be obtained by including other mutation signatures such as indels and multinucleotide changes, which were informative of the pairing state for U (Supplemental Fig. S8A).
The biggest limitation for probing Gs and Us by MaP highlighted by this work is the low modification levels due to the poor extraction efficiency of highly modified RNAs. For this reason, the next steps toward improving MaP with a carbodiimide should aim to increase modification, likely achieved by the development of alternative probes. We suggest that an alternative carbodiimide be developed without charge or acid–base chemistry of a terminal amine, which may increase detectable modifications by increasing cell permeability, improving RT readthrough, and/or aiding the extraction efficiency of highly modified RNAs.
Another possible approach is to use DMS in basic conditions, as previously illustrated for the detection of modifications at all four nucleobases (Mitchell et al. 2023). However, such pH elevation could interfere with living systems, especially those that are particularly sensitive to pH such as cancer models, the endosome during viral replication, or the study of acidophiles (Johnson and Schippers 2017; Boedtkjer and Pedersen 2020; Lv et al. 2021). In these and other pH or buffer-sensitive cases, the use of a carbodiimide that is reactive with Gs and Us in neutral to acidic pH is recommended. Overall, this work presented substantial steps toward an improved carbodiimide for in vivo structure probing detected by both RT stops and MaP.
MATERIALS AND METHODS
In vivo chemical probing of E. coli and B. subtilis
E. coli MG1655 and B. subtilis PLBS338 were grown in LB broth until the mid-exponential phase (Yakhnin et al. 2004). All reactions using EDC, ETC, and DMS were performed in a chemical fume hood because of their toxicity. EDC and DMS were used undiluted, and ETC, a salt, was dissolved to 1.5 M in Milli-Q water. Appropriate amounts of EDC, ETC, and DMS were aliquoted into 15-mL conical tubes, and then exponential phase cell culture was transferred to the conical tubes containing EDC, ETC, or DMS to a final volume of 6 mL. The resulting mixtures were incubated in a shaking water bath for 5 min at 37°C. Reactions were quenched with 5xmolar excess of solid dithiothreitol (DTT), and incubated an additional 2 min in a shaking water bath at 37°C. Cell growth was arrested by transferring all 6 mL of treated cell cultures to 6 mL of a frozen slurry containing 10 mM Tris-HCl (pH 7.2), 5 mM MgCl2, 25 mM NaN3, 1.5 mM chloramphenicol, and 12.5% ethanol, followed by incubation for 5 min on ice. Cells were harvested by centrifugation for 20 min and washed twice with the same buffer on ice. ETC-treated cells were centrifuged for 30 min because their pellet was less stable.
RNA extraction
For ETC-treated cells, which resisted standard lysis protocols, cell pellets were resuspended in 100 μL of 10 mg/mL lysozyme and incubated for 10 min at room temperature with brief vortexing every 2 min. The cell mixture was then transferred to a 2-mL screw cap tube along with 700 μL of RLT buffer from the RNeasy Mini Kit (QIAGEN) and 700 μL of 150–212 μm acid-washed glass beads (Sigma). ETC-treated cells were lysed with a bead beater at max speed for 2.5 min three times; cells were incubated for 5 min on ice between rounds. For lysis of untreated, EDC-treated, and DMS-treated cells, cell pellets were resuspended in 100 μL of 3 mg/mL lysozyme and incubated for 20 min at 37°C. The remainder of the extraction followed the RNeasy Mini Kit instructions with final resuspension in 50 μL of water. Purified RNA samples were treated with RQ1 DNase (Promega), which was inactivated with the provided stop solution by incubating for 5 min at 65°C. Samples were brought to a final volume of 100 μL, and RNA was then ethanol precipitated by adding 10 μL 5 M NaCl, 1 μL 15 mg/mL GlycoBlue (Thermofisher), and 250 μL of 100% ethanol for every 100 μL of sample. To assess quality, 500 ng of RNA was fractionated on a 1% agarose gel and then stained with ethidium bromide.
Note that in an effort to increase ETC-modification levels, we attempted to limit the enrichment of ETC-unmodified RNAs in the extraction process. To do so, the phenol/chloroform extraction after DNase treatment was replaced with heat denaturation of DNase. This was because we noted that phenol/chloroform extractions caused a reduced yield for in vitro ETC-treated samples over untreated samples, possibly because of the positive charge on ETC-modified RNAs affecting proper separation into the aqueous phase.
In vitro chemical probing and RNA degradation assay
RNA that was synthesized using T7 RNA polymerase (RNAP) was radiolabeled at the 5′ end with 32P as previously described (Poudyal et al. 2021). Briefly, DNA templates were obtained from IDT as ultramers (see below for sequences), annealed to the T7-specific primer (5′ TAATACGACTCACTATAG-3′) in 10 mM Tris (pH 8.0) and 10 mM NaCl, transcribed using T7 RNAP in 40 mM Tris-HCl (pH 8), 4 mM DTT, 2 mM spermidine, 15 mM MgCl2, 2.5 mM each NTP, and incubated for 4 h at 37°C. RNA was gel purified with a 10% denaturing PAGE gel (8.3 M urea), followed by ethanol precipitation. The purified RNAs were dephosphorylated with shrimp alkaline phosphatase (NEB). The RNA was then 5′ end–labeled with [γ-32P]ATP and T4 polynucleotide kinase (NEB) for 30 min at 37°C. Labeled transcripts were gel purified by 10% denaturing PAGE (8.3 M urea). For DMS, EDC, or ETC treatment, a 10 μL reaction was prepared by mixing 1 μL of 500 ng RNA or ∼500,000 cpm/μL labeled RNA in reaction buffer containing final concentrations of 50 mM HEPES (pH 7.0), 50 mM KCl, and 0.5 mM MgCl2. RNA in this buffer was refolded by heating for 1 min at 95°C and then incubated on ice for 5 min, followed by incubation for 5 min at 37°C. One microliter of 10× chemical probe for final concentrations ranging from 0 to 500 mM was added to the RNA, mixed, and allowed to react for 5 min at 37°C. Mixing of 50 mM HEPES (pH 7.0) with 200 mM EDC or 200 mM ETC led to pH values of >10 and 7.2–7.5, respectively. The reaction was quenched for 2 min at 37°C with 5× molar excess DTT dissolved in water. To visualize degradation, 4 vol of loading dye containing 100% deionized formamide, 20 mM Tris-HCl (pH 8.0), 40 mM EDTA, 0.1% xylene cyanol, and 0.025% bromophenol blue was added to the reaction. The mixture was fractionated through a 10% denaturing polyacrylamide gel (8.3 M urea) at 75 W for ∼2 h. The resulting gel image was analyzed using ImageQuant to calculate percent degradation as 1 − (full length/total).
DNA ultramer template for tRNAPhe from S. cerevisiae pheV-tRNA: 5′-GAACCGGACCGAAGCCCGATTTGGATCCGGCGAACCGGATCGATGGTGCGAATTCTGTGGATCGAACACAGGACCTCCAGATCTTCAGTCTGGCGCTCTCCCAACTGAGCTAAATCCGCTTGGCCCGAAGGCCCCTATAGTGAGTCGTATTA-3′
RNA sequence for tRNAPhe from S. cerevisiae phe-tRNA: 5′-GGGGCCUUCGGGCCAAGCGGAUUUAGCUCAGUUGGGAGAGCGCCAGACUGAAGAUCUGGAGGUCCUGUGUUCGAUCCACAGAAUUCGCACCAUCGAUCCGGUUCGCCGGAUCCAAAUCGGGCUUCGGUCCGGUUC-3′
DNA ultramer template for TPP riboswitch aptamer from E. coli thiM: 5′-GAACCGGACCGAAGCCCGATTTGGATCCGGCGAACCGGATCGAGAACTTCCCTACGCTGGCATTATCCAGATCAGGTGATACGGGTATTTCTCAGCCTTCACGCAGAAGGGCACCCCGAGTCTTGGCCCGAAGGCCCTATAGTGAGTCGTATTA-3′
RNA sequence for TPP riboswitch aptamer from E. coli thiM: 5′-GGGCCUUCGGGCCAAGACUCGGGGUGCCCUUCUGCGUGAAGGCUGAGAAAUACCCGUAUCACCUGAUCUGGAUAAUGCCAGCGUAGGGAAGUUCUCGAUCCGGUUCGCCGGAUCCAAAUCGGGCUUCGGUCCGGUUC-3′
RNAs were inserted into a structure probing cassette (bold) (Merino et al. 2005).
Gene-specific reverse transcription for RT stops
RT was performed on in vivo chemical-treated total RNA extracted from E. coli or B. subtilis using 32P-5′-end radiolabeled primers for the E. coli 16S rRNA (5′-TTACTCACCCGTCCGCCACTCG-3′), B. subtilis 5S rRNA (5′-GCTTGGCGGCGTCCTACTCTC-3′), or B. subtilis 23S rRNA (5′-CTGCCTTCTCATATCCTATGAATTCAGATATGG-3′) (Mitchell et al. 2019b). For the RT reactions, 200–500 ng of total RNA in 3.5 μL of water was mixed with 1 μL of ∼500,000 cpm/μL 32P-labeled primer and 1 μL of 10× RT buffer from the SuperScript-III First-Strand Synthesis System (ThermoFisher), 200 mM Tris-HCl (pH 8.4), and 500 mM KCl, denatured for 1 min at 95°C, and cooled to 35°C to anneal the primer. Once cooled, 1 μL of 80 mM MgCl2, 1 μL of 100 mM DTT, and 1 μL of 10 mM dNTPs were added. The reaction mixture was incubated for 5 min at 35°C and then for 1 min at 55°C. Next, 1 μL of 200 U/μL SuperScript-III reverse transcriptase was added, and then further incubated for 15 min at 55°C. Following RT, 0.5 μL of 2 M NaOH was added and the reaction was incubated for 5 min at 95°C to degrade RNA and denature the enzyme. The reaction was cooled to 4°C, and an equal volume (10 μL) of 2× loading dye was added to the reaction. The mixture was fractionated through a 10% denaturing polyacrylamide gel (8.3 M urea) at 75 W for ∼2 h. The resulting gel image was analyzed using semi-automated footprinting analysis software (SAFA) (Das et al. 2005) and ImageQuant. The significance of modifications was calculated as described previously (Mitchell et al. 2019b). Briefly, the mean and standard deviation of unmodified residues were calculated for each lane. The number of standard deviations away from this mean was reported as “SD.”
Calculation of solvent-accessible surface area
The solvent radius was estimated by measuring the narrowest width of an ETC molecule about the carbodiimide using PyMOL's measurement wizard and dividing it by 2, which was 2.25 Å. The solvent-accessible surface area was calculated using the get_area command in PyMOL for the ETC reactive atom, with dot solvent set to 1 and dot density set to 3 (Schrödinger and DeLano 2023). Fully solvent-inaccessible residues had a reported surface area of 0 Å2. PDB 70S structures 4ybb and 8buu were used for E. coli and B. subtilis, respectively.
Mutational profiling library preparation
Sequencing libraries were prepared using in vivo RNA from E. coli treated with 200 mM ETC, 300 mM ETC, 100 mM DMS, or the untreated control. Pilot experiments for 200 mM ETC-treated and untreated control RNA detected by TGIRT-III at 65°C, TGIRT-III at 70°C, Marathon RT, SuperScript-II, and HIV-RT, along with 300 mM ETC-treated and 100 mM DMS-treated RNA detected with TGIRT-III at 65°C were performed in single biological replicates to test initial RT conditions. Follow-up experiments to refine extension temperature with TGIRT-III for 200 mM ETC-treated and untreated control RNA testing RT extension temperature at 50°C, 55°C, and 65°C were performed in biological triplicate, alongside the positive control of 100 mM DMS-treated RNA detected by TGIRT-III at 55°C. In all cases, an equal number of negative untreated controls were prepared for each treated condition.
Sequencing libraries for Illumina paired-end 150 × 150 Next-Seq 2000 were prepared by adapting the xGen Broad-Range RNA Library Preparation Kit (IDT) protocol. One hundred and fifty nanograms of total RNA was dissolved in 7 μL in water and mixed with 1 μL of RNA Reagent F1 (random primers), 4 μL of RNA buffer F3, and 2 μL of RNA buffer F4. This mixture was heated for 3 min to 94°C to fragment the RNA and then immediately chilled for 2 min on ice. Library preparation varied only at the RT reaction as follows.
-
For libraries with TGIRT-III, a mixture of 2 μL of TGIRT-III enzyme (Ingex), 1 μL of R1 (RNase inhibitor), and 2 μL of 50 mM DTT was added to the fragmented RNA and incubated for 10 min at room temperature before 2 μL of RNA Reagent F2 (dNTPs) was added. The RT began with incubation for 20 min at 20°C and 30 min at 42°C, followed by extension for 45 min at 50°C, 55°C, 60°C, 65°C, or 70°C.
-
For libraries with Marathon RT, a mixture of 1 μL Marathon RT enzyme (Kerafast), 1 μL of R1, 0.5 μL of 200 mM DTT, 0.5 μL of 80 mM MnCl2, and 4 μL of 100% glycerol was added to the fragmented RNA and incubated for 10 min at room temperature before 2 μL of RNA reagent F2 was added. The RT reaction was carried out for 3 h at 42°C.
-
For libraries with SuperScript-II, a mixture of 2 μL SuperScript-II enzyme (ThermoFisher), 1 μL of R1, 1 μL of 200 mM DTT, and 1 μL of 60 mM MnCl2 was added to the fragmented RNA and incubated for 10 min at room temperature before 2 μL of RNA reagent F2 was added. The RT reaction was carried out for 3 h at 42°C.
-
For libraries with HIV-RT, a mixture of 2 μL HIV-RT enzyme (Worthington Biochemical Corporation), 1 μL of R1, and 2 μL of 100 mM DTT was added to the fragmented RNA and incubated for 10 min at room temperature before 2 μL of RNA reagent F2 was added. The RT reaction was carried out for 1 h at 37°C.
Following RT, RNA was degraded with 1 μL of 4 M NaOH and incubated for 3 min at 95°C and then cooled to 4°C. An equal molar amount of HCl was added to neutralize the mixture, and then 26 μL of low EDTA TE buffer provided by the library kit was added to bring the sample to 50 μL. A size-selection cleanup with AMPure XP beads (Beckman Coulter) was performed with 90 μL of beads and eluted in 12 μL of low EDTA TE buffer. Ten microliters of the eluate was transferred to a fresh tube before continuing with the adaptase, extension, ligation, and indexing PCR with TruSeq Illumina primers as instructed in the kit. Rather than a final AMPure XP bead cleanup, amplified cDNA was purified by an 8% nondenaturing polyacrylamide gel extraction (150–600 bp) and ethanol precipitation.
Identification and analysis of reactive residues
Paired-end sequencing reads were first trimmed with cutadapt to remove sequencing primers and the 10-nt random sequence from the adaptase step (cutadapt -a NNNNNNNNNNAGATCGGAAGAGCACACGTCTGAACTCCAGTCA -A AGATCGGAAGAGCGTCGTGTAGGGAAAGA -g AGATCGGAAGAGCGTCGTGTAGGGAAAGA -G TGACTGGAGTTCAGACGTGTGCTCTTCCGATCTNNNNNNNNNN -q 30,30 -m 20) (Martin 2011). For analysis without filtering mutations, trimmed reads were then processed using ShapeMapper 2 with Bowtie 2 alignment and a random primer length of 10 nt (Busan and Weeks 2018). The mutation types were quantified using the output from ‐‐output-counted-mutations. To apply mutation filtering, the ‐‐dms flag was used. Background-subtracted mutation rates from ShapeMapper 2 were 2%–8% normalized with all four residues together within a transcript for final reactivity calculations. As in ShapeMapper 2, any residue with an untreated mutation rate over 0.05% was removed from the analysis. A graphical representation of data was created using the R packages ggplot2 (Wickham 2016), pROC (Robin et al. 2011), and rstatix (Kassambara 2023). For significance tests, P-values >0.5 were marked as “ns”, ≤0.05 and >0.01 were marked as “*”, ≤0.01 and >0.001 were marked as “**”, ≤0.001 and >0.0001 were marked as “***”, and <0.0001 were marked as “****.”
In silico folding of rRNA domains
Transcripts were folded with RNAstructure (Reuter and Mathews 2010) by applying DMS reactivities for A and C and ETC reactivities for G and U using the SHAPE restraint equation with an intercept
of −0.6 and slope of 1.8 for both chemicals. RNAstructure was also used to create the circle diagrams comparing predicted
and accepted structure, as well as to calculate the PPV and sensitivity used to calculate the MCC as a single metric of prediction
accuracy as follows:
Droplet imaging
Glass slides were first cleaned by soaking in a saturated potassium hydroxide solution (≥85%, Sigma) in 90% isopropanol (Ricca Chemical Company) for 30 min, rinsed with water, and dried at 70°C. Slides were oligoethylene glycol–functionalized as previously published (Razunguzwa et al. 2006). Briefly, slides were incubated for 2 h in a 0.3% solution of N-(triethoxysilylpropyl)-o-polyethylene oxide urethane (95%, Gelest) in anhydrous toluene (99.8%, EMD Millipore) for 2 h. Slides were then washed three times with toluene, then ethanol (190 proof, Koptec), and finally water, and dried at 70°C overnight. Samples were prepared as described in the in vitro probing section, with 100 mM EDC, CMCT, or ETC. Samples were sandwiched between a functionalized slide and a micro cover glass (no. 1.5, 24 × 30 mm, VWR), separated by a silicon spacer (Press-to-Seal Silicone Isolator, Thermo Fisher Scientific) with a 20-mm internal diameter and 0.5-mm depth. Slides were then placed on top of a Nikon Plan APOx100/1.40 oil objective, and transmitted light imaging of samples was performed using a Nikon Eclipse TE200 inverted microscope equipped with Image-Pro Plus 7.0 software. Images were analyzed using ImageJ software.
DATA DEPOSITION
Sequencing data are available at the Gene Expression Omnibus (GEO) database at NCBI, accession GSE 254895.
SUPPLEMENTAL MATERIAL
Supplemental material is available for this article.
ACKNOWLEDGMENTS
We thank Jiaqi Pei for his work visualizing droplets and Dr. Sarah Assmann for helpful comments on the manuscript. We also thank the Genomics Core Facility at Pennsylvania State University for assistance with sequencing experiments. We also thank Dr. Silvi Rouskin and Dr. Amir Brinvanlou for helpful suggestions and protocols for mutational profiling, and Dr. Joseph Reese for helpful suggestions on RNA isolation. This work was supported by the National Institutes of Health grant R35-GM127064 (P.C.B.) and the National Institutes of Health grant RO1-GM098399 (P.B.). Support for C.A.D. was provided in part by NIH Training grant 5T32GM125592.
Footnotes
-
Article is online at http://www.rnajournal.org/cgi/doi/10.1261/rna.079974.124.
- Received February 2, 2024.
- Accepted April 5, 2024.
This article is distributed exclusively by the RNA Society for the first 12 months after the full-issue publication date (see http://rnajournal.cshlp.org/site/misc/terms.xhtml). After 12 months, it is available under a Creative Commons License (Attribution-NonCommercial 4.0 International), as described at http://creativecommons.org/licenses/by-nc/4.0/.
REFERENCES
MEET THE FIRST AUTHOR

Meet the First Author(s) is an editorial feature within RNA, in which the first author(s) of research-based papers in each issue have the opportunity to introduce themselves and their work to readers of RNA and the RNA research community. Catherine A. Douds is the first author of this paper, “A new reagent for in vivo structure probing of RNA G and U residues that improves RNA structure prediction alone and combined with DMS.” Catherine is a graduate student in Philip C. Bevilacqua's laboratory at Penn State University. Her work focuses generally on improving RNA structure prediction by refining chemical structure probing methods.
What are the major results described in your paper and how do they impact this branch of the field?
This paper presents a novel in vivo chemical probe for RNA structure at Gs and Us, 1-ethyl-3-(3-dimethylaminopropyl) carbodiimide methiodide (ETC). Alone, this chemical improves RNA structure prediction of the E. coli ribosomal subunits over sequence alone, albeit less than DMS. When reactivity from these chemicals is combined for full nucleotide resolution at the Watson–Crick face, the structure prediction accuracy increases even more.
What led you to study RNA or this aspect of RNA science?
As the field of chemical structure probing advances, new methodology uses mutational profiling for detecting multiple chemical adducts per read, allowing for deconvolution of specific structural conformations. However, previously, there was not a chemical for probing the Watson–Crick face of Gs and Us by mutation profiling, only As and Cs. By developing ETC as a new chemical with modification levels high enough for mutational profiling, we now have full nucleotide resolution of probes at the Watson–Crick face that improves RNA structure prediction.
During the course of these experiments, were there any surprising results or particular difficulties that altered your thinking and subsequent focus?
When we started this project, we expected ETC to behave similarly to its sister chemical, EDC, but with reduced degradation. However, the more we progressed the more confusing some of the results became. Although ETC did not seem to cause RNA degradation in the same way, we had issues of decreased in vivo yields and streakiness of in vitro reactions on gels. But after long discussions with our colleague, Jiaqi Pei, many of the difficulties associated with working with ETC-modified RNA could be explained by interactions between the positive charge of the modifier with the negative charge of RNA. This change in our way of thinking led us to better optimize the in vivo extraction protocols and increase the modification levels in our ETC-treated samples.
What are your subsequent near- or long-term career plans?
Through this work, I learned a lot about the design of specialized sequencing libraries as well as ways to carefully analyze the resulting data. From this, I uncovered a strong interest in bioinformatics and am planning to pursue these kinds of computational questions for improving data analyses in the future.




