


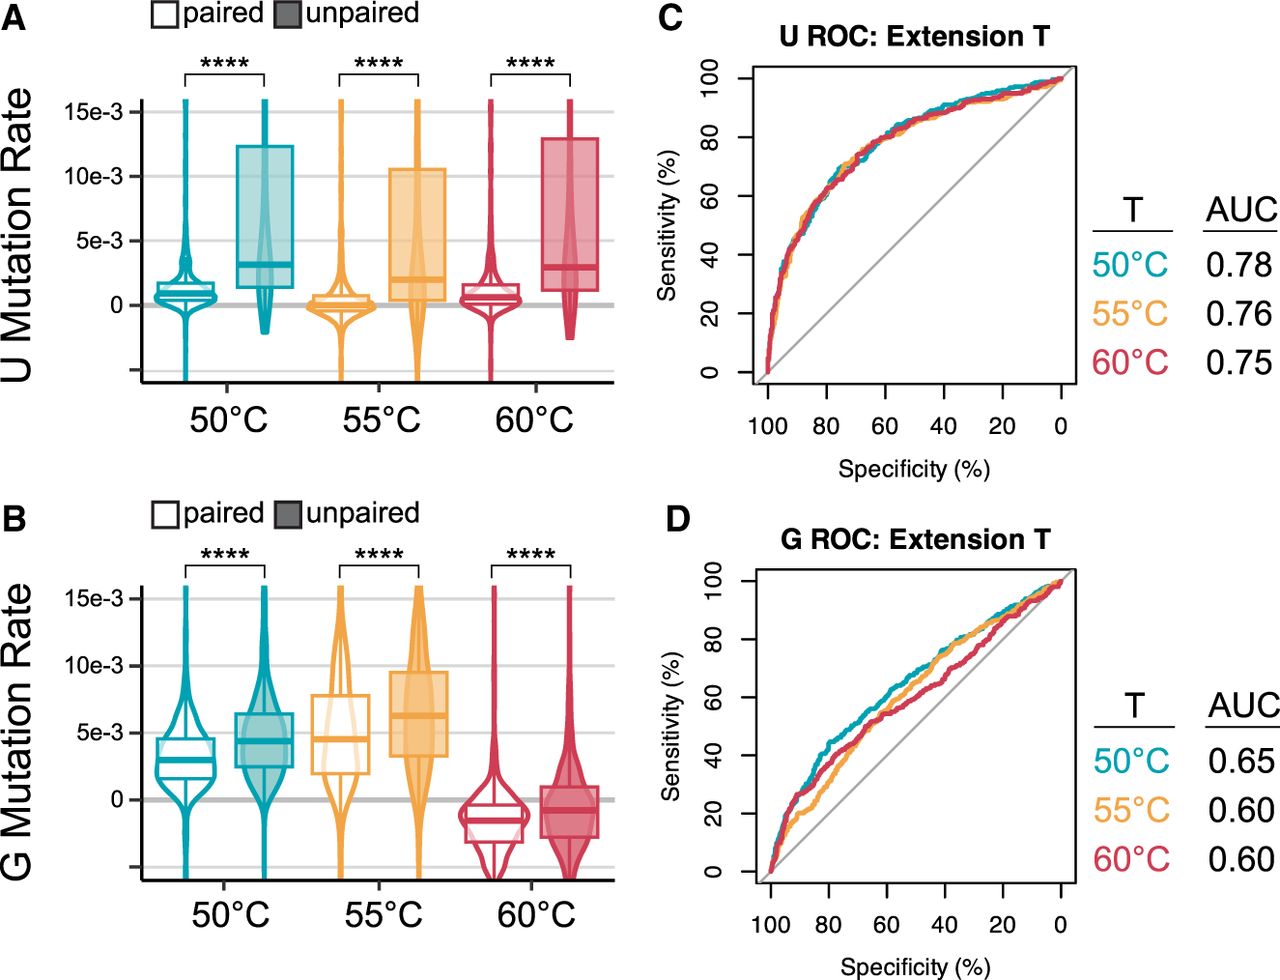
FIGURE 5.
Comparison of TGIRT-III extension temperatures for sequencing libraries of E. coli rRNA probed in vivo with ETC. (A,B) Violin plots showing background-subtracted mutation rates for paired and unpaired (A) Us and (B) Gs. Medians are provided in Supplemental Table S9. The significance of Wilcox tests is denoted with asterisks comparing paired and unpaired residues, and P-values are reported in Supplemental Table S10. The upper and lower portions of some violins were clipped to better visualize the data. (C,D) ROC curves of background-subtracted mutation rates for (C) U and (D) G at each extension temperature. Comparisons between AUCs of replicates are reported in Supplemental Table S11.




