


Improved functions for nonlinear sequence comparison using SEEKR
- 1Department of Pharmacology, University of North Carolina, Chapel Hill, North Carolina 27599, USA
- 2RNA Discovery Center, University of North Carolina, Chapel Hill, North Carolina 27599, USA
- 3Lineberger Comprehensive Cancer Center, University of North Carolina, Chapel Hill, North Carolina 27599, USA
- 4Curriculum in Bioinformatics and Computational Biology, University of North Carolina, Chapel Hill, North Carolina 27599, USA
- 5Chapel Hill High School, Chapel Hill, North Carolina 27516, USA
- Corresponding author: jmcalabr{at}med.unc.edu
-
Handling editor: Ling-Ling Chen
Abstract
SEquence Evaluation through k-mer Representation (SEEKR) is a method of sequence comparison that uses sequence substrings called k-mers to quantify the nonlinear similarity between nucleic acid species. We describe the development of new functions within SEEKR that enable end-users to estimate P-values that ascribe statistical significance to SEEKR-derived similarities, as well as visualize different aspects of k-mer similarity. We apply the new functions to identify chromatin-enriched lncRNAs that contain XIST-like sequence features, and we demonstrate the utility of applying SEEKR on lncRNA fragments to identify potential RNA-protein interaction domains. We also highlight ways in which SEEKR can be applied to augment studies of lncRNA conservation, and we outline the best practice of visualizing RNA-seq read density to evaluate support for lncRNA annotations before their in-depth study in cell types of interest.
Keywords
INTRODUCTION
Mammalian genomes produce thousands of long noncoding RNAs (lncRNAs) (Mattick et al. 2023). While the majority remain functionally uncharacterized, lncRNAs have been shown to carry out a diversity of molecular functions, which can be specified by their sequence and structural properties, or even merely through the act of their transcription. However, relative to most protein-coding RNAs, lncRNAs are poorly conserved, evolve rapidly, and rarely harbor long stretches of linear sequence similarity. As a result, identifying the sequence elements that give rise to molecular functions in lncRNAs remains a challenge (Mattick et al. 2023).
In 2018, we reported the development of a simple algorithm to perform nonlinear sequence comparison, called SEquence Evaluation through k-mer Representation (SEEKR). SEEKR estimates the similarity of pairs of lncRNAs by standardizing their length-normalized k-mer frequencies relative to those found in a larger, user-specified set of background sequences. Using SEEKR, we showed that k-mer content can be used to identify similarities in protein-binding and localization between lncRNAs, and to identify lncRNA sequences that may share molecular functions. The main outputs of SEEKR are lists of standardized k-mer contents within the sequences being compared (i.e., their “k-mer profiles”), along with matrices of Pearson's r-values that quantify similarity in k-mer profiles between sequences. These outputs can help to identify features shared within lncRNAs of interest, even if those features are not detectable by linear alignment (Kirk et al. 2018, 2021; Sprague et al. 2019).
However, in its current form, SEEKR lacks a framework to assess the significance of k-mer similarity relative to a background expectation. In contrast, the most broadly used linear alignment algorithms present end-users with P-values that describe the significance of similarity between pairs of sequences (e.g., BLAST) (Altschul et al. 1990). These P-values enable rapid parsing of results and prioritization of similarities that may be biologically significant.
Herein, we describe the implementation of a P-value function along with other updates that improve the interpretability of k-mer similarities defined by SEEKR. As a framework to illustrate the updates, we compare the lncRNA XIST to the set of human lncRNAs annotated by GENCODE (Frankish et al. 2023). SEEKR updates are accessible through GitHub, the Python Package Index, and the Docker Hub.
RESULTS
New SEEKR functions including those to estimate significance of k-mer similarity
We developed a series of functions within the SEEKR package that enable end-users to estimate the significance of SEEKR-derived Pearson's r-values. We also created new functions to visualize different aspects of k-mer similarity, and deprecated other functions that were either redundant with new ones or difficult to install using current versions of Python (Fig. 1A). Updates to SEEKR are available for download through the Python Package Index, GitHub, and the Docker Hub (https://pypi.org/project/seekr/; https://github.com/CalabreseLab/seekr; https://hub.docker.com/r/calabreselab/seekr). A separate GitHub page contains the code and console commands used to generate the figures in this manuscript (https://github.com/CalabreseLab/seekr2.0_update_manuscript).
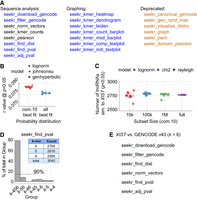
New SEEKR functions including those to estimate significance of k-mer similarity. (A) Console/command-line functions in SEEKR. Blue text, new or updated functions. Black text, retained functions. Orange text, deprecated functions. “seekr_filter_gencode” replaces “seekr_canonical_gencode.” “seekr_kmer_leiden” replaces “seekr_graph.” The “fasta-shuffle-letters” utility in the MEME Suite (Bailey et al. 2015) can be used in place of “seekr_gen_rand_rnas.” (B) Documentation of the Pearson's r-value threshold at a P-value of P = 0.05 for each probability distribution that best fits the list of r-values derived from 100,000 randomly selected pairwise comparisons from the set of GENCODE v43 Ensembl_canonical lncRNAs at k = 6. “Com.10 best fit”: pairwise comparisons fit to the common10 distributions in scipy.stats. “All best fit”: pairwise comparisons fit to all 124 probability distributions in scipy.stats. The Kolmogorov–Smirnov test was used to assess goodness-of-fit to each distribution. Fitting was repeated 10× for each of the common10 and all distributions. johnsonSU, Johnson's SU distribution. genhyperbolic, generalized hyperbolic distribution. (C) Number of lncRNAs detected as significant at the P < 0.05 threshold when fitting the set of background sequences to the common10 and at the specified subsetting sizes. (D) Number and identity of lncRNAs detected as significantly similar to XIST using k = 4, 5, or 6 when fit to a constant distribution (log-normal). (E) The SEEKR console commands used to download GENCODE lncRNAs and calculate adjusted P-values for a sequence comparison of interest. See also https://github.com/CalabreseLab/seekr2.0_update_manuscript.
As a framework to illustrate the new SEEKR functions, we describe their use in the context of identifying similarities between the lncRNA XIST and other human lncRNAs. We first outline the process of estimating the significance of SEEKR-derived Pearson's r-values before highlighting other functions in SEEKR. To estimate the significance of Pearson's r-values, SEEKR relies on a user-defined set of background sequences to determine what level of similarity would be expected between any two lncRNAs selected by chance. This set of background sequences should be large enough that the total number of pairwise comparisons between sequences in the set will generate a well-populated distribution. For studies in human or mouse, lncRNA sequences curated by GENCODE are a suitable resource (Frankish et al. 2023), and SEEKR provides a function that enables download from current and past versions of the GENCODE database. For the set of background sequences used below, we used SEEKR to download and deduplicate the list of “Ensembl_canonical” GENCODE lncRNAs that are greater than 500 nt in length (henceforth referred to as GENCODE canonical lncRNAs).
After selecting a set of background sequences, the next step in estimating significance using SEEKR is to identify what probability distribution best fits the list of SEEKR-derived Pearson's r-values generated from all possible pairwise comparisons of background sequences. Parameters describing the shape of this probability distribution are then input into the cumulative distribution function to calculate the P-value describing the likelihood that any pair of lncRNAs is more similar to each other than would be expected by chance. The function “seekr_find_dist” is used to find the probability distribution that best fits the set of background sequences, and the function “seekr_find_pval” is used to calculate the P-values from this probability distribution. Lastly, if desired, the function “seekr_adj_pval” can be used to correct P-values for multiple-testing.
For distribution fitting, “seekr_find_dist” defaults to fit the “common10” distributions defined in Python's Fitter library, and “seekr_find_pval” defaults to selecting the best-fitting distribution from the distributions examined by the user in “seekr_find_dist.” If desired, instead of fitting to the common10, end-users may fit a custom subset or all 124 of the distributions available in scipy.stats (Virtanen et al. 2020); they may also elect to select a distribution other than the best-fitting one for P-value calculations. For background sequences whose comparisons populate a normal-like distribution, such as the GENCODE canonical lncRNAs, we find that fitting to the common10 distributions is efficient and practical. However, if the accuracy of fitting at the threshold of significance is of the highest priority, using all available models in “seekr_find_dist” may be preferable to the common10. Using the set of GENCODE canonical lncRNAs at k = 6, we observed the best-fitting probability distribution from the common10 was most frequently log-normal (Fig. 1B). The best-fitting distribution from the full set of 124 in scipy.stats was most frequently Johnson's SU distribution, but still yielded Pearson's r-values at the P = 0.05 threshold that were on average only ∼3% different from the P-value threshold calculated by the log-normal (Fig. 1B). For all P-value calculations in the work below, we fit our background lncRNAs to the log-normal distribution.
In the case of large background sets, such as the set of GENCODE canonical lncRNAs, which contains 15,500 sequences, fitting a background distribution to all possible pairwise comparisons is computationally intensive and unnecessary for obtaining relatively accurate parameters that describe a distribution's shape (all possible pairwise comparisons from the GENCODE canonical set will yield 15,5002, or 240,250,000 data points in a distribution). In these instances, end-users may wish to fit distributions on a subset of pairwise comparisons that are randomly selected from the complete list. Tests on the set of GENCODE canonical lncRNAs indicate that subsetting on 100,000 values provides stable estimates of significance at low computational expense (Fig. 1C). We therefore performed subsetting on 100,000 values for all P-value calculations in our work below.
Lastly, in prior work with SEEKR, we observed that biological signals, including similarities in gene regulatory function and protein-binding, are often detected to similar extents at k-mer lengths of k = 4, 5, or 6 (Kirk et al. 2018; Sprague et al. 2019). We therefore sought to determine the extent to which significance estimates change as a function of k-mer length. We compared the lncRNA XIST to all GENCODE canonical lncRNAs at values of k ranging from k = 4–6. At a threshold of P < 0.05, these comparisons yielded a sum of 3040 distinct lncRNAs across the three values of k; 90% of the 3040 lncRNAs were detected as significantly similar to XIST using at least two different values of k, and 78% were detected as significant at all three values of k (Fig. 1D). Thus, when analyzing the significance of SEEKR-derived Pearson's r-values, different k-mer lengths detect similar sets of lncRNAs.
Putting these recommendations to use, selecting a k-mer length k = 6 and using the set of GENCODE canonical lncRNAs as both the background and the set of lncRNAs to search, we identified 2768 lncRNAs whose overall 6-mer contents are more similar to XIST than would be expected by chance; after correcting for multiple-testing using the Benjamini–Hochberg method, this list was reduced in size to 1265 lncRNAs (Fig. 1E; Table 1; Supplemental Table S1; https://github.com/CalabreseLab/seekr2.0_update_manuscript).
Top 10 most XIST-similar lncRNAs, as assessed by overall k-mer content
SEEKR functions to visualize features of k-mer similarity
To demonstrate graphing functions within SEEKR, we next investigated LINC00632, DLX6-AS1, and PCDH10-DT, which are highly similar to XIST (Table 1) and whose Ensembl_canonical transcript isoforms are strongly supported by short-read RNA-seq data (de Goede et al. 2021). XIST is thought to encode its repressive functions through the cumulative action of separate domains that interact with different subsets of proteins (Trotman et al. 2021). While full repression by XIST requires its entire sequence, some of its regions most critical for repression are comprised of tandemly repeated sequences, referred to as Repeats A, B, D, E, and F (Dixon-McDougall and Brown 2021, 2022). Therefore, to determine whether our select XIST-like lncRNAs harbored regional similarity to XIST, we separated the lncRNAs into ∼500 nt fragments and compared the fragments in each lncRNA to each fragment within XIST. Because data suggest Repeats A, B, D, E, and F function as discrete domains, we evaluated each XIST Repeat as a single intact fragment and separated the intervening XIST intervals into ∼500 fragments (Fig. 2A; Supplemental Files S1 and S2 contain fragments of XIST and all other GENCODE canonical lncRNAs used in this study, respectively). From these analyses, we found that LINC00632, DLX6-AS1, and PCDH10-DT each harbor significant similarity to Repeat E but lack similarity to the other Repeats in XIST (Fig. 2B–D). Moreover, these three lncRNAs also harbor significant similarity to fragments distributed across the final exon of XIST (Figs. 2B–D). A closer examination revealed that the similarities could be attributed to a uniform enrichment of k-mers rich in A and T nucleotides, whereas k-mers rich in G and C nucleotides were among the most variably enriched (Figs. 2E–G). We also observed that many of the 500 nt fragments within XIST’s final exon (i.e., Int.6 in Fig. 2A) were significantly more similar to each other than would be expected by chance (Fig 2H,I; Supplemental Fig. S1). We selected a k-mer length of k = 4 for these analyses, so as to reduce the number of k-mers that have zero count values in the analyzed fragments, following prior guidance described in Kirk et al. (2018) and Sprague et al. (2019). However, similar trends were detected at k-mer lengths k = 5 and 6 (Supplemental Fig. S2).
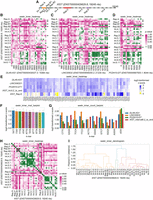
SEEKR functions to visualize features of k-mer similarity. (A) Intervals/chunks of XIST used to identify regional similarities. Repeats A–F in XIST are colored in non-gray shades and were each evaluated as single intervals, regardless of length. “Repeat F” is annotated here as a region that spans nt 743–1807 in XIST (ENST00000429829.6). (B–D) Regional similarities between XIST and LINC00632, DLX6-AS1, and PCDH10-DT. The latter three lncRNAs were separated into ∼500 nt consecutive intervals and compared to the XIST intervals in (A). Heatmaps show P-values for each comparison. Comparisons were made using k = 4. (E) Heatmap displaying log2-transformed z-scores at k = 4, for the 3′ portion of XIST (Interval 6.2 to its transcript end), Repeat E, and LINC00632, DLX6-AS1, and PCDH10-DT relative to the set of nonidentical “Ensembl_canonical” GENCODE v43 lncRNA transcripts ≥500 nt in length. Log2-transformed z-scores were derived using seekr_kmer_counts. Only those k-mers beginning with “T” nucleotides are displayed for clarity. (F) Top 10 4-mers that are the most enriched in the 3′ portion of XIST and the full-length lncRNAs from (E) relative to the set of “Ensembl_canonical” also from (E). (G) Top 10 4-mers that exhibit the most variable enrichment in the 3′ portion of XIST and the full-length lncRNAs from (E) (i.e., highest standard deviation across the RNAs). (H) Regional similarities within XIST. Heatmap shows P-values for each pairwise comparison of XIST intervals shown in (A). Comparisons were made using k = 4. (I) Dendrogram showing clusters of XIST intervals from (A) that harbor related k-mer contents. Clusters (different colors) were defined as the nodes whose correlation distances are <0.7*[max_distance_in_dendrogram]. Comparisons were made using k = 4. The SEEKR console/command line functions that were used to generate graphs are displayed above each figure panel.
Domain-based search identifies chromatin-associated lncRNAs that harbor XIST-like fragments
Given that the tandem repeats within XIST are some of the regions most essential for its ability to induce and maintain gene silencing, we next used SEEKR to perform a parallel search for XIST-like lncRNAs. In this search, we separated all 15,550 GENCODE canonical lncRNAs into ∼500 nt fragments (including XIST, as a positive control), and then used SEEKR to identify lncRNAs that contain fragments with significant k-mer similarity to XIST Repeats A, B, D, E, and F (at an unadjusted P-value of <0.05). We then summed the number of XIST-similar fragments in each lncRNA and used these sums to rank lncRNAs by their overall XIST-likeness. This analysis identified several intriguing lncRNAs (Table 2; Supplemental Table S2). As might have been expected, XIST ranked high (third). However, the known repressive lncRNA KCNQ1OT1 ranked eighth (in a tie with five other transcripts) (Schertzer et al. 2019; Quinodoz et al. 2021). Moreover, 18 of the top 22 lncRNAs were expressed at detectable levels in K562 cells, and of those 18 lncRNAs, 17 were chromatin-enriched, including the architectural lncRNA NEAT1 (Table 2; Dunham et al. 2012; Obuse and Hirose 2023). Thus, with this simple fragment-based search, we identified several chromatin-enriched lncRNAs that harbor domains that resemble those required for repression by XIST, including KCNQ1OT1 and NEAT1. Additional XIST-like transcripts of interest include ENST00000605862.6, ENST00000506640.3, and ENST00000622550.2, functionally uncharacterized lncRNAs which are both spliced and expressed in multiple cell types (Dunham et al. 2012; de Goede et al. 2021). We also identified RENO1, a conserved lncRNA whose depletion in mouse embryonic stem cells causes changes in gene expression and a failure to differentiate properly into neurons (Hezroni et al. 2020).
Top 22 XIST-like lncRNAs from GENCODE v43
The tandem repeats in XIST appear in a specific order and are thought to serve as recruitment centers for specific RNA-binding proteins (RBPs) (Trotman et al. 2021). With the possible exception of KCNQ1OT1, XIST-like fragments within the lncRNAs of Table 2 appeared in an order that was different from that found in XIST (Fig. 3). However, we hypothesized that at least some of the fragments might still associate with the same RBPs as their cognate domains in XIST. Therefore, in three lncRNAs of interest, we examined the eCLIP read density profiles of six RBPs that have been subject to eCLIP in K562 cells and exhibit characteristic enrichment in the tandem repeats in XIST (Van Nostrand et al. 2020). These RBPs included RBM15 (enriched over Repeat A); HNRNPM (enriched over Repeat F region); HNRNPK (enriched over Repeats B and D); and MATR3, PTBP1, and TIA1 (enriched over Repeat E; Fig. 3A). In all three lncRNAs, we observed XIST-like fragments that colocalized with the eCLIP signal from the expected RBPs. In KCNQ1OT1, Repeat A-, F-, and B-like fragments colocalized with RBM15, HNRNPM, and HNRNPK, respectively (Fig. 3B). In NEAT1, Repeat F-, B/D-, and E-like fragments colocalized with HNRNPM, HNRNPK, and MATR3/PTBP1/TIA1, respectively (Fig. 3C). In ENST00000605862.6, A- and B-like fragments colocalized with RBM15 and HNRNPK, respectively (Fig. 3D). Thus, while the arrangement and number of XIST-like fragments in each of those lncRNAs differs from XIST, several of their XIST-like fragments exhibited enriched association for the expected RBPs.
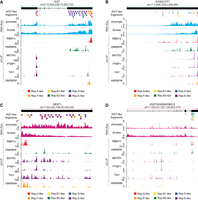
Domain-based search identifies chromatin-associated lncRNAs that harbor XIST-like fragments. (A–D) Screen images from the UCSC Genome Browser displaying gene annotations, location and identity of XIST-like fragments, read density from chromatin-associated RNA-seq and from Bru-seq, and background-corrected eCLIP signal for a subset of RBPs enriched over the tandem repeats of XIST.
XIST-like fragments in K562-expressed lncRNAs associate with XIST-binding proteins
We next examined the extent to which SEEKR-defined XIST-like fragments colocalized with XIST-binding proteins in all lncRNAs expressed in K562 cells (n = 3068; expression defined as >0.0625 TPM from total RNA-seq data [Dunham et al. 2012]). We used the Wilcoxon signed-rank test to compare eCLIP read counts in each XIST-like fragment to eCLIP read counts in a paired set of fragments that were randomly shuffled among the 3068 K562-expressed lncRNAs (excluding the regions defined by SEEKR to be XIST-like). Strikingly, we found that the cognate binding proteins of each XIST Repeat were significantly enriched over XIST-like fragments when compared to randomly shuffled controls (Fig. 4). Moreover, for all Repeats except Repeat A, the expected cognate protein(s) was the one that was the most significantly enriched over the set of corresponding XIST-like fragments. Specifically, HNRNPK was the most significantly enriched protein over Repeat B- and D-like fragments, MATR3 and PTBP1 were the most significantly enriched over Repeat E-like fragments, and HNRNPM was the most significantly enriched over Repeat F-like fragments (Fig. 4). For Repeat A-like fragments, we observed that all five proteins were significantly enriched over shuffled controls (Fig. 4); these findings can be rationalized because Repeat A is arguably the most complex of all XIST repeats, and it contains consensus binding motifs for each of the proteins we analyzed. Thus, fragment-based analyses with SEEKR can be used to identify domains in other lncRNAs that associate with proteins that exhibit enriched binding to a domain of interest.
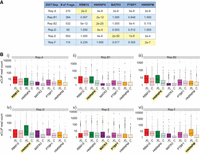
XIST-like fragments in K562-expressed lncRNAs associate with XIST-binding proteins. (A) Summary table displaying the number of K562 lncRNA fragments detected as significantly similar (P < 0.05) to each XIST Repeat (no. of Frags.), along with Bonferroni-corrected adjusted P-values from Wilcoxon signed-rank tests describing the comparison between eCLIP read density in the set of XIST-like fragments versus shuffled control fragments, for each of five XIST-binding proteins. (B) Box plots displaying eCLIP read density for select XIST-like proteins under XL, the set of detected XIST-like fragments, and C, the set of shuffled controls, for each of five XIST-binding proteins. Yellow highlights, the protein(s) that associate most robustly with each XIST Repeat (Van Nostrand et al. 2020).
Not all expressed, XIST-like lncRNA annotations are supported by RNA-seq data in K562 cells
In carrying out these analyses, we also noted that transcript annotations for certain highly ranked, expressed lncRNAs in Table 2 were not strongly supported by short-read RNA-seq data from K562 or HepG2 cells (Dunham et al. 2012). The most highly ranked XIST-similar lncRNA, HELLPAR, is annotated as an unspliced, 200 kb lncRNA that begins at the 3′ end of the protein-coding gene PARPBP and terminates near the 5′ end of the protein-coding gene IGF1 (van Dijk et al. 2012; Frankish et al. 2021). Using standard approaches to quantify transcript abundance from RNA-seq data, HELLPAR registers as being expressed and chromatin-associated in K562 cells (Table 2; Supplemental Table S2). However, RNA-seq read density suggests that transcription across the HELLPAR locus is not due to the expression of a single lncRNA. Rather, it appears to result from a combination of imprecise termination of the upstream PARPBP gene, leading to read-through transcription in the 5′ half of the HELLPAR locus, and the transcription of a separate lncRNA, LINC02456, whose promoter is found in the center of the locus and whose transcribed product runs antisense through the IGF1 protein-coding gene (Fig. 5A; Dunham et al. 2012; de Goede et al. 2021; Zhu et al. 2023).
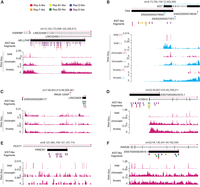
Not all expressed, XIST-like lncRNA annotations are supported by RNA-seq data in K562 cells. (A–F) Screen images from the UCSC Genome Browser displaying gene annotations, location and identity of XIST-like fragments, and read density from ribosome-depletion total RNA-seq (total), chromatin-associated RNA-seq (chromatin), and Bru-seq experiments (bruseq) performed in K562 cells (Dunham et al. 2012; Luo et al. 2020).
Likewise, again visualizing short-read RNA-seq data from Dunham et al. (2012), we found examples of other XIST-like lncRNAs that register as being expressed and chromatin-associated in K562 cells but whose transcript annotations were not strongly supported. These included TSIX, whose only RNA-seq read density coincided with the gene structure of XIST on the opposite strand, and may have arisen due to imperfect strand-specificity of the dUTP RNA-seq protocol (Fig. 5B; Levin et al. 2010); LINC02604, which is annotated as a monoexonic lncRNA but appears to be part of a much larger transcribed and spliced region (Fig. 5C); and monoexonic lncRNAs that overlap in the sense direction relative to longer protein-coding or lncRNA genes: ENST00000623075.1, PRNCR1, and ENST00000624919.1 (Fig. 5D–F). In each of these examples, RNA-seq abundance estimators register the lncRNAs as being expressed, underscoring the importance of examining RNA-seq read density relative to lncRNA transcript annotations before investigating SEEKR-derived sequence similarities.
Using the SEEKR P-value function to augment evolutionary studies of lncRNAs
We previously demonstrated that SEEKR can be applied to detect k-mer similarity in lncRNAs between different species (Kirk et al. 2018; Sprague et al. 2019). We reasoned that the newly developed P-value function in SEEKR could help to prioritize results from between-species lncRNA comparisons, just as above we demonstrated that it can help prioritize results from within-species lncRNA comparisons. Therefore, we investigated the SEEKR similarity scores of pairs of human and mouse lncRNAs that a recent study identified as potentially homologous owing to their conserved genomic locations and shared patterns of protein-binding motifs (Huang et al. 2024). Specifically, we examined two sets of lncRNAs: a set of 5564 human lncRNAs that have predicted homologs in mouse (the “HM” set); and a set of 570 human lncRNAs that have predicted homologs in mouse and zebrafish (the “HMZ” set) (Huang et al. 2024). Comparing human and mouse lncRNA pairs against the distribution of pairwise comparisons between all human lncRNAs at k-mer length k = 6, we observed that the distributions of SEEKR similarity scores in both the HM and HMZ sets exhibited significant rightward shifts, as would be expected for conserved sequences (P < 2×10⁻¹⁶ for both comparisons; Wilcoxon rank sum test [Fig. 6; Kirk et al. 2018]). About 20% of lncRNA pairs from the HM and HMZ sets harbored SEEKR-derived 6-mer contents that were more similar to each other than would be expected by chance, using the set of all human lncRNAs as background (P < 0.05; 1222 of 7355 pairs in the HM set and 165 of 570 lncRNA pairs in the HMZ set; Fig. 6; orange bars). At the level of 6-mer content, most of the significantly similar pairs were less similar to each other than lncRNAs known to exhibit strong conservation, such as H19, NEAT1, XIST, MALAT1, and KCNQ1OT1 (Fig. 6; orange bars vs. green lines). Examining further the set of 165 HMZ lncRNA pairs that harbored significant k-mer similarity to each other, we identified two pairs of human/mouse lncRNAs that each harbored a high number of fragments similar to XIST’s tandem repeat regions: HRAT92 (human) and 6330403L08Rik (mouse); and SNHG14 (human) and 9330162G02Rik (mouse). We defined a “high” number of fragments in this analysis as any lncRNA that had greater than seven XIST-like fragments, which corresponds to a fragment count that ranks in the 99.5% or greater when considering all GENCODE canonical human lncRNAs (Supplemental Tables S2 and S3). These analyses demonstrate ways in which SEEKR can be used to prioritize similarity between lncRNAs across species to augment other approaches to study evolutionary relationships.
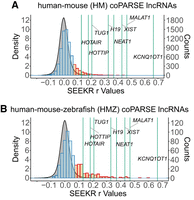
Using the SEEKR P-value function to augment evolutionary studies of lncRNAs. (A,B) Distributions of SEEKR-derived r-values calculated using k = 6 for all human–mouse lncRNA pairs defined as coPARSE in human and mouse (A; HM set) and human, mouse, and zebrafish (B; HMZ) set (Huang et al. 2024). HM and HMZ r-values are binned in discrete bars, with corresponding counts shown on the right-hand y-axes. Orange bars, binned counts of lncRNA pairs whose P-values of similarity are <0.05; blue bars, all other bins. Green lines mark SEEKR-derived r-values between exemplar pairs of conserved human and mouse lncRNAs. SEEKR-derived r-values for all pairwise comparisons of human lncRNAs are shown as continuous gray distributions whose densities are displayed on the left-hand y-axes.
DISCUSSION
We describe a series of updates to the SEEKR package that enable enhanced interpretation of SEEKR-derived similarity metrics. The updates were designed for application to lncRNAs but can be applied to the study of any nucleotide sequence. SEEKR is written in Python and can be installed via the Python Package Index, GitHub, or the Docker Hub (https://pypi.org/project/seekr/; https://github.com/CalabreseLab/seekr; https://hub.docker.com/r/calabreselab/seekr). The major functions of SEEKR can be implemented via the UNIX console, facilitating their use by biologists with little or no experience with Python. The SEEKR, Python, and UNIX commands used in the analyses above can be found in the GitHub page associated with this manuscript (https://github.com/CalabreseLab/seekr2.0_update_manuscript).
To illustrate the use of the new SEEKR functions, we applied them to the discovery and study of XIST-like lncRNAs in the human transcriptome. With a minimal set of commands and python code, we identified several lncRNAs that harbor XIST-like sequence features. Searches for whole-transcript similarity to XIST followed by fragment-based analyses highlighted three lncRNAs—LINC00632, DLX6-AS1, and PCDH10-DT—that contained regions similar to XIST Repeat E and its terminal exons, which likely serve architectural roles in XIST but may also enable recruitment of certain histone-modifying enzymes (Yamada et al. 2015; Sunwoo et al. 2017; Yue et al. 2017; Pandya-Jones et al. 2020; Dixon-McDougall and Brown 2022). We also observed an overall enrichment for A- and T-rich k-mers contained within the final long exon of XIST, although the biological significance of this enrichment is unclear.
A fragment-based search for regions similar to the tandem repeats in XIST identified a different set of XIST-like lncRNAs. Here, the known repressive lncRNA KCNQ1OT1 ranked eighth among 15,550 lncRNAs queried, and nearly every lncRNA in the top 22 was enriched in the chromatin fraction of K562 cells. A significant number of XIST-like fragments in these and other lncRNAs colocalized with expected sets of XIST-associated RBPs.
Our results underscore the utility of fragment-based k-mer searches, particularly when the query and target lncRNAs are substantially longer than the presumed functional modules within them (Sprague et al. 2019). For example, the tandem repeats in XIST are each locally enriched in different k-mers that presumably underlie their ability to interact with different protein cofactors. However, local k-mer enrichments are diluted when the ∼19 kb long XIST transcript is analyzed as a whole, as are the local enrichments of potentially analogous domains in other lncRNAs. Instead, by using XIST’s tandem repeats as query features in fragment-based searches, we were able to detect regional similarities between XIST and other lncRNAs that were not apparent in whole-transcript similarity searches. The likelihood that these regional similarities have biological relevance is underscored by the fact that on the whole, XIST-like domains in other lncRNAs exhibited enriched associations with known XIST-binding proteins. These same searches highlight the utility of P-value assessments as a way to threshold SEEKR-derived r-values and focus on the most significant similarities.
Additionally, several prior studies have used different approaches to infer evolutionary relationships between pairs of lncRNAs, which remains a significant challenge in the field (Necsulea et al. 2014; Hezroni et al. 2015; Ross 2021; Huang et al. 2024). SEEKR can be applied in conjunction with any of these approaches to help contextualize as well as prioritize predicted evolutionary relationships for further study.
Lastly, as a corollary to demonstrating SEEKR's new functions, we highlight the best practice of using RNA-seq data to evaluate lncRNA annotations for support after identifying sequence similarities using SEEKR. From our analyses, we identified XIST-like domains in several lncRNA transcript annotations that were expressed at detectable levels in K562 cells but were not optimal representations of the lncRNAs produced from those genomic regions. In the GitHub page associated with this manuscript, we describe how to use custom scripts and standard genomic tools to convert RNA-seq alignments into wiggle tracks for display in the UCSC Genome Browser (i.e., STAR, Samtools, and BEDtools (Li et al. 2009; Quinlan and Hall 2010; Dobin et al. 2013; Raney et al. 2014; https://github.com/CalabreseLab/seekr2.0_update_manuscript). We have found that visual inspection of RNA-seq alignments in this way is a simple yet powerful approach to evaluate the support for lncRNA transcript annotations before their experimental characterization. Our analyses also highlight a need for continued efforts to improve lncRNA annotations, even within the human genome, which is the best annotated among vertebrates.
MATERIALS AND METHODS
SEEKR analyses
The Python code and console commands used for k-mer analyses in each figure and table can be found in https://github.com/CalabreseLab/seekr2.0_update_manuscript. SEEKR updates can be installed via the Python Package Index, via GitHub, or via the Docker Hub (instructions found on https://github.com/CalabreseLab/seekr). Supplemental Files S1 and S2 contain fragments of XIST and all other GENCODE canonical lncRNAs, respectively. The community graph in Supplemental Figure S1 was made using Gephi (Bastian et al. 2009).
Analysis of ENCODE RNA- and Bru-seq data
RNA-seq and Bru-seq data sets were downloaded from the ENCODE portal (https://www.encodeproject.org/) (Dunham et al. 2012; Luo et al. 2020). From K562 cells, the data sets used were: total RNA-seq (ENCSR885DVH), fractionated RNA-seq (chromatin: ENCSR000CPY; poly(A) cytosolic: ENCSR000COK), Bru-seq (ENCSR729WFH), and Bru-Chase (2 h: ENCSR633UIR; 6 h: ENCSR762OPQ). From HepG2 cells, the data sets used were: total RNA-seq (ENCSR181ZGR), Bru-seq (ENCSR974AQD), Bru-Chase (2 h: ENCSR295FEH; 6 h: ENCSR135DZR). Using the STAR aligner, a genomic index was generated using the GRCh38 primary assembly genome FASTA and the GENCODE v43 basic annotation GTF using the ‐‐sjdbGTFfile FLAG. Individual replicates from each experiment were then aligned (Dobin et al. 2013). Alignments were filtered for quality using Samtools view with the -q 30 FLAG, and the FASTQ sequences for mate pairs R1 and R2 were extracted by samtools fasta, providing the alignments as paired end inputs and the -s FLAG to filter out any singletons (Li et al. 2009). Using kallisto, FASTQ files were aligned to a set of sequences extracted from the GENCODE GRCh38 v43 basic annotation GTF combined with additional transcript sequences that contained all exons and introns from the earliest start to the latest end of each nonmonoexonic v43 gene (Bray et al. 2016; Frankish et al. 2023). Expression values for each GENCODE canonical lncRNA are reported in Supplemental Table S2.
Visualization of RNA-seq data in the UCSC Genome Browser
Using the quality-filtered STAR alignments from the K562 chromatin fraction RNA-seq (ENCSR000CPY) and K562 Bru-seq (ENCSR729WFH) data sets, replicates were merged with Samtools using the samtools merge command (Quinlan and Hall 2010). To extract negative-stranded data from the merged replicate files (both of which were reverse-stranded, paired-ended RNA-seq experiments), the samtools view -h -f 99, and samtools view -h -f 147 commands were used followed by samtools merge. Conversely, to extract positive-stranded data from the merged replicate files, the samtools view -h -f 83 and samtools view -h -f 163 were used followed by samtools merge. These filtered and merged BAM files were converted to BED12 files using BEDtools (Quinlan and Hall 2010). The number of aligned reads were counted from the original filtered and merged alignments using Samtools (Li et al. 2009). A Python script (make_wiggle_tracks_1_11_24.py) was then used to generate wiggles from BED12 files. Wiggles were converted into bigWigs using the ucsctools/320 wigToBigWig command (Kent et al. 2010). See the GitHub page for line-by-line code (https://github.com/CalabreseLab/seekr2.0_update_manuscript).
Visualization of (s)eCLIP data in the UCSC Genome Browser
BAM and BED files from (s)eCLIP data experiments (E) and their matched mock input control experiments (C) were downloaded from the ENCODE portal (https://www.encodeproject.org/) for six RBPs: RBM15 (E: ENCSR196INN, C: ENCSR454EER); MATR3 (E: ENCSR440SUX, C: ENCSR183FVK); PTBP1 (E: ENCSR981WKN, C: ENCSR445FZX); TIA1 (E: ENCSR057DWB, C: ENCSR356GCJ); HNRNPK (E: ENCSR953ZOA, C: ENCSR143CTS); and HNRNPM (E: ENCSR412NOW, C: ENCSR212ILN) (Dunham et al. 2012; Van Nostrand et al. 2016; Luo et al. 2020).
Replicates from CLIP experiments were downsampled before merging for visualization. The number of aligned reads from each replicate (GRCh38-aligned BAM files) was determined using samtools view -c (Li et al. 2009). Replicates were downsampled first by determining the minimum read count between replicates, and then the downsampling_fraction was calculated as follows: [1 – (replicate 1 read counts – replicate 2 read counts)/(minimum read count between the replicates)]. The downsampling_fraction was used in samtools view -b -s < downsampling_fraction > to reduce the size of the larger data set. Downsampled replicates were merged, filtered for MAPQ > 30, and split by strand using Samtools (Li et al. 2009). For eCLIP experiments, samtools view -b -q 30 -f 144 was used to retrieve the second mate of the negative-stranded data, while samtools view -b -q 30 -f 160 was used to retrieve the second mate of the positive-stranded data. For the seCLIP experiments, samtools view -b -q 30 -f 16 was used to retrieve the negative-stranded data, while samtools view -b -q 30 -F 16 was used to retrieve the positive-stranded data. The ENCODE peak BED files for replicates from each experiment were downloaded and sorted with BEDtools (Quinlan and Hall 2010). For each downsampled and merged eCLIP BAM file, the reads under the peaks from each replicate were extracted using bedtools intersect -split -ubam, and the resultant BAM files were merged with Samtools (Quinlan and Hall 2010). The reads under the same set of peaks were likewise extracted and merged from the corresponding mock input controls.
Wiggle tracks were then created as described in the RNA-seq section above. Specifically, peak-extracted BAM files were converted to BED12 files using BEDtools (Quinlan and Hall 2010). The number of aligned reads from the original filtered, downsampled, and merged alignments (prepeak filtering) were counted with Samtools (Li et al. 2009). A custom Python script (make_wiggle_tracks_1_11_24.py) was then used to generate wiggles from BED12 files. Signal for each eCLIP wiggle file was then normalized relative to its corresponding control by subtracting the signal in each bin of the control wiggle from the signal in the same bin of the experiment wiggle. Negative values were excluded. This process was completed with the control_normalize_wiggles_2_20_24.py script. Wiggles were then converted into bigWigs using the ucsctools/320 wigToBigWig command (Kent et al. 2010). See the GitHub page for line-by-line code (https://github.com/CalabreseLab/seekr2.0_update_manuscript).
Evaluation of (s)eCLIP density over XIST-like lncRNA fragments
A list of lncRNAs expressed in K562 cells (>0.0625 TPM) was compiled from Supplemental Table S2, using total RNA-seq data from https://www.encodeproject.org/ (Dunham et al. 2012; Luo et al. 2020) (ENCSR885DVH). Expressed lncRNAs were separated into ∼500 nt fragments using Python code outlined in https://github.com/CalabreseLab/seekr2.0_update_manuscript. Each lncRNA fragment was searched for similarity to each XIST repeat region using SEEKR, and those fragments whose SEEKR-derived r-values passed a P-value threshold of <0.05 (unadjusted) were retained as significant. LncRNA fragment coordinates were converted into genome coordinates (hg38) by adding (or subtracting, for negative-stranded genes) the fragment start position within its host transcript to the genomic coordinate of the corresponding exon of the host transcript. Fragments overlapping splice junctions were split into one fragment per exon before converting into genomic coordinates. A corresponding set of shuffled controls for each XIST repeat was created by starting with the same list of lncRNAs expressed in K562 cells, excluding those lncRNAs that harbored a fragment with significant similarity to the XIST repeat in question, and randomly selecting one fragment from this set of lncRNA sequences that was equal in length to its corresponding XIST-similar fragment. (s)eCLIP reads under the XIST-similar and control fragments were counted using BEDtools multicov (Quinlan and Hall 2010). (s)eCLIP data sets used were RBM15 (ENCSR196INN); MATR3 (ENCSR440SUX); PTBP1 (ENCSR981WKN); TIA1 (ENCSR057DWB); HNRNPK (ENCSR953ZOA); and HNRNPM (ENCSR412NOW) (Dunham et al. 2012; Van Nostrand et al. 2016; Luo et al. 2020).
SUPPLEMENTAL MATERIAL
Supplemental material is available for this article.
ACKNOWLEDGMENTS
This work was supported by the National Science Foundation (DBI-2228805), the National Institutes of Health (R35GM153293), and the Yang Biomedical Scholars Award to J.M.C.
Footnotes
-
Article is online at http://www.rnajournal.org/cgi/doi/10.1261/rna.080188.124.
- Received July 11, 2024.
- Accepted August 4, 2024.
This article is distributed exclusively by the RNA Society for the first 12 months after the full-issue publication date (see http://rnajournal.cshlp.org/site/misc/terms.xhtml). After 12 months, it is available under a Creative Commons License (Attribution-NonCommercial 4.0 International), as described at http://creativecommons.org/licenses/by-nc/4.0/.
REFERENCES
MEET THE FIRST AUTHOR

Meet the First Author is an editorial feature within RNA, in which the first author(s) of research-based papers in each issue have the opportunity to introduce themselves and their work to readers of RNA and the RNA research community. Shuang Li is the first author of this paper, “Improved functions for nonlinear sequence comparison using SEEKR.” Shuang is a research associate in the lab of J. Mauro Calabrese, in the Department of Pharmacology at the UNC Chapel Hill School of Medicine. Shuang's research focuses on the development and application of statistics and visualization tools of the SEEKR package, which quantifies k-mers-based nonlinear similarity.
What are the major results described in your paper and how do they impact this branch of the field?
The statistical and visual updates to SEEKR enable easier and clearer ways to quantify and locate nonlinear sequence similarities that bear biological relevance in long noncoding RNAs, which could also be applied across species to query evolutionary conservations. With three ways to implement it, the new SEEKR package accommodates users with little to no coding experience as well as professional bioinformaticians.
What led you to study RNA or this aspect of RNA science?
Long noncoding RNAs (lncRNAs) carry out various essential molecular functions through their sequence features, structural properties, or even merely the act of their transcription. Because of the rapidly evolving nature of lncRNAs, it is challenging to connect sequence features with biological functions. As a scientist fascinated with complicated data analysis, I was drawn to the challenge of putting in place this one piece of the puzzle.
During the course of these experiments, were there any surprising results or particular difficulties that altered your thinking and subsequent focus?
When we went through highly ranked candidate lncRNAs that bear XIST-like domains, we came across multiple transcripts that passed our expression threshold in K562 cells, but their annotations were not supported by short-read RNA-seq data, which was obvious when illustrated by wiggle tracks. As the human genome is the best annotated among vertebrates, the amount of unsupported lncRNAs we encountered during the analysis surprised us. Quinn Eberhard, who is among the authors of this paper, is taking the leadership to tackle this problem. Please stay tuned for her updates.
What are your subsequent near- or long-term career plans?
For the next phase, I want to explore and investigate how deep learning can be applied to our biological questions. We have several well-built models, such as DNABERT-2 and AlphaFold3, which integrate enormous sequence data with physical, chemical, and structural properties. These models could then serve as a basis for developing new models that are easier to train and more focused to a particular question. My goal would be to accomplish a small machine learning project to improve the SEEKR package.




