


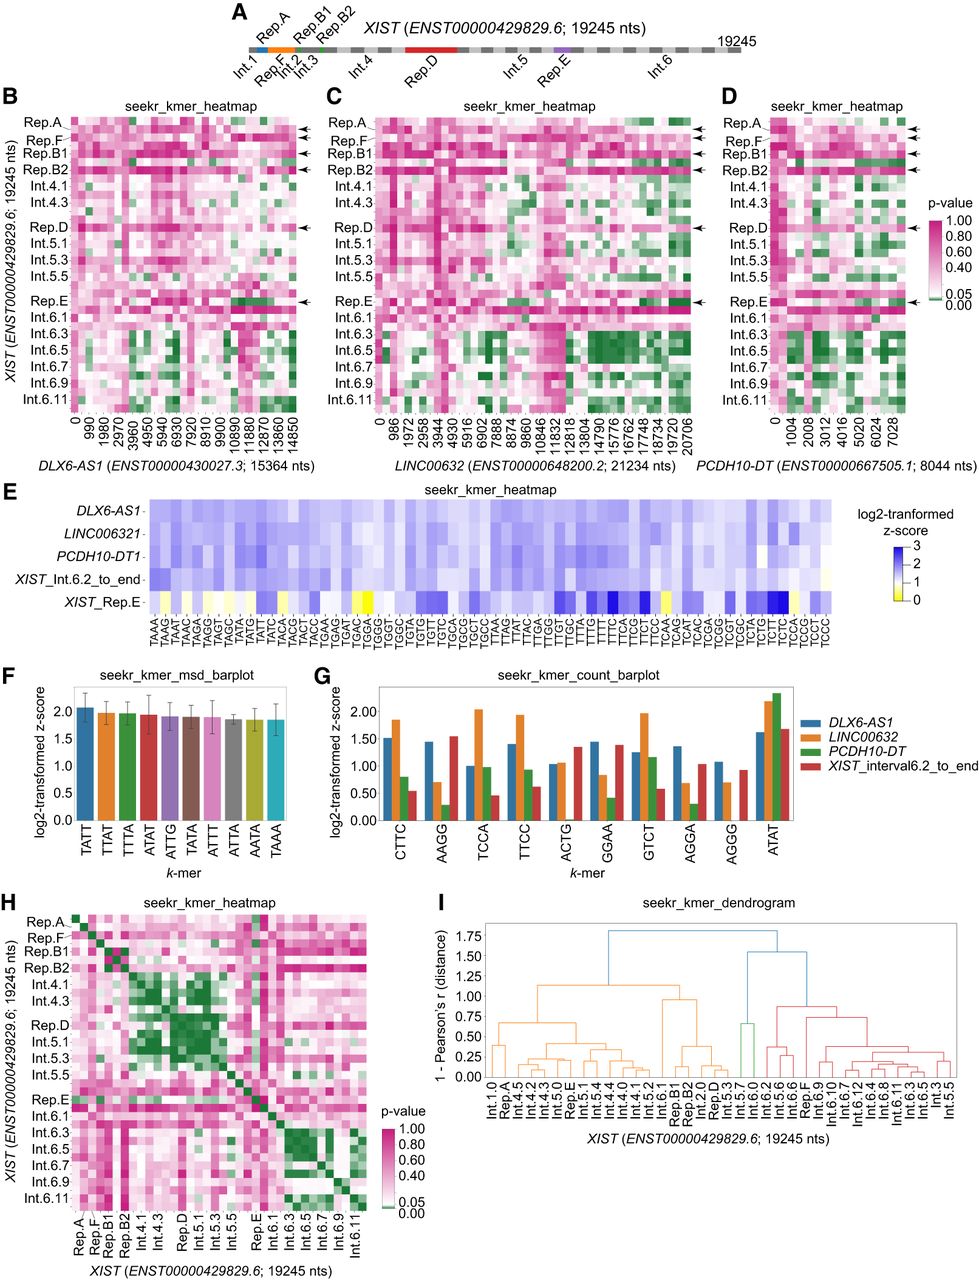
SEEKR functions to visualize features of k-mer similarity. (A) Intervals/chunks of XIST used to identify regional similarities. Repeats A–F in XIST are colored in non-gray shades and were each evaluated as single intervals, regardless of length. “Repeat F” is annotated here as a region that spans nt 743–1807 in XIST (ENST00000429829.6). (B–D) Regional similarities between XIST and LINC00632, DLX6-AS1, and PCDH10-DT. The latter three lncRNAs were separated into ∼500 nt consecutive intervals and compared to the XIST intervals in (A). Heatmaps show P-values for each comparison. Comparisons were made using k = 4. (E) Heatmap displaying log2-transformed z-scores at k = 4, for the 3′ portion of XIST (Interval 6.2 to its transcript end), Repeat E, and LINC00632, DLX6-AS1, and PCDH10-DT relative to the set of nonidentical “Ensembl_canonical” GENCODE v43 lncRNA transcripts ≥500 nt in length. Log2-transformed z-scores were derived using seekr_kmer_counts. Only those k-mers beginning with “T” nucleotides are displayed for clarity. (F) Top 10 4-mers that are the most enriched in the 3′ portion of XIST and the full-length lncRNAs from (E) relative to the set of “Ensembl_canonical” also from (E). (G) Top 10 4-mers that exhibit the most variable enrichment in the 3′ portion of XIST and the full-length lncRNAs from (E) (i.e., highest standard deviation across the RNAs). (H) Regional similarities within XIST. Heatmap shows P-values for each pairwise comparison of XIST intervals shown in (A). Comparisons were made using k = 4. (I) Dendrogram showing clusters of XIST intervals from (A) that harbor related k-mer contents. Clusters (different colors) were defined as the nodes whose correlation distances are <0.7*[max_distance_in_dendrogram]. Comparisons were made using k = 4. The SEEKR console/command line functions that were used to generate graphs are displayed above each figure panel.




