


Impact on splicing in Saccharomyces cerevisiae of random 50-base sequences inserted into an intron
- 1Department of Genome Sciences, University of Washington, Seattle, Washington 98195, USA
- 2Paul G. Allen School of Computer Science and Engineering, University of Washington, Seattle, Washington 98195, USA
- 3Department of Medicine, University of Washington, Seattle, Washington 98195, USA
- Corresponding authors: fields{at}uw.edu, cuperusj{at}uw.edu
-
Handling editor: Benjamin Blencowe
Abstract
Intron splicing is a key regulatory step in gene expression in eukaryotes. Three sequence elements required for splicing—5′ and 3′ splice sites and a branchpoint—are especially well-characterized in Saccharomyces cerevisiae, but our understanding of additional intron features that impact splicing in this organism is incomplete, due largely to its small number of introns. To overcome this limitation, we constructed a library in S. cerevisiae of random 50-nt (N50) elements individually inserted into the intron of a reporter gene and quantified canonical splicing and the use of cryptic splice sites by sequencing analysis. More than 70% of approximately 140,000 N50 elements reduced splicing by at least 20%. N50 features, including higher GC content, presence of GU repeats, and stronger predicted secondary structure of its pre-mRNA, correlated with reduced splicing efficiency. A likely basis for the reduced splicing of such a large proportion of variants is the formation of RNA structures that pair N50 bases—such as the GU repeats—with other bases specifically within the reporter pre-mRNA analyzed. However, multiple models were unable to explain more than a small fraction of the variance in splicing efficiency across the library, suggesting that complex nonlinear interactions in RNA structures are not accurately captured by RNA structure prediction methods. Our results imply that the specific context of a pre-mRNA may determine the bases allowable in an intron to prevent secondary structures that reduce splicing. This large data set can serve as a resource for further exploration of splicing mechanisms.
Keywords
INTRODUCTION
Gene expression must be tightly regulated to ensure optimal levels of protein. This regulation includes the control of splicing, whereby introns are removed from pre-mRNA to form functionally mature mRNA (Parenteau et al. 2008; Jacob and Smith 2017; Rose 2019). Splicing of pre-mRNA is carried out by the spliceosome, a large complex of five small nuclear RNAs and over 100 proteins, which is highly conserved in eukaryotes (Plaschka et al. 2019; Wilkinson et al. 2020). A frequently used model to study splicing is the yeast Saccharomyces cerevisiae. In S. cerevisiae, introns are defined by three essential and highly conserved consensus sequences: the 5′ splice site (consensus sequence 5′-GUAUGU-3′), 3′ splice site (5′-[C/U]AG-3′), and the branchpoint (5′-UACUAAC-3′). Whereas the interactions of these sequences with the spliceosome have been extensively studied (Spingola et al. 1999; Qin et al. 2016; Bai et al. 2018), much less is known about the roles that other intron sequences play in the regulation of splicing.
Studies of native yeast introns have identified a few key intron characteristics in addition to the consensus sites that influence the efficient and accurate removal of introns. Generally, a shorter branchpoint to 3′ splice site distance and the presence of uridines in this region positively influence splicing (Cellini et al. 1986; Coolidge et al. 1997; Schirman et al. 2021). Conversely, intron GC content and the probability of RNA secondary structures negatively correlate with splicing, with both features generally exerting the strongest effects around intron–exon junctions (Yofe et al. 2014; Zafrir and Tuller 2015; Schirman et al. 2021). However, in some yeast genes, specific secondary structures are required for efficient splicing (Howe and Ares 1997; Rogic et al. 2008; Gahura et al. 2011; Plass et al. 2012). Additionally, a handful of sequence motifs have been identified that either enhance or silence yeast splicing, and these are enriched near splice sites (Yofe et al. 2014). Studies to date, however, have been limited by the small number of intron-containing genes in yeast (approximately 350), which typically contain only a single intron (Spingola et al. 1999); other eukaryotes such as humans contain more than 200,000 introns and around eight introns per gene (Roy and Gilbert 2006). A study that tested several thousand variants by using and combining intron sequences from eleven yeast species was still limited by the available sequence space from native introns (Schirman et al. 2021). However, this limitation can be circumvented by the generation of large libraries of synthetic sequences, an approach used to identify key regulatory characteristics of other cis-regulatory elements in yeast and mammalian cells (Rosenberg et al. 2015; Cuperus et al. 2017; de Boer et al. 2020; Savinov et al. 2021).
To expand the intron sequence diversity available to analyze, we generated a library in yeast with a reporter gene that contains one of ∼140,000 intron variants. The library was based on a shortened version of the S. cerevisiae ACT1 intron sequence, with a region between the 5′ splice site and branchpoint replaced by a random 50-nt (N50) element. Using targeted RNA sequencing, we found that a large fraction of N50 elements affected splicing efficiency. Several intron characteristics due to the presence of these elements, including GC content, GU-hexamers, and predicted pre-mRNA secondary structure, contribute to the observed variation in splicing. This study points to an important role of intron sequences in addition to the highly conserved consensus elements in maintaining a secondary structure permissive for splicing.
RESULTS
Generation of a library of introns with random 50-nt elements
We sought to analyze splicing in S. cerevisiae by assessing the effect of a large number of random sequence elements inserted into a common intron. We constructed a library of over 750,000 introns, each containing a unique N50 element. The intron background for the library was based on the native S. cerevisiae ACT1 intron sequence of 309 nt. We shortened the ACT1 intron to 115 nt by removing the centermost nucleotides between the 5′ splice site and branchpoint sequence; this shorter ACT1 intron served as a size control (Fig. 1A). For the library, 50 nt in the region between the 5′ splice site and the branchpoint, the majority of the intron sequence in this region, were replaced by synthetic oligos of 50 random bases (Fig. 1A). However, the 5 nt just downstream from the 5′ splice site sequence and the 5 nt just upstream of the branchpoint sequence were maintained to avoid effects on splicing efficiency due to changes that can influence the direct binding of the spliceosome to these consensus sites (McGrail et al. 2006). The N50 oligos had a generally uniform distribution of all 4 nt (Supplemental Fig. S1A).
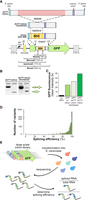
Experimental design and analysis of splicing in controls. (A) Design of constructs. The background for the library was created by removing the centermost nucleotides between the 5′ splice site and branchpoint sequences of the native S. cerevisiae ACT1 intron. A random 50-nt (N50) sequence replaces bases 12 to 61 of the intron between the 5′ splice site and the branchpoint of the shortened ACT1 intron. The intron variants were inserted into the GFP gene 10 nt downstream from the start codon with a unique barcode added 38 nt upstream of the GFP coding sequence, which was under control of the CYC1 promoter and terminator. Numbers indicate the location relative to the GFP open reading frame start site. The different sequence contexts used for analysis are the “nearby” context spanning from 15 bases upstream to 15 bases downstream from the N50 (80 bases total), the “barcode” context spanning from the start of the barcode through 15 bases downstream from the N50 (124 bases total), the “upstream” context spanning from the transcriptional start site (TSS) through 15 bases downstream from the N50 (174 bases total), and a “broad” context spanning from the transcriptional start site through 15 bases downstream from the intron (259 bases total). (B) Analysis of splicing of the full-length and shortened ACT1 introns by semiquantitative RT-PCR using RNA from exponentially growing liquid yeast cultures. PCR using DNA (left) and cDNA (right), unspliced (upper band) and spliced (lower band). (C) Expression analysis determined by GFP intensity measured via flow cytometry using cells containing plasmids with GFP and either no intron, the full-length, or the shortened ACT1 intron and cells without GFP. (D) Splicing of the shortened ACT1 intron paired with 1905 unique barcode variants as assayed by sequencing. (E) Experimental workflow. The N50 intron library was transformed into yeast and RNA was isolated. The splicing efficiency, or the ratio of spliced versus total transcripts, was measured using targeted sequencing of the intron, and variants were identified by their unique barcode.
Each intron was placed in a green fluorescent protein (GFP) reporter gene at a position 10 nt downstream from the start codon, as in the native ACT1 gene (Fig. 1A). Transcription of the reporter gene was under the control of the S. cerevisiae CYC1 promoter and terminator (Fig. 1A). Each intron variant was paired with a unique 15-nt barcode in the 5′ untranslated region (UTR), 38 nt upstream of the start codon, such that the barcode remains in the mRNA after splicing to identify the pre-mRNA N50 variant for each transcript (Fig. 1A). The constructs were sequenced to match barcodes to N50 elements. The barcodes contained an approximately even distribution of the 3 nt other than thymine, which was excluded to avoid the creation of an upstream start site (Supplemental Fig. S1A). Four sequence contexts were used for analysis, including a “nearby” context spanning 15 bases each side of the N50 (80 bases total); a “barcode” context, spanning from the start of the barcode through 15 bases 3′ of the N50 (124 bases); an “upstream” context spanning from the transcriptional start site through 15 bases downstream from the N50 (174 bases); and a “broad” context spanning from the transcriptional start site through 15 bases downstream from the intron (259 bases) (Fig. 1A).
To establish the splicing efficiency—defined as the fraction of reporter gene transcripts that were spliced correctly—initially of control constructs, we transformed yeast with plasmids containing either the full-length or the shortened ACT1 intron within the GFP reporter gene. We analyzed transcript abundance using semiquantitative reverse transcription PCR. For the full-length ACT1 intron construct, only the spliced mature transcript was visible by gel electrophoresis (Fig. 1B), comparable to the complete splicing of this intron in other contexts (Vijayraghavan et al. 1986; Agarwal and Ansari 2016). In the shortened intron construct, ∼82% of the transcripts were visible as the spliced form (Fig. 1B). We also assessed protein expression from the GFP reporters using flow cytometry to measure the fluorescence of exponentially growing yeast. The full-length or shortened intron-containing GFP constructs displayed higher average GFP fluorescence than the “no intron” control (Fig. 1C), in line with yeast studies that show that genes with an intron have higher mRNA stability and transcription (Furger et al. 2002; Parenteau et al. 2008; Moabbi et al. 2012). Yeast with the shortened intron displayed 66% of the fluorescence relative to the full-length intron (Fig. 1C), establishing that GFP protein production and RNA splicing efficiency measured by gel electrophoresis were largely concordant.
To determine whether the upstream barcode affected splicing, we paired the shortened ACT1 control with ∼2000 barcodes and measured splicing efficiency by targeted cDNA synthesis, amplification and sequencing across the 3′ splice junction. The shortened intron variant spliced with 97.0% efficiency in this assessment. The average splicing efficiency of all barcode variants of the shortened intron was 96.2%, with only 0.7% variance between different barcodes (Fig. 1D). Although this efficiency suggests that the barcodes had minimal impact on splicing, 4% of the barcoded controls displayed a splicing efficiency of 80% or less (Fig. 1D). Features of the barcodes may affect splicing, although not their GC content, as splicing was similar among transcripts carrying barcodes of different GC content (Supplemental Fig. S1B). The analyses of RNA and protein expression demonstrate that the reporter construct is a high-splicing background; however, as it is not spliced as efficiently as the full-length ACT1 intron, it can be used to assess insertions that cause either positive or negative effects on splicing (Fig. 1E).
Intron variants with random N50 elements display a wide range of splicing efficiencies
We initially characterized the overall splicing efficiency of the intron library. DNA and RNA were extracted from two independent cultures of yeast cells containing the library. To distinguish each transcript, we added unique molecular identifiers (UMIs) to the gene-specific primer used during reverse transcription. Using massively parallel sequencing, we identified each N50 element by its corresponding barcode and determined the abundance of different splicing isoforms by aligning sequencing reads across the 3′ splice junction to either the intron (i.e., unspliced) or the first exon (i.e., spliced). The UMIs were deduplicated to remove PCR copies, and unique transcripts were counted as the number of UMIs per variant. To obtain higher confidence data, we included in further analyses only variants detected with at least three RNA transcripts and 20 DNA reads (152,514 variants in Rep 1; 193,200 in Rep 2; 141,710 overlap between both replicates; Supplemental Table S1). The splicing efficiency of N50 variants in the two biological replicates was well correlated (Pearson's R = 0.96; Fig. 2A). Using averages of the two replicates in the overlap set, we classified variants into three groups: high (>80%), moderate (20% to 80%), or low (<20%) splicing efficiency (Fig. 2A). The library has a large fraction of variants that showed reduced splicing efficiency compared to the control (Figs. 1D, 2A,B). Variants displayed the full range of splicing efficiencies from 0% to 100% (Fig. 2A,B), with 72% of the variants splicing at lower than 80% (Fig. 2B). This reduced splicing efficiency indicates that features of the N50 elements have a substantial impact on the splicing process.
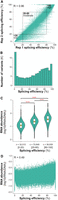
Sequencing analysis of splicing efficiency and transcript abundance in the N50 library. (A) Splicing efficiency of 141,710 intron variants present in two independent biological replicates of the intron library. Variants that displayed low (under 20%), moderate (20% to 80%), or high (above 80%) splicing efficiency in both replicates are boxed. (B–D) Averages of the two replicates are shown without overabundant outliers (>2000 reads/transcript, n = 141,702). (B) Histogram of RNA splicing efficiency displaying the distribution and range of splicing efficiencies of the N50 library. (C,D) RNA abundance was determined by the log10 of the total number of transcripts relative to total DNA for each variant. (C) RNA abundance versus splicing efficiency of each variant averaged across each splicing group (i.e., low, moderate or high). Brackets [ ] indicate inclusive values and parentheses ( ) indicate exclusive values. Horizontal brackets on top indicate significant differences between compared positions using a two-sample t-test, with three asterisks denoting P-values <5−16. The gold diamonds indicate the mean for each group. (D) RNA abundance versus splicing efficiency of each variant individually. Pearson's correlation coefficients are denoted by R.
As splicing efficiency and steady-state RNA levels are correlated (Clancy and Hannah 2002; Ding and Elowitz 2019; Schirman et al. 2021), we examined the abundance of transcripts containing the N50 elements. To account for variation in the frequencies of the N50 elements in the population, we normalized each variant's total RNA to its DNA and termed this value “RNA abundance,” though overall, RNA and DNA levels moderately correlated (R = 0.57, Supplemental Fig. S1C). Intron variants that displayed moderate splicing efficiency had on average 33% lower RNA abundance, and those with low splicing efficiency a striking 65% lower, than those with high efficiency (Fig. 2C). Furthermore, unspliced transcripts were 50% less abundant than spliced transcripts (UMIs per variant, Supplemental Table S1). Transcripts with incorrect splicing can be degraded by nonsense-mediated decay (for review, see He and Jacobson 2015), thereby reducing the accumulation of unspliced transcripts and protecting cells against potentially deleterious proteins produced from these transcripts. Overall, the intron library displayed a positive correlation between splicing efficiency and RNA abundance (R = 0.38, Fig. 2D), supporting the idea that unspliced transcript isoforms have reduced accumulation.
Hexamers enriched in GU reduce splicing efficiency
To identify short sequences in the N50 elements that may contribute to the broad range of splicing efficiencies observed in the intron library, we calculated the average splicing efficiency of library members containing every possible 6-nt-long sequence. We ranked each hexamer from highest (rank 1) to lowest (rank 4096) splicing efficiency, based on the average splicing of introns containing them, and inspected hexamers more than 2.5 standard deviations away from the mean (Fig. 3A; Supplemental Table S2). The hexamers with the highest associated splicing efficiency were AU-rich (Supplemental Table S2). Similarly, hexamers associated with introns with the lowest splicing efficiency rank were generally GC-rich. However, 20 of the 25 hexamers with the lowest associated average splicing efficiency contained at least one GU or UG dinucleotide, and 11 contained multiple repeats, with GUGUGU ranked lowest of all hexamers (Fig. 3A; Supplemental Table S2). The effect of this GU-rich element on splicing efficiency was not dependent on its specific location within the N50 (Fig. 3B).
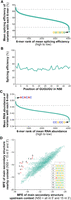
Analysis of all possible hexamers within the N50 library variants. (A–D) Values averaged between two biological replicates, n = 141,710. (A) Average splicing efficiencies of N50s containing each hexamer ranked highest (#1) to lowest (#4096). (B) Average splicing efficiencies of N50s containing GUGUGU and starting at each possible position within the N50. (C) Average RNA abundance of N50s containing each hexamer ranked highest (#1) to lowest (#4096). (D) Average minimum free energy (MFE) of the main predicted structure for the library variants using the N50 sequence and its “upstream” context (entire upstream RNA sequence and 15 bases downstream, 174 bases total) versus the “nearby” context (15 bases each side of N50, 80 bases total). The red numbered dots indicate the specific hexamers listed.
In total, the 25 hexamers with the largest reductions on splicing efficiency were found in ∼26% of the N50s, due in part to a slight bias for both guanine and thymine in library synthesis (Supplemental Fig. S1A). We compared the average splicing efficiencies of N50 elements that contain either contiguous GU or UG repeats (e.g., GUGU) to those with noncontiguous repeats (e.g., GUAAGU). In all cases, N50s with contiguous dinucleotide repeats had on average lower splicing efficiency than those with noncontiguous dinucleotide repeats (Supplemental Table S2). Although GUGUGU has not been reported to have a drastic effect on splicing when present in native yeast introns, we analyzed the abundance of short sequences in native introns, which might reflect evolutionary selection on sequence content (due to the limited number of native introns, we analyzed all 1024 possible pentamers rather than hexamers). GUGUG is enriched over 896 other pentamers and UGUGU over 919 other pentamers, indicating that GU repeats are not preferentially excluded from S. cerevisiae introns (Supplemental Table S3). Conversely, CG-rich pentamers tend to have lower enrichment over a shuffled pentamer (Supplemental Table S3). Taken altogether, these results suggest that GC content has a general negative effect on splicing, whereas the effect of the GU repeats is likely due to the specific context of the reporter gene.
We also determined average RNA abundances across N50 elements containing each hexamer and again ranked each hexamer from highest to lowest. N50s containing hexamers with GU repeats were not among those ranked lowest in average RNA abundance, with 29 and 84 sequences ranked lower than GUGUGU and UGUGUG, respectively (Supplemental Table S2). Rather, the lowest-ranked hexamers for RNA abundance were GC-rich, with CCGCCG corresponding to the least abundant RNA on average (Fig. 3C; Supplemental Table S2).
Secondary structure and intron GC content affect splicing efficiency
We considered whether the GU-rich N50 elements might be forming some secondary structure within the reporter gene pre-mRNA that inhibits splicing. Because of wobble-pairing of guanine, GU-rich sequences could potentially hybridize to a large range of complementary sequences within the pre-mRNA. However, a single AC-rich sequence, ACACACAC, is present in the 5′ UTR of the reporter gene, beginning 11 bases upstream of the barcode. To determine if this sequence may be related to the reduced splicing efficiency of introns with GU-rich N50 elements, we calculated the lowest MFE structure of regions containing the N50 element and variable additional sequence (Supplemental Fig. S2; Supplemental Table S4). The correlation of MFE to splicing efficiency was greatest (R = 0.23) using an “upstream” context (Fig. 1A) that contains the AC repeat region (Supplemental Fig. S2; Supplemental Table S4). Exclusion of the full 5′ UTR sequence using “nearby” or “barcode” contexts (Fig. 1A) resulted in much lower correlations between MFE and splicing efficiency (Supplemental Fig. S2; Supplemental Table S4). Additionally, some hexamers had a much stronger effect on predicted secondary structure when 5′ UTR sequences were included than when they were not (Fig. 3D; Supplemental Table S2). These outliers included GUGUGU and similar GU-rich sequences, as observed in the lowest-ranked hexamers for associated splicing efficiency (Fig. 3D; Supplemental Table S2). These results support the idea that the GU-rich sequences in the N50 elements form a secondary structure with the 5′ UTR that reduces splicing, suggesting that context is an important consideration in splicing.
We also examined energy of the MFE structure and its frequency in the ensemble of all structures, the free energy and the diversity of the thermodynamic ensemble of structures and the base-pairing probability between each pair of nucleotides, across the N50. The MFE of the main structure (R = 0.21) and of the ensemble of structures (R = 0.22) were most strongly correlated with splicing efficiency among the predicted secondary structure features using the full N50 sequences (P-value < 2.2 × 10⁻¹⁶, Supplemental Table S4). The lower the MFE of the ensemble, the lower the splicing efficiency, suggesting that formation of strong RNA structures reduces splicing efficiency. This relationship is congruent with results that show that specific secondary structures of the pre-mRNA near or involving the three consensus intron sequences can reduce splicing efficiency and alter splice site selection by hindering spliceosome access to these sites (Eperon et al. 1988; Halfter and Gallwitz 1988; Goguel and Rosbash 1993; Mougin et al. 1996; Singh et al. 2007; Barrass et al. 2015; Zafrir and Tuller 2015). Across the N50, the base-pair probability increased in variants with moderate versus high splicing efficiency and was greatest in the low splicing group (Supplemental Fig. S3A). The base-pair probability was also consistently higher across the AC-repeat region of the 5′ UTR for variants with low splicing relative to the other groups (Supplemental Fig. S3B). Congruently, variants that contain the GUGUGU hexamer displayed a much higher base-pair probability in this region than any of the other splicing groups (Supplemental Fig. S3B) as well as the other transcript regions (Supplemental Fig. S3A–C). This correlation further supports the idea that secondary structure between the intron and 5′ UTR can strongly impact splicing. For the 5′ splice sequence, there was no consistent trend for base-pair probability for the three splicing groups, and the site-specific differences across the 5′ splice site were greater than between any of the splicing groups, indicating minimal interaction of the 5′ splice site with the N50 for splicing (Supplemental Fig. S3C). The other features of the predicted secondary structures (the frequency of the main structure in the ensemble of all predicted structures and the ensemble diversity) had little to no correlation with the splicing efficiency of the variants (R < |0.02|, Supplemental Table S4).
We also analyzed GC content across the entire N50 as well as smaller windows of 10 nt, and the predicted RNA secondary structure across a “broad” context (259 bases) of the transcript spanning from the transcriptional start site through 15 bases downstream from the intron (Fig. 1A). Generally, introns with higher GC content displayed lower splicing efficiency, with a correlation of R = −0.07 averaged across all 10-nt windows and R = −0.14 for GC across N50s (Supplemental Fig. S3D,E), similar to prior studies (Galante et al. 2004; Wong et al. 2013; Schirman et al. 2021; Gnan et al. 2022). These correlations are in line with the low splicing efficiency rank of hexamers with high GC content (Supplemental Table S2). The differences in both measures of GC content among the low, moderate and high splicing efficiency groups were greatest for regions at the edges of the N50 elements relative to the middle (Supplemental Fig. S3D).
Motifs associated with reduced splicing efficiency
We analyzed the N50 elements of RNAs that displayed high, moderate, or low splicing efficiency in both biological replicates (Fig. 2A) for sequence motifs that were significantly enriched. We identified three motifs enriched in the low splicing group, five in the moderate splicing group and one in the high splicing group, when variants were grouped by unique barcodes (Fig. 4A). One of the motifs from the low splicing group and four from the moderate splicing group were similarly found when variants were grouped by unique barcode and N50 (Supplemental Fig. S4A). To validate these results, we chose representative motifs from each group: (i) UUAGUG, (ii) AGGCUUCGGG and (iii) GAUGUUUGAAUA from the low-splicing group; (iv) UUUGAAUAAUGAC, (v) AAAUGUUCGA, (vi) UUUAGAUAUAUGUC, (vii) GACUUUAGAU and (viii) ACUUAUUU from the moderate-splicing group; and (ix) CCGUGUAG from the high-splicing group (Supplemental Fig. S4A). Validation controls of a silencer motif (UUUGUGUA, designated Y1) identified from native yeast introns and a mutated motif that acts as a silencer (UUUAUGCU, designated Y2) as well as a splicing enhancer (GUACAUGU, designated Y3) were chosen from Yofe et al. (2014) (Fig. 4A).
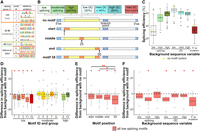
Overview and sequencing analysis of motifs enriched from splicing efficiency status in different intron backgrounds. (A–F) Results for the average of the two replicates. (A) Motifs that were enriched among the variants with unique barcodes that displayed low (under 20%), moderate (20% to 80%), or high (above 80%) splicing efficiency in both replicates relative to a randomization of those sequences with P-values <0.05. Also listed are motifs previously reported to reduce (Y1 and Y2) or enhance (Y3) splicing in Yofe et al. (2014). (B) Overview of the different sequence backgrounds and positions of motifs tested. Numbers indicate the position in the different 50-nt test regions, and regions of the introns are denoted (ss) splice site, (bp) branchpoint. (C) Average splicing efficiency for all motif variants and positions as well as the no motif controls, denoted by a gold rectangle, for each background sequence condition, n = 336. (D) The difference in splicing efficiency for each motif variant from the no motif control with the corresponding background sequence, averaged across all positions and backgrounds, n = 28. (E) The difference in splicing efficiency for each motif position from no motif control with the corresponding background sequence, averaged across the five low splicing motifs and all backgrounds, n = 35. Brackets indicate significant differences between compared positions using a two-sample t-test, with one asterisk denoting P-values <0.05 and three asterisks denoting a P-value <0.0005. (F) The difference in splicing efficiency for motifs in each background from no motif control with the corresponding background sequence, averaged across the five low splicing motifs and all positions, n = 20. Single asterisks on the top of the graphs indicate significant differences from the no motif control within each group when using a one-sample t-test with P-values <0.05.
The enriched motifs were introduced into seven backgrounds and at three locations within the N50 to test their efficacy in a broad range of settings (Fig. 4B). The seven backgrounds were: one N50 from each of the three splicing efficiency groups that did not contain any of the motifs; the shortened ACT1 intron sequence with a medium GC content (40%), as well as low (20%) and high (60%) GC content versions constructed by replacing bases as needed; and the shortened ACT1 intron paired with a mutation of the 5′ splice site that substantially reduces splicing (Fig. 4B; Vijayraghavan et al. 1986). To assess positional dependency, we placed the motifs at the start of the N50 (the initial nucleotide of the motif placed at position 1 of the N50), the middle (the central nucleotide of the motif placed at position 25) and the end (the last nucleotide of the motif placed at position 50) (Fig. 4B). We also assessed constructs that had the same motif at all three positions as well as each background containing no motif (Fig. 4B). In all, we tested 12 motifs in four positional configurations and seven backgrounds, as well as seven no motif control backgrounds, for a total of 343 unique introns.
To test whether the enriched motifs influenced splicing efficiency independent of context, we first compared the splicing efficiency of the seven control backgrounds (no motif). The backgrounds chosen from the low, moderate and high splicing groups displayed the same overall trends in the validation experiment as in the library experiment (Fig. 4C). For backgrounds with higher GC content, there was a corresponding decrease in splicing efficiency (Fig. 4C), again as in the library experiment (Supplemental Fig. S3D,E). The control background with the 5′ splice site mutation had a splicing efficiency of 52% (Fig. 4C). To compare the effect of the motifs in these different backgrounds, we calculated the difference in splicing efficiency of each intron compared to the no motif control for each background. A significant decrease in splicing was observed for the three motifs (1, 2, and 3) from the low splicing group, as well as for the two previously reported splicing-reducing motifs Y1 and Y2 (Fig. 4D). No differences in splicing efficiency were detected for motifs 4, 6, 7, or 8 from the moderate splicing group or from the previously reported splicing-enhancing motif Y3 (Fig. 4D). Motif 5, from the moderate splicing group, and motif 9, from the high-splicing group, were highly variable, but showed a significant reduction in splicing across backgrounds (Fig. 4D). These data suggest that only motifs that strongly reduce splicing maintain their effect independent of the background.
We assessed the position and background specific effects for all low splicing motifs. The average splicing for all low splicing motifs, including the three from the low splicing group and the two from Yofe et al. (2014), were observed in all positions and were stronger when the motifs were present in triplicate (Fig. 4E). In analyzing background-specific effects, we found that these five low splicing motifs displayed lower average splicing efficiency in all backgrounds except the low and high splicing backgrounds (Fig. 4F). These results indicate that the motifs were not as effective when present in a background that had a strong enhancing or reducing impact on splicing. In contrast, the motifs further reduced splicing efficiency in the poor splicing background created by the 5′ splice site mutation (Fig. 4F), suggesting that the 5′ splice site and more 3′ regions of the intron impact splicing in different ways. Overall, the results demonstrate that multiple motifs can affect splicing efficiency in context-dependent and context-independent manner.
N50 variants and cryptic splicing
Cryptic splice sites are noncanonical transcript locations that undergo splicing aberrantly, thereby competing with and reducing the amount of splicing at the canonical site (Nelson and Green 1990; Cunningham et al. 1991; Lesser and Guthrie 1993; Rosenberg et al. 2015). To examine 5′ and 3′ cryptic splice sites in the variants, we reexamined sequences that did not match the expected junction sequences of canonically spliced or unspliced variants. We identified 5′ cryptically spliced variants if their junction sequence exactly matched a sequence anywhere downstream from the barcode, upstream of the branchpoint, and not at the canonical site (Fig. 5A). Cryptic 3′ splice sites were identified by junction sequences that contained combinations of the last six bases of exon 1, assuming these transcripts are spliced at the canonical 5′ splice site, and at least three bases of 3′ unspliced sequence (Fig. 5A). Since we sequenced the intron–exon junction using a reverse primer that anneals to the start of exon 2, no downstream 3′ cryptic splice sites could be identified (Fig. 5A). Approximately 1% of the N50 variants (1017 variants) had at least one transcript that was cryptically spliced. Most of the 5′ cryptic splices fall within the first 25 nt of the N50 elements (Fig. 5B), likely because there is a minimum length required upstream of the branchpoint to form a lariat (Wieringa et al. 1984; Smith and Nadal-Ginard 1989) and 5′ cryptic splices in the last 25 nt of the N50 would not meet this minimum.
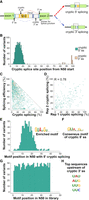
Overview and sequencing analysis of cryptically spliced N50 variants. (A) Diagram of the different types of splicing in library variants. Cryptic 5′ and 3′ splicing are depicted by a red dashed line and a blue dash-dot line, respectively. Splicing at a cryptic 5′ or 3′ splice site (ss) results in the inclusion of the 5′ or 3′ end of the intron, correspondingly. The sequencing primer to identify the differentially spliced variants anneals to the junction between the intron and the second exon. (B,C) Results for the average of both replicates. (B) The number of 5′ and 3′ cryptically spliced variants at each position of the N50. (C) The splicing efficiency versus the portion of cryptically spliced transcripts in 5′ and 3′ cryptically spliced variants. (D) Portion of cryptic splicing per variant found in both independent biological replicates of the intron library (n = 237). Pearson's correlation coefficient is denoted by R. (E) The significantly enriched sequence motif among the 5′ cryptically spliced variants is listed, P-value <0.05. (F) The consensus motif of the actual cryptic 5′ splice sites identified in the library. (E,G) The number of variants containing the enriched motif at each starting position found in 5′ cryptically spliced variants with (E) only 5′ cryptically spliced variants or (G) the entire library. (H) The four most common sites used for 3′ cryptic splicing among the intron variants.
Cryptic 3′ splice sites were similarly constrained, found only within 30 nt of the canonical 3′ splice site and only at specific locations (Fig. 5B). In the control shortened ACT1 intron sequence, no 5′ cryptic splicing was observed (Supplemental Fig. S4B). However, six of the barcode variants displayed 3′ cryptic splicing at the same top two locations as the 3′ cryptically spliced library variants, indicating that only a few positions present a viable splice sequence (Fig. 5B; Supplemental Fig. S4B). No relationship was found between canonical splicing efficiency and the proportion of transcripts cryptically spliced (Fig. 5C). For 25% of the N50 elements associated with cryptic splicing, the cryptically spliced transcripts accounted for the majority of transcripts (Fig. 5C). Only 23% of the 5′ and none of the 3′ cryptically spliced variants were found in both biological replicates. However, the proportion of cryptic splicing for these 23% (237 variants) was well correlated (R = 0.78; Fig. 5D). The low abundance and lack of replicable 3′ cryptic splicing compared to 5′ cryptic splicing may indicate that the N50 region had comparatively little impact on 3′ splice site selection and is likely not a general feature of cryptic splicing. For N50 elements in which 5′ cryptic splice sites were identified, we searched for enriched sequence motifs. The only motif identified contains the canonical 5′ splice site, GUAUGU, found in 73% of the 5′ cryptically spliced variants (Fig. 5E); this site provided the primary 5′ splice site used in the variants with 5′ cryptic splicing (Fig. 5F). The enriched motif is primarily located in the first half of the 5′ cryptically spliced variants (Fig. 5E), but evenly distributed in the canonically spliced library variants (Fig. 5G). For the 3′ cryptic splice sites, we found that the three bases most commonly used as the cryptic splice site did not match the canonical 3′ splice sequence (5′-[C/U]AG-3′, Fig. 5H). It is possible that cryptic splicing occurs when another site is present that can be bound and cleaved by the spliceosome, even if it is weaker than the canonical splice site.
Predicting splicing efficiency from intron sequence using multiple models
To determine sequence patterns in the N50 element that influence splicing efficiency, we trained five convolutional neural network (CNN) models with different architectures. For 140,017 sequence variants (the set of overlapped variants with unique barcodes), we trained on 80% of the data, validated on another 10% and tested performance on the remaining 10%. While these models made predictions that are significantly different from random, none were able to explain the majority of the variance in splicing efficiency (max Pearson's R = 0.26, Supplemental Table S5). Down-sampling of the number of sequences in the training set suggested that the CNN models require many more training sequences to learn the patterns that are controlling splicing efficiency.
We also applied linear regression, random forest regression and elastic-net models to relate splicing efficiency to 14 known features of each N50 alone or to these features along with k-mers in the N50 (see Materials and Methods for feature details; Table 1; Supplemental Table S6). The simple linear regression outperformed the random forest and elastic-net models. The best linear regression model, which included the 14 features as well as the presence of trimers in the N50, performed almost on par with the more complex CNN models, R = 0.24 versus R = 0.26, respectively (Table 1; Supplemental Table S5). The most important feature in determining splicing efficiency in this linear model was the predicted MFE of the structural ensemble, followed by the GC-content of the N50, the presence of an additional 5′ splice site, the presence of hexamers ranked highest in splicing efficiency, and the presence of hexamers ranked lowest in splicing efficiency (Table 1). Due to its inherent sparsity, the elastic-net model trained on sequence k-mers within the N50 was also used to determine which sequence patterns have the strongest influence on splicing efficiency. The two most predictive features were the occurrence of GUG and GCG elements, predicted to negatively affect splicing efficiency (Table 1). However, structure predictions did not indicate the formation of specific base-pairing between the N50 and other regions of the pre-mRNA, suggesting either that the predictions lack accuracy or that the formation of secondary structure is insufficient to explain the splicing efficiency.
Feature importance and performance of linear models with rank 1 being most important
DISCUSSION
This work examined the effect on splicing efficiency in S. cerevisiae of approximately 140,000 50-nt-long elements in a shortened ACT1 intron, with the consensus splice sites and branchpoint kept intact. The shortened intron control spliced at an efficiency of 80% to 97% of the wild-type ACT1 intron from which it was derived. The N50 intron variants displayed the full range of splicing efficiencies, with the majority splicing less efficiently than the control intron. Decreasing splicing efficiency tended to correlate with increasing GC content and stronger predicted secondary structure. These predicted structures correlated much more with splicing efficiency when the 5′ UTR was included in the predictions; in particular, introns whose N50 elements contain hexamers with multiple GU dinucleotides had a dramatic increase in predicted secondary structure when the entire upstream sequence was analyzed in structure calculations, compared to when only 15 nt upstream of the N50 were used. For example, GUGUGU elements went from hexamer rank 2167 to rank 2 (the second strongest predicted MFE) when the 5′ UTR was included. This change in MFE suggests that the N50 element interacts strongly within the specific sequence environment of its pre-mRNA. The importance of RNA secondary structure for proper mRNA maturation and regulation has been suggested previously. For example, mutation of pre-mRNA to alter or add structural elements can mask splice sites; alternatively, it can promote splicing by organizing splice sites (Eperon et al. 1988; Halfter and Gallwitz 1988; Goguel et al. 1993; Charpentier and Rosbash 1996; Preker and Guthrie 2006; Raker et al. 2009). Furthermore, splicing at specific splice sites can increase when heat shock or mutations disrupt secondary structures around these sites (Meyer et al. 2011).
Genetic, biochemical and structural studies of the yeast spliceosome have revealed a complex series of remodeling steps involved in splicing (for reviews, see Plaschka et al. 2019; Wilkinson et al. 2020; Tholen and Galej 2022). Formation of at least ten conformational steps during splicing requires the coordinated displacement and recruitment of dozens of components. That all these steps can occur on the reporter pre-mRNA used here is indicated by the high splicing efficiency of the control shortened intron, as well as by the highly efficient splicing group of variants totaling 28% of the N50 inserts (>80% spliced, ∼40,000 variants). This high efficiency indicates that the five additional intervening bases between the N50 and the 5′ splice site, and between the N50 and the branchpoint (Fig. 1A), may be sufficient to allow binding of the U1 snRNP to the 5′ splice site and U2 snRNP to the branchpoint. However, the large number of splicing-defective variants in the library demonstrates that many N50 elements may adversely influence splicing through interactions with the spliceosome. For example, strong secondary structure involving base-pairing of a sequence within the N50 to an invariant sequence within the reporter pre-mRNA has the potential to at least partially inhibit interactions with the spliceosome. Structures could sterically restrict the binding of the U1 snRNP or U2 snRNP, or inhibit the association of these two snRNPs to bring the 5′ splice site and branchpoint together to form the spliceosome B* and C complexes (Halfter and Gallwitz 1988; Goguel et al. 1993). Similarly, subsequent steps in the assembly and activation of the spliceosome might be negatively impacted by secondary structures that include N50 sequences. However, direct evidence to establish the precise spliceosome assembly steps that are negatively or positively affected by the N50 sequences is needed.
Our efforts using a variety of models to determine the sequence patterns that cause the N50 effects on splicing were able to explain only a small fraction of the variance. A likely reason is that structure plays a large role in the observed splicing efficiency, but RNA structure prediction methods have limited accuracy, with maximum expected accuracy at 88% or lower (Mathews et al. 2004). While CNN models successfully learn the importance of specific sequence motifs, for example for RNA-binding proteins, they require many more examples to learn complex nonlinear interactions or combinations of features that are represented in RNA structure, where a multitude of sequences in different arrangements can form the same secondary or tertiary structures. It is also unclear whether the structural features that we extracted from RNA structure prediction software fully capture the essential properties that influence splicing. Determining the precise mechanisms involved in these effects will require improvements in the ability to accurately predict secondary structure.
Overall, this study supports the idea that the secondary structures of pre-mRNAs have evolved to regulate the splicing efficiency of their introns. By beginning with a slightly enfeebled intron, we found that a large majority of random 50-nt insertions further decreased splicing efficiency, often by a substantial amount. This study thus suggests that sequences outside of the canonical splice sites and branchpoint can have large effects on splicing efficiency and provides a large intron data set that can serve as a resource to analyze splicing mechanisms.
MATERIALS AND METHODS
Construction of N50-containing intron library and intron controls
For the assembly of constructs, plasmids were linearized using a restriction enzyme digest and then amplified using inverse PCR with KAPA HiFi DNA polymerase HotStart ReadyMix (KAPA Biosystems). The inverse PCR product was treated with DpnI to digest the template DNA. Oligo fragments were amplified with fewer than 10 cycles of PCR using Phusion High-Fidelity DNA Polymerase to minimize PCR error. The DpnI-treated inverse PCR vector and PCR product inserts were column purified using a DNA Clean & Concentrator kit (Zymo Research). Inserts were added with twofold molar excess to 75 ng of the vector, and the two were combined by Gibson assembly (Gibson et al. 2009) using NEBuilder HiFi DNA Assembly Master Mix (New England Biolabs) in 20 µL reactions. Following incubation at 50°C for 30 min, 2 µL of the chilled assembly product was used to transform 50 µL of DH10β E. coli cells (Invitrogen) by electroporation. Cells were plated in 1:100, 1:1000, and 1:10,000 dilutions on LB agar plates containing 100 µg/mL ampicillin to estimate the number of transformants. The remaining cells were grown overnight in LB media containing 100 µg/mL ampicillin at 37°C with shaking at 225 rpm, and plasmids were isolated using a PureYield Plasmid Midiprep kit (Promega).
A GFP reporter gene containing a frameshift (fs) mutation amplified with primers MP1-F and MP2-R (for primer sequences, see Supplemental Table S7) was inserted into a p415-CYC1 plasmid (which contains AmpR and LEU2 genes for selection, Mumberg et al. 1995) linearized by digestion with BamHI and SalI. For the construction of the wild-type and shortened ACT1 intron control plasmids, the p415-CYC1-GFPfs plasmid was linearized by digestion with XbaI and amplified with primers MP3-F and MP4-R (Supplemental Table S7), which removed the GFP frameshift mutation and thereby ensured that only correctly cloned plasmids would produce functional GFP. Oligo fragments were obtained from Integrated DNA Technologies that included a section of 5′ UTR containing a unique 15-nt barcode (without thymine so that additional start sites were not generated) and an intron located 10 bp downstream from the GFP start site. The oligo fragments containing either the ACT1 intron or a shortened ACT1 intron with the centermost 194 bases removed between the 5′ splice site and the branchpoint were amplified with primers MP8-F and MP9-R (Supplemental Table S7) and inserted into the amplified vector. We added an IDT oligo fragment containing many random 15-nt barcodes amplified with primers MP11-F and MP12-R to the p415-CYC1-GFP plasmid containing the shortened ACT1 intron that had been linearized by digestion with SpeI and amplified with MP13-F and MP4-R to assess the effect of the barcodes on splicing efficiency of the control (Supplemental Table S7).
For the construction of the intron library and the validation set, oligos were inserted into a vector amplified using primers F-MP38 and MP4-R from the plasmid containing the shortened ACT1 intron that was linearized by digestion with XbaI and BamHI-HF (Supplemental Table S7). The inserts contained the same sequence as the shortened ACT1 intron, except 50 bases between the 5′ splice site and the branchpoint were replaced with random nucleotides (N50) for the intron library or with specific 50-bp sequences for validation, and were amplified with primers F-MP47 and R-MP48 (Supplemental Table S7). The library oligos were obtained as an Ultramer DNA Oligo Pool from Integrated DNA Technologies, whereas the validation sequences were obtained from Twist Biosciences.
Yeast transformation
The BY4741 yeast strain, which is unable to produce leucine, was struck out from a frozen glycerol stock and grown on YPAD plates at 30°C. Single colonies were used to inoculate liquid YPAD media and grown overnight at 30°C with shaking at 225 rpm. The cell density of the overnight culture was determined by measuring the absorbance at 600 nm using a spectrophotometer and was diluted to an OD600 of 0.1 in YPAD and grown around 4 to 5 h. Next, the yeast were transformed with plasmid constructs using the high-efficiency yeast transformation protocol of Gietz and Schiestl (2007). Replicate transformations were pooled, and cells were plated at 1, 1:10, and 1:100 dilutions on C-Leu plates to estimate the number of transformants. The remaining cells were grown overnight in liquid C-Leu media at 30°C overnight. Aliquots of the overnight culture were pelleted and resuspended in C-Leu and 25% glycerol and stored at −80°C. Two biological replicates were grown independently for each yeast strain.
DNA and RNA extraction, cDNA synthesis, and expression analyses
Yeast glycerol stocks were used to inoculate liquid C-Leu media, and the culture was then grown overnight at 30°C with shaking at 225 rpm. The OD600 of the overnight culture was measured using a spectrophotometer and the culture was diluted to an OD600 of 0.1 in YPAD. The yeast was grown at 30°C and shaken at 225 rpm until the OD600 of the culture measured between 0.5 and 0.7, which was around 5 h. Aliquots of the culture were spun down for 5 min at 3220 g and room temperature, and RNA and DNA were extracted using 0.75 mL TRIzol Reagent (Invitrogen) for each 0.25 mL of pelleted yeast cells. The construct has a stop codon in the intron directly upstream of the N50, minimizing any difference in nonsense-mediated degradation of unspliced transcripts across the library. However, since nonsense-mediated degradation can occur for some transcripts in only a few minutes, the number of unspliced transcripts may be underestimated. The mRNA was purified from total RNA extracts using Dynabeads Oligo (dT)25 (Invitrogen) and eluted from the beads. First-strand cDNA synthesis was performed with a gene-specific primer that contained a UMI (primer MP56-2, Supplemental Table S7) and SuperScript IV Reverse Transcriptase (Invitrogen). qPCR was performed on mRNA samples before and after reverse transcription to verify that samples were free from any plasmid DNA. Gel images of qPCR using DNA and cDNA using the wild-type and shortened ACT1 intron construct amplified with primers F-MP5 and R-MP6 or F-MP10 and R-MP8, respectively (Supplemental Table S7), were quantitatively analyzed to determine the proportion of spliced and unspliced isoforms of the cDNA by measuring band intensity using ImageJ version 1.53e.
Preparation of samples for RNA and DNA sequencing
Sequencing samples were amplified by qPCR for 20 cycles or less and between 600 and 800 relative fluorescence units using Q5 High-Fidelity DNA Polymerase 2× Master Mix (New England Biolabs) to minimize replication errors. Each sample set was amplified with primer combinations that added a unique sample index and Illumina's P5 and P7 adapter sequences to the PCR product (Supplemental Table S7). PCR products were pooled and column purified using a DNA Clean & Concentrator kit (Zymo Research) and quantified using a Qubit 3.0 fluorometer. Sequencing samples were denatured and diluted for sequencing following the standard Illumina protocol and loaded into a high output v2 NextSeq 500/550 reagent cartridge (Illumina). Paired-end sequencing was performed on an Illumina Nextseq 550 sequencer. We first sequenced the intron library DNA to identify the barcode and N50 pairs using custom primers: read1-MP23, read2-MP24, index1-MP22, index2-MP25 (Supplemental Table S7). Then we sequenced the DNA and cDNA samples using custom primers that read the barcode read1-MP22, the sequence upstream of the canonical 3′ splice site to identify the splice isoform read2-MP32, the UMI index1-MP33 and the unique sample index index2-MP34 (Supplemental Table S7).
Sequencing analyses and data filtering
For the barcode-N50 sequence assembly, paired-end barcode and N50 reads were assembled using PANDAseq v2.11 and joined using R v4.0.0. Each DNA and cDNA sequencing sample was sorted by their unique sample index using Bcl2Fastq v2.20 allowing no mismatches per index. Barcodes were aligned to the barcodes identified in the sequence assembly, and junction reads were aligned to 33 bases of the accurately spliced or unspliced reference sequences using Bowtie 2 v2.4.4. If a junction read did not align, we aligned the sequence to the region starting in the 5′ UTR immediately downstream from the barcode and ending after the branchpoint to identify any 5′ cryptic splice sites. To examine 3′ cryptic splice sites, we aligned junction sequences to all possible combinations of at least six bases of a 5′ spliced sequence, or at least three bases of a 3′ unspliced sequence, to filter out any splice site that was part of the canonical splice site. Each barcode-junction-UMI read was connected and UMIs were deduplicated using custom AWK scripts. Data were filtered so that only variants with at least three UMIs and 20 DNA reads were used for analyses to ensure adequate sequencing coverage. Splicing efficiencies were calculated as the percentage of correctly spliced cDNA sequences relative to the total for each variant. RNA abundance was calculated as the total cDNA sequences relative to the total DNA reads per variant. Identification of motif enrichment was determined among variants that displayed low (under 20%), moderate (20 to 80%), or high (above 80%) splicing efficiency in both biological replicates. These sequences were analyzed using STREME relative to the input sequences shuffled for enriched motifs with a size limit of 4–15 nt and a P-value threshold of 0.05 (Bailey 2021). Hexamer ranks were determined by identifying and averaging the values of interest for all N50 sequences containing each hexamer. Correlation statistics and t-tests were used to determine significance using RStudio v2022.07.2 with R v4.2.2 and the rstatix package. Secondary structure estimates were determined using ViennaRNA v2.5.0 (Gruber et al. 2008; Lorenz et al. 2011), which is based on RNA structure parameters described in Mathews et al. (2004).
Pentamer analysis
The occurrences of all 1024 possible pentamers of the native S. cerevisiae introns, coding sequences and noncoding sequences were counted after extraction from the S288C genome annotation using BEDOPS (Neph et al. 2012). Five million randomly shuffled pentamers were created that had the same nucleotide composition as the native introns, coding sequences and noncoding sequences. Enrichment scores were derived by dividing true pentamer frequency to randomly generated pentamer frequency, presented as log2 enrichment.
Convolutional neural network training and linear modeling
A linear regression using 14 preselected features and an elastic-net regression using sequence k-mers (i.e., 3-, 4-, 5-, 6-, and 7-mers) within the N50 element were implemented with the Python package scikit-learn v1.2.2 (Fabian 2011). Five different CNN architectures with sequence-structure inputs of various lengths were implemented using PyTorch v2.0 (Paszke et al. 2019). The models were trained and evaluated using the unique variants that displayed low, moderate, or high splicing efficiency in both biological replicates (n = 140,017 variants). All models were trained on 80% of the data using the average splicing efficiency between the two replicates. We tested performance on a held-out 10%, and for elastic-net and CNN models, we optimized hyperparameters on a validation set consisting of the remaining 10% of the data. The sequences in the test and validation set were selected randomly in a way that every efficiency was represented with equal frequency in the training set.
The linear regression model used the following features for each variant: (i) the N50 GC content; if the N50 contains any
of the (ii) bottom or (iii) top 10 hexamers ranked by splicing efficiency; the motifs that were enriched in variants with
(iv) low, (v) moderate, or (vi) high splicing efficiency; the motifs that were previously reported from native yeast sequences
to (vii) reduce or (viii) enhance splicing efficiency; a canonical (ix) 5′ splice site sequence or (x) branchpoint sequence,
as well as (xi) the lowest free energy predicted secondary structure; (xii) the MFE for the ensemble of predicted secondary
structures; (xiii) the frequency of the main structure in the ensemble; and (xiv) the diversity of the ensemble using the
N50 and its “upstream” context (Fig. 1). After training, we used t-test statistics to rank the regression coefficients by their statistical difference from zero. The linear regression coefficients,
 , of the linear regression model follow a normal distribution with a variance of σ2(XTX)−1 (Hastie et al. 2009):
 The t-statistic for the coefficients to be nonzero is therefore:
  with
with  and
and  X represents the feature matrix of size (n, f), where n is the number of data points, f is the number of features, β is the true effect, y is the measured splicing efficiency, and
  is the predicted splicing efficiency. We performed this ranking for each of the 10 cross-validation folds and determined
the order of importance for the features ranking from their average rank across all 10 sets. We also tested a random forest
regression model with the same features.
is the predicted splicing efficiency. We performed this ranking for each of the 10 cross-validation folds and determined
the order of importance for the features ranking from their average rank across all 10 sets. We also tested a random forest
regression model with the same features.
The k-mer elastic-net models used separate sets of k-mers of length 3, 4, 5, 6, and 7 bases. We performed several restarts to determine the optimal regularization parameter α (using the validation fold, 10% of the data) for each feature set and reported only the result with the optimal regularization parameter. We also used the t-test statistic to rank the k-mers based on their importance for the predictor.
The CNNs were trained on the one-hot encoding of sequences of different lengths: (i) the 50-base-long random element; (ii) 174 bases total, spanning from the start of the 5′ UTR to 15 bases downstream from the N50; and (iii) 228 bases total, spanning from the start of the 5′ UTR to 15 bases downstream from the second exon. Although the sequence surrounding the barcode and N50 is constant across the library, the predicted secondary structure can change with the different sequence length depending on the affinity of each N50 element and the barcode to base-pair with different regions of the transcript. We also translated the bracket notation of the predicted MFE structure into five structural elements: internal loops, multiloops, hairpin loops, stacked bases, and single-stranded dangling ends using Forgi v2.0 (Thiel et al. 2019). These were also added to the one-hot encoding of the three sequence windows as five additional channels. Additionally, the probability for each base in the N50 to be base-paired in the entire 989-base-long transcript was included as an additional input channel to the one-hot encoding.
The CNNs used 200 kernels of length 15 in the first layer, followed by a ReLU activation, and a weighted mean-pooling layer
 given by the formula:
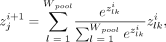 where i is the activation from the layer of kernel k at position l and pooling is performed across the window of size Wpool. The five architectures utilized different numbers of residual convolutional blocks, multihead attention, additional weighted-pooling
layers, and fully connected layers to predict the mean splicing efficiency (see Supplemental Table S5).
where i is the activation from the layer of kernel k at position l and pooling is performed across the window of size Wpool. The five architectures utilized different numbers of residual convolutional blocks, multihead attention, additional weighted-pooling
layers, and fully connected layers to predict the mean splicing efficiency (see Supplemental Table S5).
DATA DEPOSITION
The sequencing data are available via the NIH Sequence Read Archive (BioProject ID PRJNA961786). The code for the modeling is available via GitHub (https://github.com/LXsasse/SplicingMPRA).
SUPPLEMENTAL MATERIAL
Supplemental material is available for this article.
ACKNOWLEDGMENTS
We thank Tobias Jores for coding and technical advice for sequencing analyses as well as Sayeh Gorjifard for additional coding advice. We thank Christine Queitsch and David Mathews for helpful discussions and suggestions as well as Xinming Tu for the down-sampling analysis of the number of sequences used in the CNN models. This work was supported by grants R01 GM125809, R35 GM139532, and RM1 HG010461 from the National Institutes of Health.
Footnotes
-
Article is online at http://www.rnajournal.org/cgi/doi/10.1261/rna.079752.123.
- Received June 21, 2023.
- Accepted October 18, 2023.
This article is distributed exclusively by the RNA Society for the first 12 months after the full-issue publication date (see http://rnajournal.cshlp.org/site/misc/terms.xhtml). After 12 months, it is available under a Creative Commons License (Attribution-NonCommercial 4.0 International), as described at http://creativecommons.org/licenses/by-nc/4.0/.
REFERENCES
MEET THE FIRST AUTHOR

Meet the First Author(s) is an editorial feature within RNA, in which the first author(s) of research-based papers in each issue have the opportunity to introduce themselves and their work to readers of RNA and the RNA research community. Molly Perchlik is the first author of this paper, “Impact on splicing in Saccharomyces cerevisiae of random 50-base sequences inserted into an intron.” Molly is currently a research scientist in the Fields and Queitsch/Cuperus labs in the Department of Genome Sciences at the University of Washington in Seattle, Washington. She earned her B.S. in biology at Indiana University in 2011 and Ph.D. in plant biology at Washington State University in 2017 in the Tegeder lab, and subsequently worked for the Howard Hughes Medical Institute in the Torii lab.
What are the major results described in your paper and how do they impact this branch of the field?
In this study, we used a large intron library to identify several intron features that influence intron splicing efficiency, including GC content, the presence of GU dinucleotide repeats, and predicted secondary structure strength. Using this experimental data, we trained multiple computational models on the library; however, they were only able to predict a small portion of splicing in held-out sequences, suggesting greater complexity in the importance of different sequence features and sequence context for splicing than previously thought. Our work provides a rich data set to explore RNA processing and gene regulation in yeast.
What led you to study RNA or this aspect of RNA science?
RNA splicing has a significant influence on gene expression and regulation; however, there has been a lack of the detailed understanding needed to predict splicing efficiency for a given intron sequence. I was interested in overcoming the limitation of the small number of intron sequences in the native yeast genome with a large-scale library to provide a more comprehensive understanding of the importance of different intron sequence features for splicing.
During the course of these experiments, were there any surprising results or particular difficulties that altered your thinking and subsequent focus?
The modeling clarified that different intronic features interact with each other and with the intron context in modulating splicing efficiency. I think future studies that delve into potential nonlinear interactions and combinations of features involved in intron splicing will be very interesting. I am also interested to see if future improvements in structure prediction software may provide better insight into the specific mechanisms of how intron sequence influences effective splicing by the spliceosome.
If you were able to give one piece of advice to your younger self, what would that be?
I would encourage my younger self to delve into interests in other scientific fields outside my primary study or research endeavors. Not only for personal development, but also because I have found many important perspectives and techniques in other fields that have helped me in my own work. I wish I had started allocating time to explore other fields and literature sooner.




