


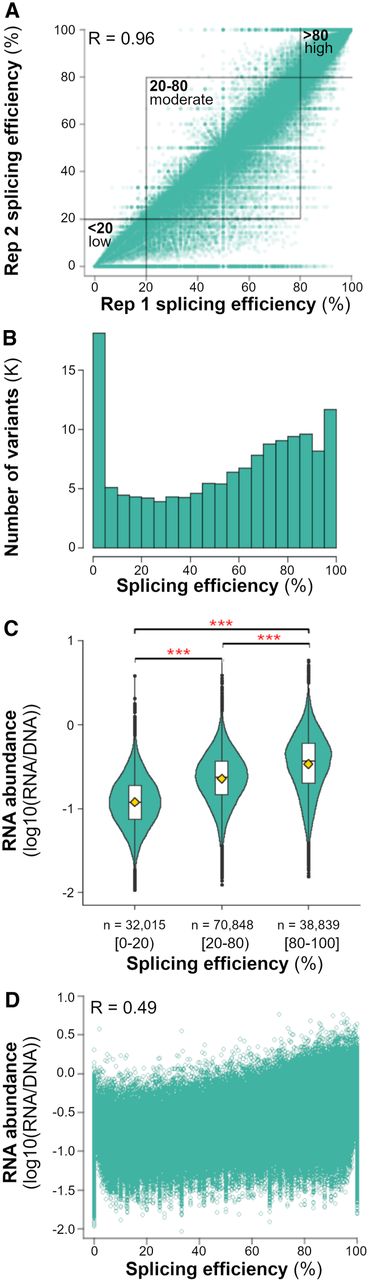
Sequencing analysis of splicing efficiency and transcript abundance in the N50 library. (A) Splicing efficiency of 141,710 intron variants present in two independent biological replicates of the intron library. Variants that displayed low (under 20%), moderate (20% to 80%), or high (above 80%) splicing efficiency in both replicates are boxed. (B–D) Averages of the two replicates are shown without overabundant outliers (>2000 reads/transcript, n = 141,702). (B) Histogram of RNA splicing efficiency displaying the distribution and range of splicing efficiencies of the N50 library. (C,D) RNA abundance was determined by the log10 of the total number of transcripts relative to total DNA for each variant. (C) RNA abundance versus splicing efficiency of each variant averaged across each splicing group (i.e., low, moderate or high). Brackets [ ] indicate inclusive values and parentheses ( ) indicate exclusive values. Horizontal brackets on top indicate significant differences between compared positions using a two-sample t-test, with three asterisks denoting P-values <5−16. The gold diamonds indicate the mean for each group. (D) RNA abundance versus splicing efficiency of each variant individually. Pearson's correlation coefficients are denoted by R.




