


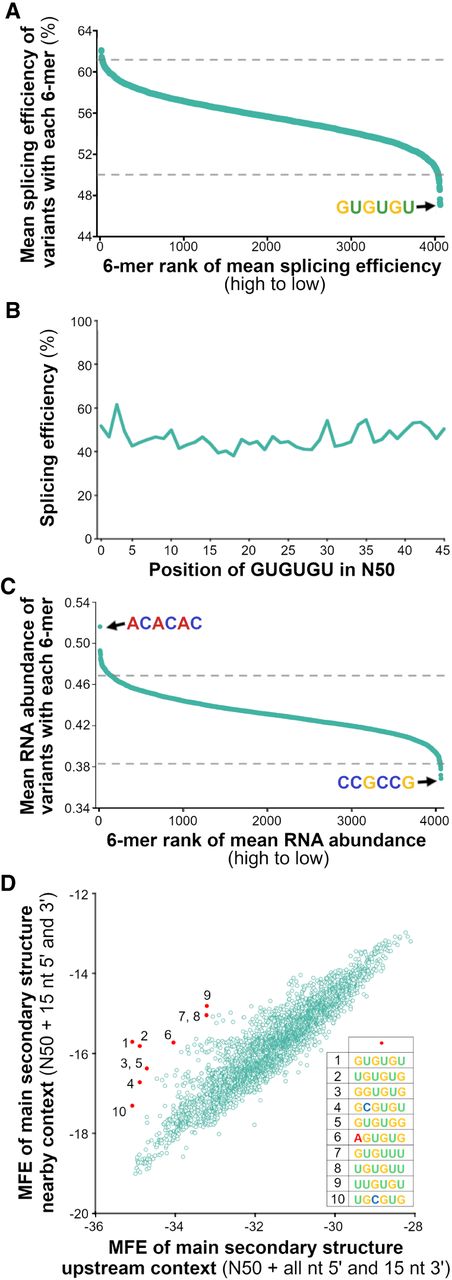
Analysis of all possible hexamers within the N50 library variants. (A–D) Values averaged between two biological replicates, n = 141,710. (A) Average splicing efficiencies of N50s containing each hexamer ranked highest (#1) to lowest (#4096). (B) Average splicing efficiencies of N50s containing GUGUGU and starting at each possible position within the N50. (C) Average RNA abundance of N50s containing each hexamer ranked highest (#1) to lowest (#4096). (D) Average minimum free energy (MFE) of the main predicted structure for the library variants using the N50 sequence and its “upstream” context (entire upstream RNA sequence and 15 bases downstream, 174 bases total) versus the “nearby” context (15 bases each side of N50, 80 bases total). The red numbered dots indicate the specific hexamers listed.




