


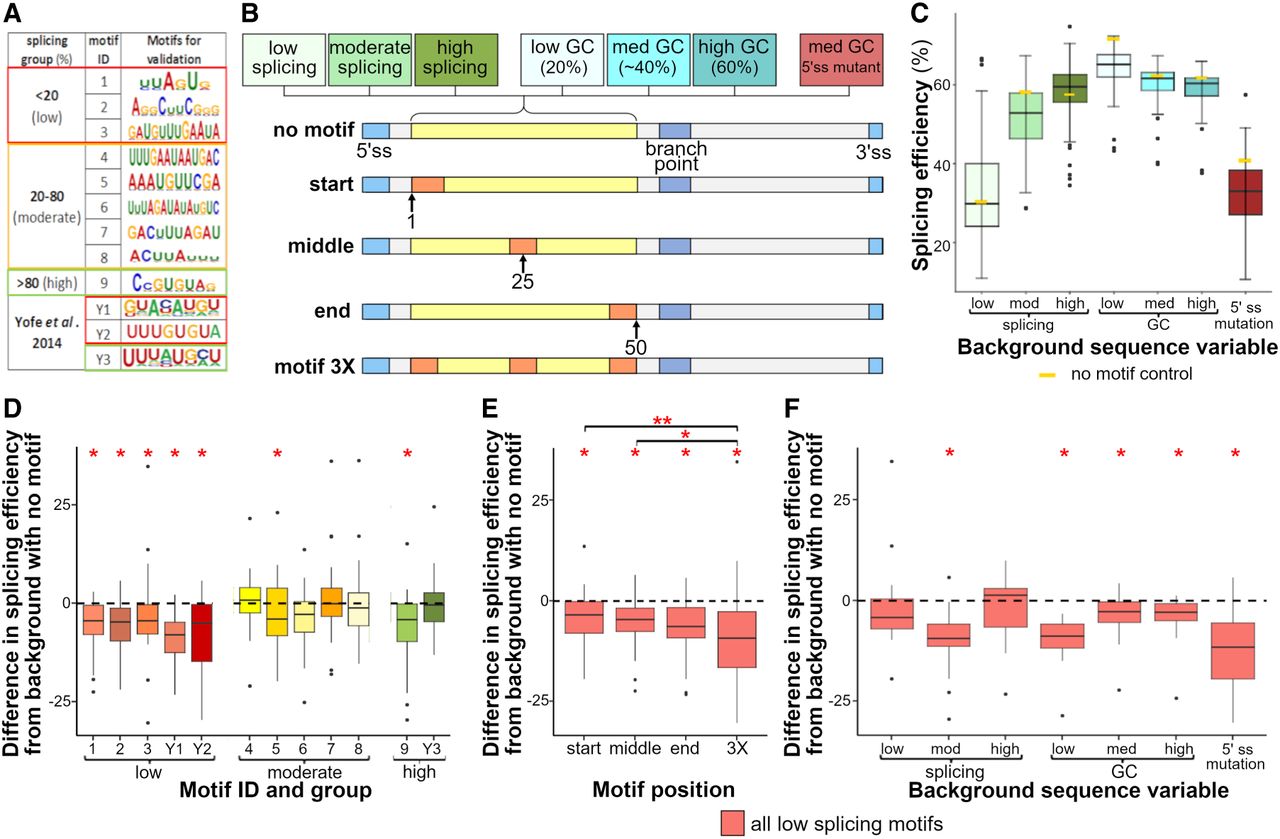
Overview and sequencing analysis of motifs enriched from splicing efficiency status in different intron backgrounds. (A–F) Results for the average of the two replicates. (A) Motifs that were enriched among the variants with unique barcodes that displayed low (under 20%), moderate (20% to 80%), or high (above 80%) splicing efficiency in both replicates relative to a randomization of those sequences with P-values <0.05. Also listed are motifs previously reported to reduce (Y1 and Y2) or enhance (Y3) splicing in Yofe et al. (2014). (B) Overview of the different sequence backgrounds and positions of motifs tested. Numbers indicate the position in the different 50-nt test regions, and regions of the introns are denoted (ss) splice site, (bp) branchpoint. (C) Average splicing efficiency for all motif variants and positions as well as the no motif controls, denoted by a gold rectangle, for each background sequence condition, n = 336. (D) The difference in splicing efficiency for each motif variant from the no motif control with the corresponding background sequence, averaged across all positions and backgrounds, n = 28. (E) The difference in splicing efficiency for each motif position from no motif control with the corresponding background sequence, averaged across the five low splicing motifs and all backgrounds, n = 35. Brackets indicate significant differences between compared positions using a two-sample t-test, with one asterisk denoting P-values <0.05 and three asterisks denoting a P-value <0.0005. (F) The difference in splicing efficiency for motifs in each background from no motif control with the corresponding background sequence, averaged across the five low splicing motifs and all positions, n = 20. Single asterisks on the top of the graphs indicate significant differences from the no motif control within each group when using a one-sample t-test with P-values <0.05.




