


Consequences of depleting TNRC6, AGO, and DROSHA proteins on expression of microRNAs
- Krystal C. Johnson1,
- Samantha T. Johnson2,
- Jing Liu3,
- Yongjun Chu4,
- Carlos Arana5,
- Yi Han6,
- Tao Wang6 and
- David R. Corey1
- 1Departments of Pharmacology and Biochemistry, UT Southwestern Medical Center, Dallas, Texas 75205, USA
- 2Eli Lilly, Lilly Corporate Center, Indianapolis, Indiana 46285, USA
- 3Iris Medicine, Palo Alto, California 94304, USA
- 4Exact Sciences, Phoenix, Arizona 85004, USA
- 5Genomics Core, UT Southwestern Medical Center, Dallas, Texas 75390, USA
- 6Quantitative Biomedical Research Center, Peter O'Donnell Jr. School of Public Health, UT Southwestern Medical Center, Dallas, Texas 75390, USA
- Corresponding author: david.corey{at}utsouthwestern.edu
Abstract
The potential for microRNAs (miRNAs) to regulate gene expression remains incompletely understood. DROSHA initiates the biogenesis of miRNAs while variants of Argonaute (AGO) and trinucleotide repeat containing six (TNRC6) family proteins form complexes with miRNAs to facilitate RNA recognition and gene regulation. Here we investigate the fate of miRNAs in the absence of these critical RNAi protein factors. Knockout of DROSHA expression reduces levels of some miRNAs annotated in miRBase but not others. The identity of miRNAs with reduced expression matches the identity of miRNAs previously identified by experimental approaches. The MirGeneDB resource offers the closest alignment with experimental results. In contrast, the loss of TNRC6 proteins had much smaller effects on miRNA levels. Knocking out AGO proteins, which directly contact the mature miRNA, decreased expression of the miRNAs most strongly associated with AGO2 as determined from enhanced crosslinking immunoprecipitation (AGO2-eCLIP). Evaluation of miRNA binding to endogenously expressed AGO proteins revealed that miRNA:AGO association was similar for AGO1, AGO2, AGO3, and AGO4. Our data emphasize the need to evaluate annotated miRNAs based on approximate cellular abundance, DROSHA-dependence, and physical association with AGO when forming hypotheses related to their function.
Keywords
INTRODUCTION
MicroRNAs (miRNAs) are small, ∼21 nt, RNA molecules that regulate gene expression (Lee et al. 1993; Pasquinelli et al. 2000; Elbashir et al. 2001; Lagos-Quintana et al. 2001; Lau et al. 2001; Lee and Ambros 2001; Treiber et al. 2019). miRNAs are transcribed as longer primary miRNAs (pri-miRNAs) by RNA polymerase II (Lee et al. 2002, 2003, 2004). After transcription, an RNase III enzyme, DROSHA, initiates canonical miRNA biogenesis by forming a complex known as Microprocessor. DROSHA, in concert with its essential cofactor DGCR8, cleaves pri-miRNAs into precursor miRNAs (pre-miRNAs) in the nucleus (Fig. 1A; Lee et al. 2003; Gregory et al. 2004). There are also several examples of miRNAs that have biological functions and are processed in a DROSHA-independent manner (Berezikov et al. 2007; Okamura et al. 2007; Ruby et al. 2007; Ender et al. 2008; Castellano and Stebbing 2013; Treiber et al. 2019). Once the pre-miRNAs are exported to the cytoplasm, a second RNase III enzyme, DICER, along with its cofactor TRBP, processes the pre-miRNA into a mature duplex miRNA (Bernstein et al. 2001; Hutvagner et al. 2001; Rossi 2005).
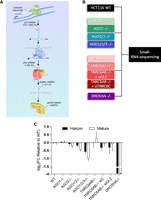
Effect of depleting essential RNAi factors on cellular miRNA profile. (A) Canonical miRNA biogenesis and miRNA guide strand incorporation into RNA-induced silencing complex (miRISC). (B) Experimental scheme for analyzing HCT116 WT and knockout cell lines by small-RNA-sequencing (RNA-seq). (C) Global hairpin and mature reads from RNA-seq and edgeR analysis.
DICER, TRBP, PACT, and chaperone proteins load the duplex miRNA into Argonaute (AGO) proteins (Chendrimada et al. 2005; Lee et al. 2006; Noland et al. 2011; Nakanishi 2016). During this loading process, the passenger strand is removed from the RNA duplex and the guide strand forms an RNA–protein complex with AGO that can efficiently and sequence-selectively bind RNA targets inside cells (MacRae et al. 2008; Iwasaki et al. 2010; Yoda et al. 2010; Chandradoss et al. 2015).
While the AGO:miRNA complex is sufficient to recognize target RNAs, recruitment of effector proteins helps modulate biological function. The miRNA:AGO complex binds to a scaffolding protein, trinucleotide repeat containing six (TNRC6), through interactions between TNRC6 and AGO. TNRC6 has the potential to bind other proteins, act as a hub for protein interactions, and contribute to the control of biological functions by miRNAs (Huntzinger et al. 2013; Duchaine and Fabian 2019). There are three human paralogs in human cells, TNRC6A, TNRC6B, and TNRC6C that are related to the Drosophila protein GW182. Although TNRC6 does not directly interact with the miRNA, it is needed to recruit proteins to assemble the high molecular weight RISC complex to repress the translation of the target mRNA and accelerate the mRNA's decay (Eulalio et al. 2008; Fabian et al. 2009; Djuranovic et al. 2012; Braun et al. 2013). One TNRC6 protein can interact with as many as three AGO proteins to increase dwell-time on a target mRNA and facilitate cooperativity in miRNA-mediated gene silencing (Elkayam et al. 2017; Hicks et al. 2017).
While the interactions of miRNAs and proteins associated with RNAi are well-characterized, the molecular mechanism of miRNAs and how they interact to control expression at individual genes and combinations of genes in human cells is less defined. Human microRNAs were first reported over 20 years ago. Since that time the number of annotated microRNAs has increased to 2654 in miRBase (Kozomara et al. 2019). The number of miRNAs in the human genome and their biological relevance remains a topic for discussion, with many lines of evidence previously reported that many miRNAs are false positives (Fromm et al. 2022).
The number of different miRNAs, when combined with the apparent simplicity and generality of seed sequence recognition, have led to many publications describing the identification of miRNAs as biomarkers and as regulators of gene expression. Understanding the mechanism of miRNA action and the application of miRNAs to therapy has not kept pace. While miRNAs have been the subject of intense study, the scope of their function in different cellular contexts remains undetermined (Kilikevicius et al. 2022).
Investigating the expression of miRNAs in individual cell types is important for understanding the impact of RNAi in those cell types (Sood et al. 2006; Bartel 2009; Anokye-Danso et al. 2011). Gaining this understanding requires combining experimental and computational approaches to prioritize which miRNAs are most likely to be candidates for biological regulation.
In this study, we seek to better understand the impact upstream biogenesis factors and downstream effector proteins have on steady-state miRNA levels. We used a suite of CRISPR/Cas9-mediated knockout cell lines (Fig. 1B) and small-RNA-sequencing (RNA-seq) to analyze the miRNA profiles in HCT116 cells. Even when two AGO proteins are knocked out, quantitative analysis reveals that expression compensates to maintain overall AGO levels. miRNAs bind similarly to AGO1–4, so even in the absence of AGO1 and AGO2 the capacity for miRNAs to form active RISC complexes with AGO protein is largely retained. We find the miRNA content of MirGeneDB (Fromm et al. 2020) is more likely to be associated with processing by DROSHA or interaction with AGO1–4. These studies help define the identity of DROSHA-dependent miRNAs and the contributions of TNRC6 and AGO variants to controlling the cellular pool of miRNAs.
RESULTS
Experimental design
We obtained knockout cell lines in an HCT116 colorectal cancer-derived background (Fig. 1B). HCT116 cells were chosen because they are diploid, facilitating the CRISPR–Cas9-mediated knockout of multiple related RNAi factor genes alone or in combination (i.e., DROSHA, AGO1, AGO2, AGO3, TNRC6A, and TNRC6B) (Liu et al. 2019; Chu et al. 2020, 2021). The expression of miRNAs in HCT116 cells is typical relative to other cultured cancer cell lines (Ghandi et al. 2019). We did not knock out AGO4 because, relative to the other AGO variants, it was much less expressed in HCT116 cells (Liu et al. 2019; Chu et al. 2020).
RNA-seq does indicate that AGO4 has a modest increase in expression when AGO1–3 are knocked out (Supplemental Fig. 1A), and AGO4 protein expression also increases when AGO1–3 are knocked out (Supplemental Fig. 1B). However, when measured by semi-quantitative mass spectrometry (Supplemental Fig. 1B; Liu et al. 2019), the expression of AGO4 protein remains one to two orders of magnitude lower than wild-type expression of the individual AGO1–3 variants. We were also not able to obtain a viable cell line with all three TNRC6 protein paralogs (TNRC6A, TNRC6B, and TNRC6C) knocked out. An siRNA pool was used to knock down TNRC6C expression in the context of cells lacking TNRC6A and TNRC6B, referred to as TNRC6A/B−/− + siTNRC6C (Liu et al. 2019).
miRNA expression was analyzed by small RNA-seq, and each knockout cell line was analyzed in triplicate to detect reads 17–40 nt in length. The samples submitted for small RNA-seq had RNA integrity numbers (RINs) greater than or equal to 9.4 (Supplemental Table 1). Multidimensional scaling (MDS) analysis for samples submitted for small RNA-seq shows that biological replicates cluster together, demonstrating consistent results for each cell line (Supplemental Fig. 2A).
The TruSeq kit was used for library preparation for the sequencing of small RNAs, which Narry Kim's laboratory has shown to produce a linker ligation bias that skews the strand preference, annotation of 5′ termini ends of miRNAs, and ability to detect alternative processing and uridylation (Kim et al. 2019). Although the use of their optimized AQ-seq library preparation that includes randomized adapters and 20% PEG would improve our analysis, our use of the conventional TruSeq library preparation showed that the biases are reproducible and still useful for comparing the same miRNAs in different samples (Supplemental Fig. 2B,C). We also acknowledge that the use of spike-in controls would improve the rigor of our experimental design (Tam et al. 2015). When we analyzed the detection of miRNAs across different levels of abundance based on intervals of gene counts, a similar distribution of miRNAs was detected for all samples across the different expression levels (Supplemental Fig. 2B). When we calculated the ratio of 5p to 3p strand, we observed an enrichment for 5p strands in a small subset of miRNAs, consistent with findings from Kim et al. (2019), and this bias was reproducible for this subset of miRNAs across all samples (Supplemental Fig. 2C).
High-throughput sequencing can introduce biases during library preparation that can lead to over or under estimation of miRNA species within a population. To evaluate the possibility that these biases might affect our conclusions, we measured miRNA abundance using specific TaqMan RT-qPCR analysis in wild-type and DROSHA knockout cells (Supplemental Fig. 3A,B). The data showed similar fold reduction with either RNA-seq or qPCR when DROSHA is knocked out.
We first evaluated the effect of knocking out RNAi factors on hairpin and mature miRNA expression (Fig. 1C; Supplemental Table 1). In DROSHA knockout cells, consistent with DROSHA's role as the most upstream processing enzyme, hairpin, and mature miRNA expression were reduced ∼16-fold. miRNA expression showed little change in TNRC6A/BKO + siTNRC6C knockout/knockdown cells. Cells lacking only AGO1 or AGO2 showed little change in miRNA levels, consistent with the redundancy of AGO function. Cells lacking AGO1/2 showed an intermediate reduction. AGO1/2/3 knockout cells showed the largest effect—a twofold reduction in mature miRNA levels.
Effect of knocking out DROSHA on detection of miRNAs
Multiple computational and experimental approaches have led to different conclusions about the identity and annotation of miRNAs (Kozomara et al. 2019; Kim et al. 2021; Fromm et al. 2022), leading to uncertainty about the composition of bona fide miRNAs inside cells. A primary goal of this study was to prioritize annotated miRNAs for potential biological relevance.
To achieve this goal, we began by comparing the expression of miRNAs in DROSHA knockout cells using either the ∼2600 miRNAs in miRBase (Fig. 2A; Kozomara et al. 2019) or the 567 miRNAs currently annotated in MirGeneDB (Fig. 2B). While miRBase has historically been more widely used, MirGeneDB has been extensively curated to identify the RNA species most likely to be bona fide miRNAs based on a set of consistent criteria for metazoan miRNA genes (Fromm et al. 2015, 2020, 2022).
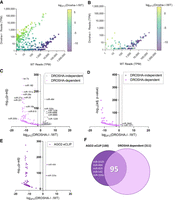
Effect of genetic deletion of DROSHA on mature miRNA expression. (A) Plot of global differential miRNA expression from RNA-seq of DROSHA−/− relative to WT HCT116 cells with miRNAs from miRBase with read cutoff at one transcript per million (TPM) for displayed miRNAs (N = 3). (B) Plot of global differential miRNA expression from RNA-seq of DROSHA−/− relative to WT HCT116 cells with miRNAs from MirGeneDB with read cutoff at 1 TPM for displayed miRNAs. (C) Volcano plot where gray dots represent miRNAs that were reported as DROSHA-independent, and pink dots represent miRNAs that were reported as DROSHA-dependent. Differential expression and significance (adjusted P-value) calculated with edgeR, and dotted lines represent two log2 fold-changes. (D) Volcano plot showing differential expression and significance of miRNAs that are listed in MirGeneDB in DROSHA−/− cells relative to WT HCT116. (E) Volcano plot of differential expression in DROSHA−/− relative to WT cells from small-RNA-seq showing only the top 100 miRNAs associated with AGO2 from AGO2-eCLIP in WT HCT116 cells. (F) Venn diagram showing overlap between miRNAs highly associated with AGO2 (top 100 AGO2-eCLIP) and miRNAs that were reported DROSHA-dependent in biochemical assays.
Like any biomolecule, miRNAs that are more highly expressed will be more likely to exert a biological effect than those that are not well expressed (Cech and Steitz 2014). Therefore, we examined the effect of DROSHA knockout as a function of miRNA expression. Contrary to the expectation that loss of DROSHA expression should abolish expression of most miRNAs, analysis of all miRNAs annotated in miRBase revealed that knocking out DROSHA expression led to both increased and decreased detection of annotated miRNAs (Fig. 2A). For reference, in wild-type cells the 10 most highly detected miRNAs were present at 170,000–200,000 transcripts per million (TPM) (Fig. 2A,B; Supplemental Fig. 4A). Of the 370 miRNAs annotated in miRBase that showed increased expression in the absence of DROSHA, most were detected at relatively low levels (less than 200 TPM) in wild-type HCT116 cells (Supplemental Fig. 4B). Only seven miRNAs that had been annotated in miRBase and were up-regulated in our data were detected with transcript numbers greater than 1000, and none were greater than 5000 TPM. The observation that DROSHA knockout increases the detection of many annotated miRNAs raises the question of whether the up-regulated miRNAs were likely to be biologically relevant.
Compared to the miRNAs annotated in miRBase, as a group, the miRNAs annotated in MirGeneDB were more likely to be expressed at relatively higher levels in wild-type HCT116 cells and were more likely to show decreased expression in DROSHA knockout cells (Fig. 2A,B). For example, only 37 miRNAs in the MirGeneDB cohort showed increased expression in DROSHA knockout cells and those few miRNAs had only ∼10 reads in wild-type cells (Fig. 2B). These analyses support the conclusion that MirGeneDB includes a higher percentage of small RNAs that are likely better candidates to be products of canonical miRNA biogenesis than does miRBase.
Effect of DROSHA knockout on miRNAs previously investigated for DROSHA processing
We used experimentally derived data published by Kim and coworkers on DROSHA processing of thousands of annotated miRNAs to further prioritize the identification of miRNAs produced by canonical miRNA biogenesis (Kim et al. 2016, 2017, 2021). Of 1881 pri-miRNAs evaluated, 311 miRNAs had been identified as DROSHA-dependent, 257 as independent, and the remainder classified as “not yet determined” using multiple biochemical approaches. We used both miRBase and MirGeneDB to analyze the fate of these different classes of potential miRNAs.
Regardless of which database was used, almost all previously identified DROSHA-dependent miRNAs were down-regulated in DROSHA knockout cells, validating the experimental findings of Kim and coworkers (Fig. 2C,D). Relative to miRBase (Fig. 2C), however, MirGeneDB included many fewer miRNAs that had been identified by Kim and coworkers as DROSHA-independent (Fig. 2D). This outcome is again consistent with the conclusion that MirGeneDB contains a higher percentage of RNAs likely to be produced through canonical miRNA biogenesis than does miRBase since their curated list of miRNAs emphasizes inclusion of 2-nT offsets resulting from DROSHA and DICER processing.
When the miRNAs evaluated by Kim and coworkers are analyzed in the context of MirGeneDB, 254 miRNAs were designated as “not yet determined,” and we examined whether out data offered any insights into this class of miRNA. One-hundred and fourteen of these “not yet determined” miRNAs were not detected by our RNA-seq. Of the remaining 140 “not yet determined” miRNAs (Supplemental Fig. 4C–E), 110 were detected at less than 10 reads (TPM) in wild-type HCT116 cells (Supplemental Fig. 4E). Of the remaining 30 miRNAs with greater than 10 reads (TPM), 28 were down-regulated and two, miR-106a and miR-580, were up-regulated in DROSHA knockout relative to WT. The infrequent detection of these miRNAs was decreased further when DROSHA was knocked out (Supplemental Fig. 4D,E), consistent with the possibility that they are DROSHA-dependent.
The effect of DROSHA knockout on miRNAs associated with AGO2
The miRNA:AGO partnership is central to RNAi-mediated gene regulation, and miRNAs that have been demonstrated experimentally to physically associate with AGO2 are more likely to impact biological regulation (Flores et al. 2014; Luna et al. 2015). To further evaluate the potential of miRNAs to be biologically active, we evaluated the effect of knocking out DROSHA on the 100 miRNAs that were most strongly associated with AGO2 protein in our eCLIP analysis (Chu et al. 2020). Almost all (98/100) miRNAs associated with AGO2 showed reduced expression in DROSHA knockout cells (Fig. 2E). The two miRNAs with increased expression were DROSHA-independent, endogenous shRNAs, miR-484, and miR-320a (Fig. 2E; Babiarz et al. 2008).
Comparison of miRNAs from our AGO2-eCLIP and data from Kim and coworkers revealed that 95 of the top 100 AGO2-eCLIP miRNAs were also among the 311 experimentally identified DROSHA-dependent RNAs (Fig. 2F). Of the five miRNAs from the top 100 AGO2-eCLIP list that had not previously been identified as DROSHA-dependent by Kim and coworkers (Fig. 2E), miR-3529 and miR-429, and miR-142, had been identified as “not yet determined.” miR-3529 and miR-429 both show decreased expression in DROSHA knockout cells (Supplemental Fig. 4F–H), suggesting that they are DROSHA-dependent. Expression of miR-142 is barely detectable in either cell line. Two other miRNAs, miR-484 and miR-320a showed a dramatic increase in expression, supporting previous reports (Supplemental Fig. 4G; Wang et al. 2014; Fields et al. 2021; Kim et al. 2021) that they derive from DROSHA-independent endogenous shRNAs (Babiarz et al. 2008).
Finally, we evaluated the overlap between miRNAs that are annotated by MirGeneDB with the top 100 miRNAs associated with AGO2 from our eCLIP data set (Supplemental Fig. 4I). We observed that 98 out of these 100 AGO2-eCLIP miRNAs are annotated on MirGeneDB. The two miRNAs that did not overlap were miR-484, mentioned above as DROSHA-independent, and miR-3529, a poorly conserved miRNA. Taken together, these data suggest that DROSHA-dependent miRNAs in wild-type cells are characterized by physical association with AGO2, relatively abundant expression, and inclusion in the curated MirGeneDB. MirGeneDB contains the subset of miRNAs in miRBase most likely to be the products of canonical miRNA biogenesis and be expressed at levels that make them the most likely candidates for biological regulation.
Effect of depleting TNRC6 paralogs on detection of miRNAs
We evaluated miRNA levels in cells lacking TNRC6 proteins. TNRC6 is a scaffolding protein responsible for bringing proteins together to regulate gene expression (Braun et al. 2013). TNRC6 is not a biogenesis factor like DROSHA, nor does it come into direct contact with miRNAs like the AGO proteins do (Fig. 3A). It is capable of bridging two to three AGO proteins (Elkayam et al. 2017; Hicks et al. 2017), using cooperative interactions to increase the ability of the complexes between miRNAs and AGO to stably associate with target mRNAs. We evaluated miRNA expression in TNRC6A/B double knockout relative to wild-type and triple TNRC6A/B knockout + siTNRC6C cells relative to wild-type cells transfected with siGL2 negative control (Fig. 1B).
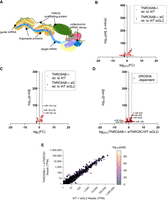
Effect of loss of TNRC6 paralogs on mature miRNA expression. (A) Scheme showing interactions of TNRC6 protein during miRNA-mediated silencing. Tryptophan residues on the TNRC6 protein are indicated as “W” in a circle. (B) Volcano plot of global differential miRNA expression of miRNAs annotated on MirGeneDB from small-RNA-seq in TNRC6AB−/− relative to WT (pink) and TNRC6AB−/− + siTNRC6C cells relative to WT HCT116 transfected with siGL2 negative control (red). (All sequencing performed in three biological replicates. Differential expression and significance [P-adj] calculated with edgeR, and dotted lines represent two log2 fold-change. Read cutoff of 1 TPM for all displayed miRNAs.) (C) Volcano plot of differential miRNA expression from small-RNA-seq in TNRC6AB−/− relative to WT and TNRC6AB−/− + siTNRC6C (pink) cells relative to WT HCT116 transfected with siGL2 negative control (red) showing only the top 100 miRNAs associated with AGO2 from AGO2-eCLIP from HCT116. (D) Volcano plot where red dots represent differential expression of miRNAs that were reported as Drosha-dependent (Kim et al. 2021) in TNRC6AB−/− HCT116 transfected with siTNRC6C relative to WT HCT116 transfected with siGL2 negative control. (E) TPM for all miRBase miRNAs with expression levels above the read cutoff of 1 TPM in WT transfected with siGL2 negative control and TNRC6AB−/− transfected with siTNRC6C. The color of each point represents significance, −log10 adjusted P-value.
Analysis of the full cohort of annotated miRNAs in MirGeneDB revealed similar numbers of up- and down-regulated RNAs for both TNRC6A/B double knockout and triple TNRC6A/B knockout + siTNRC6C cells (Fig. 3B). The cohorts of the 100 miRNAs most enriched upon immunoprecipitation in our previous AGO2-eCLIP-sequencing (Fig. 3C) or the 311 DROSHA-dependent miRNAs identified by Kim and coworkers (Fig. 3D; Supplemental Fig. 5A) showed a similarly mixed response to loss of the TNRC6 paralogs. There are only a handful of miRNAs that showed greater than two log2 fold-changes (Fig. 2C,D). The most abundantly expressed DROSHA-dependent miRNAs did not show significant expression change (Supplemental Fig. 5B). The lack of robust expression change was maintained regardless of the expression level of the miRNA (Fig. 3E). The mixed response and lack of robust expression changes, regardless of miRNA cohort analyzed or miRNA expression level, suggests that expression of TNRC6 paralogs and their ability to act as a scaffolding protein for AGO and other cofactors does not affect miRNA levels.
Quantitative effect of various AGO knockouts on overall pool of AGO protein
There are four AGO variants within human cells, AGO1–4 (Liu et al. 2004; Meister et al. 2004), and AGO proteins come into direct contact with miRNAs (Fig. 4A). In HCT116 cells, AGO4 is expressed at much lower levels than AGO1–3 (Liu et al. 2019). Because AGO protein comes into direct contact with miRNAs, we examined the effect of knocking out AGO variants on miRNA levels.
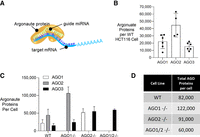
Absolute quantification of AGO proteins per cell shows compensation of remaining paralogs after AGO depletion. (A) Scheme showing AGO protein loaded with a microRNA guide strand that is engaged with a target mRNA. (B) Absolute quantification of AGO1, AGO2, and AGO3 protein molecules per WT HCT116 cell based on recombinant Western standard curve titration of recombinant AGO1, AGO2, and AGO3 compared to cell lysate from WT HCT116. Cells were counted prior to lysis to estimate protein number per cell. (C) Graph showing absolute quantification of AGO1, AGO2, and AGO3 protein molecules per cell in HCT116 WT, AGO1−/−, AGO1/2−/− cells from Western standard curve analysis. (D) Table of AGO1, AGO2, and AGO3 protein molecules per cell in WT, AGO1−/−, AGO2−/−, and AGO1/2−/− HCT116 cells.
Before evaluating miRNAs, however, it was necessary to understand how many AGO protein molecules were inside cells in each of our knockout cell lines. To determine the number of AGO1–3 molecules per cell we used antibodies capable of detecting cellular AGO1, AGO2, or AGO3 proteins by western analysis in combination with titration with known quantities of recombinant AGO1, AGO2, or AGO3 proteins (Supplemental Fig. 6). Using this assay, we observed 20,000, 40,000, and 15,000 copies of AGO1, AGO2, and AGO3 in each wild-type HCT116 cell (Fig. 4B). In knockout cells, the AGO variants tended to compensate for one another. For example, when AGO2 was knocked out, AGO1 levels increased (Fig. 4C). When AGO1 is knocked out, AGO2 levels are increased. Finally, in AGO1, AGO2, or AGO1/2 knockout cells, AGO3 levels increase. When only one or two AGO variants are knocked out, increased expression of the remaining AGO variants maintains overall AGO expression at a level near that of wild-type HCT116 cells (Fig. 4D).
Effect of AGO knockouts on detection of miRNAs by RNA-seq
We next tested the effect of knocking out the expression of AGO proteins on miRNAs and whether that analysis would support the prioritization of potentially bioactive RNAs. AGO proteins come into direct contact with miRNAs and might be expected to protect miRNAs from degradation (van Rooij et al. 2007; Baccarini et al. 2011; Winter and Diederichs 2011; De et al. 2013; Sheu-Gruttadauria and MacRae 2017), leading to a bigger impact on miRNA levels than the TNRC6 paralogs. We compared the effects of knocking out AGO1, AGO2, AGO1/2, and AGO1/2/3 protein expression on the expression of miRNAs.
Examining the entire catalog of annotated miRNAs in MirGeneDB revealed that miRNA profiles were relatively unchanged when AGO1 or AGO2 were knocked out individually (Fig. 5A). This result is consistent with previous data suggesting that AGO1 and AGO2 are at least partially redundant (Landthaler et al. 2008; Wang et al. 2012; Chu et al. 2020). There was a larger effect when AGO1/2 were knocked out together, and the largest effect was observed in the triple AGO1/2/3 knockout. In contrast to the even distribution of changes in MirGeneDB, we observed decreased levels for almost all 100 most enriched miRNAs from our AGO2-eCLIP-sequencing data (Fig. 5B). Once again, the largest effects were observed in the triple AGO1/2/3 knockout cells.
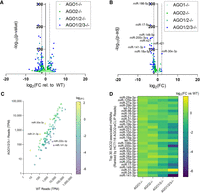
Effect of genetic deletion of AGO paralogs on mature miRNA expression. (A) Volcano plot of global differential miRNA expression of miRNAs annotated on MirGeneDB relative to WT from small-RNA-sequencing of HCT116 AGO1−/−, AGO2−/−, AGO1/2−/−, and AGO1/2/3−/− knockout cells. Differential expression and significance (P-adj) calculated with edgeR, and dotted lines represent two log2 fold-changes. Read cutoff of 1 TPM for all displayed miRNAs. (B) Volcano plot of differential miRNA expression relative to WT from small-RNA-sequencing showing only the top 100 miRNAs associated with AGO2 from AGO2-eCLIP in WT HCT116. (C) Plot of TPM for the top 100 miRNAs from AGO2-eCLIP in WT and AGO1/2/3−/− with the color of each point representing log2 fold-change in AGO1/2/3−/− relative to WT. (D) Heat map of differential expression of the top 30 miRNAs associated with AGO2 from AGO2-eCLIP from HCT116 AGO1−/−, AGO2−/−, AGO1/2−/−, and AGO1/2/3−/− relative to WT.
AGO2 has been shown to be critically important for the noncanonical biogenesis of a subset of miRNAs. Two erythrocyte-specific miRNAs, miR-451 and miR-486, require AGO2 slicing for their maturation (Cheloufi et al. 2010; Cifuentes et al. 2010; Jee et al. 2018). AGO2, rather than DICER, cleaves the precursor stem of miR-451, and the mature and functional form of miR-451 is formed after additional trimming by poly(A)-specific ribonuclease (Cheloufi et al. 2010; Cifuentes et al. 2010). After DICER processing, the miR-486 duplex requires AGO2 cleavage for the removal of the passenger strand (Jee et al. 2018). We found that miR-451A and miR-486 expressions are low, less than 50 TPM, in wild-type HCT116 cells, yet the mature form of miR-451A is decreased by eightfold in HCT116 AGO2 knockout cells, whereas miR-486 has no significant expression change (adjusted P-value = 0.23).
In support of AGO2-dependent maturation, the passenger strand of miR-486-3p is reduced in the AGO1 knockout cells compared to WT where AGO2 protein levels are twofold higher (Fig. 4C; Supplemental Fig. 5C). Higher levels of AGO2 can lead to higher levels of miR-486 duplex cleavage and guide strand incorporation into RISC. Furthermore, miR-486-3p is significantly increased in all cell lines where AGO2 is knocked out (Supplemental Fig. 5C), which suggests that miR-486 may remain as a duplex and prevent passenger strand degradation. These findings support that miR-451 and miR-486 expression are cell-context specific and limited outside of the hematopoietic system, and the decrease in mature miR-451A in the absence of AGO2 reinforces the requirement for the conservation of AGO2 slicing activity in mammals.
Examination of the relative abundance of the top 100 AGO2-eCLIP miRNAs showed that the most highly expressed miRNAs in WT cells with over 1000 TPM detected were almost all down-regulated or unchanged (Fig. 5C). Evaluation of the 30 most enriched microRNAs showed the least change in the single AGO1 or AGO2 knockout cells, greater change in the double AGO1/2 knockout cells, and the greatest change in the triple AGO1/2/3 knockout cells (Fig. 5D). Of these 30 most enriched RNAs, 29 were detected at lower levels when AGO was knocked out. The largest changes observed in AGO1/2/3 knockout cells support the absolute quantification of AGO proteins and demonstrate that the greatest loss of miRNA expression only occurs once most of the cellular pool of AGO protein is depleted.
Association of miRNAs with AGO proteins
To further explore the impact of the association of AGO proteins and miRNAs, we used a collection of knockout cell lines and different anti-AGO antibodies (Figs. 6, 7) to test whether AGO variants possessed preferences for binding to miRNAs. We first immunoprecipitated cellular RNA using an anti-AGO1 or an anti-AGO2 antibody followed by small-RNA-seq (Fig. 6A).
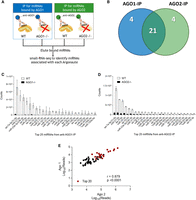
Similar abundant miRNAs found associated with AGO1 and AGO2. (A) Parallel AGO-immunoprecipitations in WT HCT116, AGO1−/−, and AGO2−/− cells. (B) Venn diagram showing the overlap between the top 25 miRNA by counts in the AGO1 and AGO2 pull-downs in the WT cell lines (circles not drawn to scale). (C,D) Chart showing the top 25 miRNA by counts in the (C) 2A7 Ago1 antibody pull-down in the WT and AGO1−/− cell lines and in the (D) 3148 anti-AGO2 antibody pull-down in the WT and AGO2−/− cell lines. miRNAs indicated with a (*) are the four miRNAs that did not overlap in both pull-downs from (B). (E) Pearson correlation plot of miRNA reads for the top 60 miRNAs in the AGO2 and AGO1 protein pull-down in WT. The top 20 miRNAs with the highest read count from the anti-pan-AGO antibody 2A8 pull-down are highlighted in red.
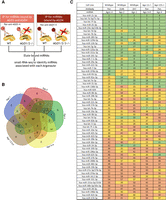
Similar abundant miRNAs found associated with all AGO proteins. (A) Experimental scheme for parallel AGO-immunoprecipitations in WT HCT116, AGO1/2−/−, and AGO1/2/3−/− cells. (B) Venn diagram of the top 100 miRNA by counts from AGO1, AGO2, and the Pan argonaute antibody pull-downs in the various cell lines (WT = AGO 1,2,3,4; AGO12−/− = Ago 3,4; AGO123−/− = Ago 4). (C) Table showing where the overlapping 60 top miRNAs (from B) are ranked in each pull-down, using the Ago1–4 pull-down in the WT as a reference. The green (top 20), yellow (middle 20), and orange (bottom 20) show the ranking of the 60 overlapping miRNAs immunoprecipitated in comparison to a previously published AGO2-eCLIP-sequencing data set (Chu et al. 2020).
We focused on the 25 RNAs that were the most highly detected in each (AGO1 or AGO2) pull-down. Of the 25 in each cohort, 21 miRNAs were overlapping in both the AGO1 and the AGO2 pull-down (Fig. 6B). The shared miRNAs were detected in a similar rank order relative to one another (Fig. 6C,D). A linear correlation plot for the reads from the top 60 overlapping miRNAs in the anti-AGO1 and anti-AGO2 pull-downs showed a significant Pearson correlation value (r = 0.88, P < 0.0001), suggesting that similar miRNAs are associated with AGO1 and AGO2 (Fig. 6E).
While we did not possess an anti-AGO3 antibody suitable for the confident interpretation of immunoprecipitation/small-RNA-seq data, we did have a “PAN” AGO antibody (2A82) capable of efficiently pulling down all AGO variants (Nelson et al. 2007). The anti-AGO1, anti-AGO2, and PAN antibodies in combination with our AGO1/2 and AGO1/2/3 knockout cells lines allowed us to infer association with AGO3 and AGO4 (Figs. 6A, 7A; Supplemental Fig. 7A). The immunoprecipitations performed in different AGO knockout cell lines showed nearly zero read counts compared to the same immunoprecipitation performed in WT, supporting strong enrichment of AGO-specific enrichment of associated miRNAs (Supplemental Fig. 7B,C).
Of the top 100 miRNAs detected, 60 were detected by every anti-AGO detection scheme, indicating physical association with all four AGO proteins (Fig. 7B). Evaluation of the IP-sequencing data based on a ranking of the reads for the associated miRNAs showed strong similarity between miRNAs in the four AGO association cohorts (Fig. 7C). In general, miRNAs that were in the top third of miRNAs bound to the PAN antibody in wild-type HCT116 cells were also in the top third of miRNAs in other cell types using other antibodies (Fig. 7C). The Pearson correlation values of the different AGO-specific immunoprecipitations showed significant positive correlations (r > 0.6, P < 0.0001) regardless of which pair of AGO proteins were being compared demonstrating the strong overlap of miRNA identities and similar relative abundances of each miRNA associated with the different AGO proteins (Supplemental Fig. 8). These data (Figs. 6, 7) suggest that AGO1, AGO2, AGO3, and AGO4 do not show strong preferences for individual miRNAs.
In these experiments, we use three different anti-AGO antibodies that will likely have different affinities for AGO and perform differently in experiments. However, since we are measuring the relative pull-down efficiencies of different miRNAs, it is unlikely that the different antibody:AGO affinities will affect the rank order of results for one AGO variant relative to another. This supposition is supported by our observation that the rank order of miRNA recovery for AGO1–4 is similar. We also use different HCT116-derived knockout cell lines, and this might also affect the recovery of AGO variants or AGO-associated miRNAs. The pan-AGO antibody was used in wild-type, AGO1/2, and AGO1/2/3 knockout cells and showed similar profiles of associated miRNAs (Fig. 7C). These results are in agreement with previous studies that pulled down (1) tagged AGO1–4 in HEK293 cells (Hafner et al. 2010), (2) endogenous AGO1–3 proteins in AGO1, AGO2, and AGO1/2 knockout human melanoma cells (Wang et al. 2012), and (3) endogenous AGO1–4 proteins in HeLaS3 cells (Dueck et al. 2012) and showed that overall miRNAs distribute randomly among the individual AGO proteins according to their relative protein abundance.
DISCUSSION
RNA-mediated gene regulation and the necessity for prioritizing miRNAs
RNAi and small RNAs provide a powerful mechanism for controlling gene expression in mammalian cells (Duchaine and Fabian 2019; Gebert and MacRae 2019). An AGO protein binds a small-RNA to form a ribonuclear protein complex in which the small RNA programs complementary recognition of target RNA sequences. The AGO protein can perform at least three critical roles: (1) protecting the RNA from degradation; (2) facilitating efficient recognition and recruitment of effector proteins for repression of target RNAs; and (3) facilitating cleavage of the fully complementary RNA sequences (in the case of AGO2 and, to a lesser extent, AGO3). The high efficiency and regulatory potential of this process is exemplified by the potent and long-lasting repression of gene expression achieved by multiple designed synthetic RNA drugs in the clinic.
While the potential of designed duplex RNAs is now well understood, the role of endogenously expressed miRNAs in cells remains less clear. While over 10,000 papers that cite the term “miRNA” are published each year (Kilikevicius et al. 2022), many of the papers that involve mammalian cells lack the exploration of the mechanism necessary to confidently assign miRNAs to specific regulatory function.
There are 1917 precursor miRNAs and 2654 mature miRNAs annotated in miRBase (Kozomara et al. 2019). These thousands of potential miRNAs offer a vast scope for gene regulation. The simplicity of seed sequence pairing, which requires only seven or eight bases of perfect complementarity, fills the transcriptome with potential miRNA binding sites. Productive studies require the prioritization of miRNAs to identify those most likely to have biological impact. While miRBase may be the largest repository for miRNAs and has been widely used, the more stringently curated MirGeneDB (Fromm et al. 2015, 2020, 2022) resource offers a smaller data set for analysis that focuses on miRNA genes that meet a consistent set of criteria. In this manuscript, we analyze our RNA-seq data in the context of both databases and observe that the miRNAs in MirGeneDB are more likely to be the products of canonical miRNA biogenesis pathways and be expressed at higher levels more likely to correlate with biological activity.
Recognition by miRNAs, not a simple process
The assumption that recognition of RNA by miRNA is a simple, predictable process drives the hypothesis behind many reports of gene regulation by small RNAs. The regulation of gene expression by miRNAs is likely to be much more complex. For canonical regulation of gene expression in the cytoplasm of mammalian cells, miRNAs bind to the 3′-untranslated region (Friedman et al. 2009). Gene regulation may involve the cooperation of multiple different miRNAs at each untranslated region, and the biological impact may be the sum of impacts from binding to several different genes. Further increasing the potential for complexity, it is also possible for miRNAs to recognize sequences within the coding region of mRNA. The need to consider the potential for multiple miRNAs to contribute to the regulation of each RNA target makes thorough prioritization of miRNAs an essential component of any plan to explore miRNA-mediated gene regulation and mechanism.
Knockout of RNAi factors prioritize bona fide miRNAs
The goal for our study was to stratify functional miRNAs based on the impact of knocking out critical RNAi proteins on miRNA expression. DROSHA is one of the key factors responsible for processing miRNAs. We reasoned that knocking out DROSHA expression would differentiate small RNAs that were likely to be active miRNAs from small RNAs that resembled miRNAs but lacked the potential to act like miRNAs.
Of the 2654 miRNAs annotated in miRBase, 1071 showed decreased expression when DROSHA expression was knocked out. Whenever genes are knocked out, however, it is always possible that secondary effects may explain altered expression when genome-wide transcription is measured. Down-regulated small RNAs might be misleadingly identified as miRNAs. Conversely, up-regulated small RNAs that are bona fide miRNAs generated by alternative biogenesis pathways might be overlooked (Yang and Lai 2011).
We used several independent approaches to build confidence in miRNA identification: (1) Since miRNA prevalence is related to biological activity, we evaluated the relative expression of miRNAs and found that the more highly expressed miRNAs were also the ones most likely to be down-regulated when DROSHA was knocked out; (2) because association with AGO is a hallmark of active miRNAs, we evaluated RNAs known to be associated with AGO2 and observed that they were also down-regulated when DROSHA was knocked out; (3) we identified miRNAs that were abundant and overlapping in association with all four AGO proteins from immunoprecipitations; and (4) Kim and coworkers performed thorough biochemical studies to identify annotated miRNAs that can be processed in vitro (Kim et al. 2021). Their identified DROSHA-dependent RNAs included 95/100 of the miRNAs that we had identified as most associated with AGO2. Taken together, these comparisons identify 60 mature miRNAs (Fig. 7C) that are among the most prevalent miRNAs bound to AGO2 from AGO2-eCLIP and bound to AGO1–4 from immunoprecipitation. These data suggest these miRNAs—under 2% of the overall miRNA repertoire—as the best candidates for robust biological regulation in this cell line.
We also used the more highly curated MirGeneDB resource (Fromm et al. 2015, 2020, 2022). MirGeneDB is a manually curated open-access database that currently includes 567 miRNAs that have met a set of criteria for annotation (Fromm et al. 2015). These criteria define a bona fide pre-miRNA as having: (1) Two 20- to 26-nt-long reads expressed from each of the two arms derived from a hairpin precursor with 2-nt offsets between the 5p and 3p arms, (2) 5′-end homogeneity of expression, (3) at least 16-nt complementarity between the two arm sequences, and (4) the loop sequence is at least 8 nt in length; the maximum length of the loop in species with single Dicer proteins is ∼40 nt (Fromm et al. 2015).
Our analysis revealed that many of the miRNAs annotated in miRBase, but not in MirGeneDB, were expressed at relatively low levels in wild-type cells or showed increased expression when DROSHA was knocked out. miRNAs annotated in MirGeneDB, by contrast, were more likely to be determined to physically associate with AGO2 than miRNAs annotated in miRBase. miRNAs annotated in MirGeneDB are also more likely to be among the miRNAs identified as DROSHA-dependent by Kim and colleagues (Kim et al. 2021). There may be some value in using miRBase to “cast a wide net,” but our analyses indicated that the individual members of the annotated collection of miRNAs in MirGeneDB are more likely to have expression levels conducive to biological activity and more likely to be processed through canonical DROSHA-mediated processing.
We acknowledge several limitations to our approach. Identification of “high priority” miRNAs will vary depending on cell type and environment. In some cell types, DROSHA-independent regulation is important (Cifuentes et al. 2010), and HCT116 cells may not be an optimal model for assessing that mechanism. We focus on the most abundant miRNAs and the miRNAs that are most associated with AGO2. While these miRNAs have the most potential to act as individual gene regulators, lowly expressed RNAs may also have a significant collective impact on the control of gene networks (Ambros 2019; Chen et al. 2019). HCT116 is a typical cell line in terms of miRNA expression (Ghandi et al. 2019), but we acknowledge that all cell lines differ. Researchers should prioritize the potential impact miRNAs in different cell lines or tissues have on a case-by-case basis.
Link between AGO abundance and global pool of miRNAs
Absolute quantification of AGO proteins demonstrated that AGO2 is the most abundant, followed by AGO1, and then AGO3 (Fig. 4). We observed a compensatory effect for the remaining AGO proteins with enhanced AGO1, AGO2, and/or AGO3 expression to attempt to maintain the total cellular levels of AGO protein in the different AGO knockout cell lines. In support of this, we observed a modest decrease in global miRNA reads in single AGO1 and AGO2 knockout cells, a larger decrease in the AGO1/2 double knockout cells, and the greatest decrease in the AGO1/2/3 triple knockout cell line. We observed a 50% reduction in global miRNAs in the AGO1/2/3 knockout cell line. This finding supports previous studies showing that ablation of AGO2 has been linked to significant down-regulation of global miRNAs in blood and the brain (O'Carroll et al. 2007; Schaefer et al. 2010) and that loss of AGO1 and AGO2 in human melanoma cells leads to an 80% reduction in global miRNAs (Wang et al. 2012).
Do AGO variants differ in their association with miRNAs?
We also evaluated the association of miRNAs with AGO1–4. There are four AGO variants in human cells. AGO2, and to a lesser extent AGO3, can cleave target RNA when the small RNA guide and target RNA form a perfect complementary match and elicit a conformational change for catalytic activity (Wang et al. 2008; Park et al. 2017). AGO2's slicer activity has been demonstrated to be important for endogenous siRNA biogenesis in oocytes and embryonic stem cells (Babiarz et al. 2008; Tam et al. 2008; Watanabe et al. 2008), miR-451 biogenesis in blood (Cifuentes et al. 2010), rare mRNA cleavage by miRNAs (Karginov et al. 2010), and precursor cleavage in U2OS and 293 cells (Diederichs and Haber 2007). That ability to cleave RNA with higher efficiency sets AGO2 apart from the other AGO proteins, but variation in binding to miRNAs among the four paralogs was less well known.
When we compared the profile of miRNAs associated with each of the endogenous AGO proteins, we observed consistent overlap in the miRNA species after immunoprecipitation with anti-AGO antibodies (Fig. 6C). These results support previous findings that pulled down (1) tagged AGO1–4 in HEK293 cells (Hafner et al. 2010), (2) endogenous AGO1–3 proteins in AGO1, AGO2, and AGO1/2 knockout human melanoma cells (Wang et al. 2012), and (3) endogenous AGO1–4 proteins in HeLaS3 cells (Dueck et al. 2012) and showed that overall miRNAs distribute randomly among the individual AGO proteins according to their relative protein abundance.
We have evaluated the impact of DROSHA, TNRC6, and AGO expression on levels of miRNAs. Knockout of the key biogenesis factor DROSHA helps prioritize miRNAs that have the potential to be involved in biological regulation. Knockout of the TNRC6 paralogs had little effect on miRNA levels, consistent with the role of TNRC6 as a scaffolding protein that organizes regulatory proteins but does not come into direct contact with miRNAs. Quantitative analysis of protein expression reveals that knocking out AGO1 and AGO2 leads to compensatory up-regulation of AGO3. Knocking out AGO1, AGO2, and AGO3 reduces the cellular pool of miRNAs with the greatest effect observed for the miRNAs physically associated with AGO proteins. The 60 miRNAs identified in our analysis as the most likely candidates for biological regulation bind all four AGO proteins, suggesting that regulation may be maintained even in the absence of individual AGO paralogs. Our data explain why some miRNAs may be more likely than others to play measurable roles in regulating biological function than others and how core RNAi protein factors affect levels of active miRNAs.
Conclusions
Assigning a miRNA to the control of specific biological functions can be challenging. Orthogonal methods, both experimental and computational, can help prioritize candidate miRNAs for detailed analyses. We have used a panel of HCT116 knockout cell lines to examine the effect of knocking out AGO proteins, TNRC6 variants, and DROSHA on miRNA expression and the distribution of miRNAs associated with different AGO variants. The loss of TNRC6 results in minimal changes to miRNA profiles, consistent with the lack of a direct interaction between TNRC6 and miRNAs. Knocking out just a single AGO protein variant has relatively little effect on miRNA levels, suggesting compensation by the remaining AGO variants. Knocking out multiple AGO proteins reduces mature miRNA expression by 50%. The 60 most abundant miRNAs were similarly enriched for binding to all four AGO proteins.
MirGeneDB uses strong filters for enriching DROSHA-dependent miRNAs based on criteria that emphasize both of the 2-nt offsets left by sequential RNase III cleavages from DROSHA and DICER processing. We observe that the curated list of miRNAs on MirGeneDB overlapped with 98 out of 100 miRNAs that were abundant and most closely associated with AGO2 based on previous eCLIP experiments. The DROSHA knockout results in loss of expression of DROSHA-dependent miRNAs that had been previously determined using experimental methods (Kim et al. 2021). These complementary approaches identify a consistent subset of miRNAs and will help prioritize miRNAs for the experimental validation necessary to investigate biological function.
MATERIALS AND METHODS
Cell culture
Wild-type HCT116 cells were obtained from ATCC. HCT116 cells containing knockout modifications to the DROSHA, TNRC6A, TNRC6B, and TNRC6A and TNRCB genes were purchased from GenScript. All cell lines were cultured in McCoy's 5A medium (Sigma-Aldrich) supplemented with 10% FBS (Sigma-Aldrich) in 37°C 5% CO2.
Transfections
All transfections used Lipofectamine RNAi MAX (Invitrogen). For transfections, cells were seeded into six-well plates at 150,000 cells per well for wild-type, TNRC6A−/−, and TNRC6B−/−. TNRC6AB−/− cells were seeded at 250,000 cells per well due to the slowed growth rate of these cells. Cells were transfected with siGL2 as a negative control and a siRNA pool targeting TNRC6C as described in Liu et al. (2019).
RNA extraction and small-RNA-seq
Whole cell RNA was extracted from cells with TRIzol at 80% confluency. This whole cell RNA was submitted to the UTSW Genomics Sequencing Core for small-RNA-sequencing (also referred to as microRNA-sequencing). The miRNA libraries were prepared using Illumina TruSeq Small RNA Library Preparation Kits (catalog # RS-200-0012, RS-200-0024). Protocol from TruSeq Small RNA Library Prep Reference Guide (Document # 15004197 v02, July 2016) was followed. The total RNA quality was checked with Bioanalyzer (Agilent, RNA 6000 Nano Kit, 5067-1511). Small RNA library preparation started with 1 μg high-quality total RNA. First, the small RNAs were ligated with 3′ Adapter and then ligated with 5′ Adapter. Reverse transcription followed by amplification creates cDNA constructs based on the small RNA ligated with 3′ and 5′ adapters. Then libraries were cleaned with Agencourt AMPure beads (Beckman Coulter, catalog # A63882). Then the concentration of the remaining clean RNA was measured by Picogreen (Fisher Scientific, Quant-iT PicoGreen dsDNA Assay Kit, P7589). Equal amounts were pooled from each library. Then the library pool was further purified using the Pippin Prep system (Sage Science) with 3% agarose gel cassettes (Sage Science, CDP3010). The final library pool quality was checked with Bioanalyzer (Agilent, High Sensitivity DNA Kit, 5067-4626) and qPCR (Kapa Library Quantification Kit, 7960336001). Pooled libraries were sequenced on NextSeq v2.5 High Output flow cells as single end 50 cycle runs, the yield per library was between 6.9 and 16.3 million pass filter reads, with a mean quality score of 34.6 and a % ≥ Q30 of 95.8% bases. Cutadapt trimmed read lengths were between 25 and 40 bases, mapping reference was mature and hairpin miRNA sequences from GRCh37. The same library preparation methods were used for all samples to obtain both hairpin and mature reads. The data were generated by trimmed mean of M-values method (TMM) normalized counts (Robinson and Oshlack 2010; Tam et al. 2015) that aligned with miRNA precursors or mature miRNAs. The data were part of the package generated by edgeR.
Argonaute protein-associated miRNA immunoprecipitation
HCT116 WT and AGO KO cells were grown in 150 mm2 dishes in McCoy medium with 10% FBS. Cytoplasmic and nuclear fractions were isolated and lysed by whole cell lysis buffer (50 mM Tris–HCl [pH 7.4], 120 mM NaCl, 2 mM MgCl2, and 0.5% NP-40, 1 mM DTT) with proteinase inhibitor and RNase inhibitor and Roche protease inhibitors cocktail, RNase inhibitor (50 U/mL final). Protein A/G agarose beads were briefly washed with corresponding lysis buffer before use. One hundred milligrams of lysate protein from WT and AGOs KO cell lines were precleared by binding with 100 µL blank protein A/G agarose beads in 500 µL volume for 1 h at 4°C. One hundred microliters of protein A/G agarose beads were incubated with 5 mg of anti-AGO1 (WAKO Chemical, #015-22411), anti-AGO2 antibody (3148, gift from Jay A. Nelson laboratory) or pan antibody (Sigma, MABE56) in 0.5 mL at 4°C with gentle agitation for 2 h. After spin, the precleared protein supernatant was transferred into the antibody binding tube and rotated ON at 4°C. After washing with lysis buffer (three times), the beads were then treated with elution buffer (1% SDS, 0.1 M NaHCO3, and RNase inhibitor). Following proteinase K treatment, RNA was extracted by phenol:chloroform, precipitated by ethanol. RNA pellet was dissolved by nuclease-free water and sent for miRNA-sequencing to the Genomics Sequencing Core Facility at UTSW.
Absolute Argonaute protein quantification
Recombinant AGO (AGO1, AGO2, and AGO3) protein was purchased from Active Motif (AGO1 catalog # 31522, AGP2 catalog # 31886, and AGO3 catalog # 31523). The protein concentration of each recombinant Argonaute stock was confirmed by BCA Assay (Thermo Scientific, catalog # 23225). Recombinant Argonaute protein was serially diluted and used to construct a standard curve for western blot analysis. Serial dilutions were performed in Protein LoBind tubes (Eppendorf) coated with Bovine Serum Albumin Standard protein (Thermo Scientific, 2 mg/mL) to prevent protein loss. Western blot images were exposed on film and analyzed with ImageJ to construct a standard curve plotting Western signal vs recombinant protein concentration. The slope of this line was used to determine the Argonaute proteins per cell in whole cell lysate from WT, AGO1−/−, AGO2−/−, and AGO1/2−/− HCT116 cells. Whole cell lysis buffer contains 50 mM Tris pH 7.0, 120 mM NaCl, 0.5% NP-40, 1 mM EDTA, and 1 mM DTT.
Stem–loop RT-qPCR analysis of mature miRNA expression
Cells were disassociated and counted with Trypan blue as described above. Total RNA was extracted from HCT116 wild-type cells and treated with DNase I (Worthington Biochemical) at 25°C for 20 min, 75°C for 10 min. Reverse transcription was performed using a MicroRNA High-Capacity Reverse Transcription Kit (Applied Biosystems) per the manufacturer's protocol. PCR was performed on a 7500 real-time PCR system (Applied Biosystems) using TaqMan Universal PCR Master Mix No AmpErase UNG (Applied Biosystems) with the primers and probes included in the TaqMan microRNA Assay Kits (hsa-miR-29a-3p: Assay ID: 002112; hsa-miR-125b-5p: Assay ID: 000449; and hsa-miR-27a-3p: Assay ID: 000408). PCR reactions were done in duplicate technical replicates for three biological replicates at 55°C 2 min, 95°C 3 min and 95°C 30 sec, 60°C 30 sec for 40 cycles in an optical 96-well plate. The relative fold gene expression was calculated based on average CT values in RNA isolated from DROSHA−/− HCT116 relative to WT HCT116.
Mass spectrometry
In solution, fractionation mass spectrometry (MS) was used to estimate the number of protein copies per cell based on the method described in Liu et al. (2019). Cells were harvested and lysed in 600 µL solution containing 4% SDS, 100 mM Tris/HCl pH 7.6, and 0.1 M DTT. The lysate was incubated at 95°C for 5 min and then sonicated (20% power, 20 sec, 2 pulses). The lysate was clarified by centrifugation at 16,000g at room temperature for 5 min. Then 200 µL of cell lysate was prepared using the filter-aided sample preparation method. An Ultracel-10K (UFC501024; Millipore) filter was used for protein purification and trypsin digestion.
Mass spectrometry of the trypsinized peptides was performed by UT Southwestern proteomic core. An Ultimate 3000 RSLC nano-LC (Thermo Fisher Scientific) in-line connected to an Orbitrap Fusion Lumos (Thermo Fisher Scientific) was used for MS analysis. In brief, the sample was fractionated into 10 injections and peptides were loaded onto a reverse-phase column (Easy Spray column, either 75 µm × 50 cm or 75 µm × 75 cm, 2 µ beads). Raw files were processed using MaxQuant and used the latest human database from Uniprot. We then used the label-free quantization (LFQ, normalized intensity) data and histone signal to calculate the number of protein copies per cell.
Statement about statistical tests
Differential analysis of small-RNA-seq expression changes was performed using the edgeR package based on TMM normalized reads to generate fold-change and adjusted P-values. Pearson correlation values and two-tailed P-values were calculated for correlations on GraphPad Prism 9.1.2.
DATA DEPOSITION
The data discussed in this publication have been deposited in NCBI's Gene Expression Omnibus (Edgar et al. 2002) and are accessible through GEO Series accession number GSE214157 (https://www.ncbi.nlm.nih.gov/geo/query/acc.cgi?acc=GSE214157) and GSE214235 (https://www.ncbi.nlm.nih.gov/geo/query/acc.cgi?acc=GSE214235). Small-RNA-seq of miRNAs from Argonaute1–4 immunoprecipitation can be accessed at GSE214157, and small-RNA-seq of whole cell miRNAs detected in the different RNAi factor knockout cell lines can be accessed at GSE214235.
SUPPLEMENTAL MATERIAL
Supplemental material is available for this article.
ACKNOWLEDGMENTS
This study was supported by F31GM137591 (K.C.J.), 5R01CA258584-0 (T.W.), and R35GM118103 (D.R.C.) from the National Institutes of Health and the Robert A. Welch Foundation I-1244 (D.R.C.). The authors thank the UTSW Genomics Sequencing Core for microRNA-seq library preparation, sequencing, and data analysis.
Author contributions: K.C.J., S.T.J., and J.L. performed and analyzed experiments. C.A. and Y.C. performed sequencing analysis, and C.A., Y.C., Y.H., and T.W. advised on proper sequencing analysis methods. K.C.J. and D.R.C. prepared the manuscript. D.R.C. supervised the study.
Footnotes
-
Article is online at http://www.rnajournal.org/cgi/doi/10.1261/rna.079647.123.
-
Freely available online through the RNA Open Access option.
- Received March 27, 2023.
- Accepted April 21, 2023.
This article, published in RNA, is available under a Creative Commons License (Attribution-NonCommercial 4.0 International), as described at http://creativecommons.org/licenses/by-nc/4.0/.
REFERENCES
MEET THE FIRST AUTHOR

Meet the First Author(s) is an editorial feature within RNA, in which the first author(s) of research-based papers in each issue have the opportunity to introduce themselves and their work to readers of RNA and the RNA research community. Krystal Johnson is the first author of this paper, “Consequences of depleting TNRC6, AGO, and DROSHA proteins on expression of microRNAs.” Krystal is a graduate student in David R. Corey's laboratory in the Departments of Pharmacology and Biochemistry at UT Southwestern Medical Center studying microRNAs, Argonaute proteins, and their potential for RNA therapeutics.
What are the major results described in your paper and how do they impact this branch of the field?
This paper provides a systemic evaluation of the effects of depleting microRNA biogenesis and microRNA effector proteins on microRNA expression. Our ultimate goal was to refine a subset of abundant microRNAs that are DROSHA-dependent, associated with Argonaute proteins, and most likely to carry out robust gene regulation in a widely used cell line, HCT116.
What led you to study RNA or this aspect of RNA science?
RNA is the most incredible molecule. It can carry and recognize information, fold and engage in extraordinary structures, and even catalyze reactions. I am repeatedly astonished by new insights into the ways that nature harnesses these chemical properties of RNA molecules to engage in intricate and fascinating regulatory networks. The Human Genome Project revealed the massive role that noncoding RNAs play in our complex cellular lives, and I happily fell down the rabbit hole of exploring a small but mighty subset of these noncoding RNAs known as microRNAs. microRNAs are loaded into Argonaute proteins, and then these complexes embark on a cellular odyssey to find their sequence-specific targets to regulate networks of genes ensuring that the right proteins are expressed at the right time. Fundamental knowledge of these molecules has rapidly expanded over the past 30 years and is critical in unlocking the revolutionary new frontier of RNA therapeutics to treat diseases that were previously considered impossible to target and yet are now a reality.
What are some of the landmark moments that provoked your interest in science or your development as a scientist?
One of the biggest lessons in my development as a scientist was learning how to let go of perfection. Real science is tangled and messy, and the only way forward is to keep showing up, have an open mind, and let go of trying to control the outcome or rate of progress. Each experiment, failure or success, is important even if you can't see it right now.
If you were able to give one piece of advice to your younger self, what would that be?
Being stubborn and persistent are some of your greatest strengths. Don't let comparison or self-doubt distract you, because this is your journey and only you can seize it.
Are there specific individuals or groups who have influenced your philosophy or approach to science?
David Corey introduced me to the powerful, complex world of RNAi seven years ago when I was just an undergraduate summer research fellow in his lab. His strong mentorship and pursuit of interesting projects have trained my approach to science and won me over to choose his laboratory for my PhD. I was also lucky to overlap with a talented post-doc, Audrius Kilikevicius, while working in the Corey lab. He inspired me to read more to brainstorm better, fail fast to succeed faster, and be prepared to defend my ideas even when they don't align with popular opinion. I am also grateful to my rockstar thesis committee, collaborators, and laboratory mates who fill in the holes of logic or mechanism that I may have missed, encourage me to keep going forward, and help me pull on the different threads of observations until something unravels.
What are your subsequent near- or long-term career plans?
I will graduate in the fall of this year, and I plan to pursue a post-doc. I was born and raised in Texas, did my undergraduate studies at UT Austin, and chose UT Southwestern for my graduate research, so I am eager to embark on a new adventure and explore science in one of the research hubs on the East or West coast. My ultimate dream is to contribute to unlocking the full potential of RNA therapeutics to cure diseases.




