


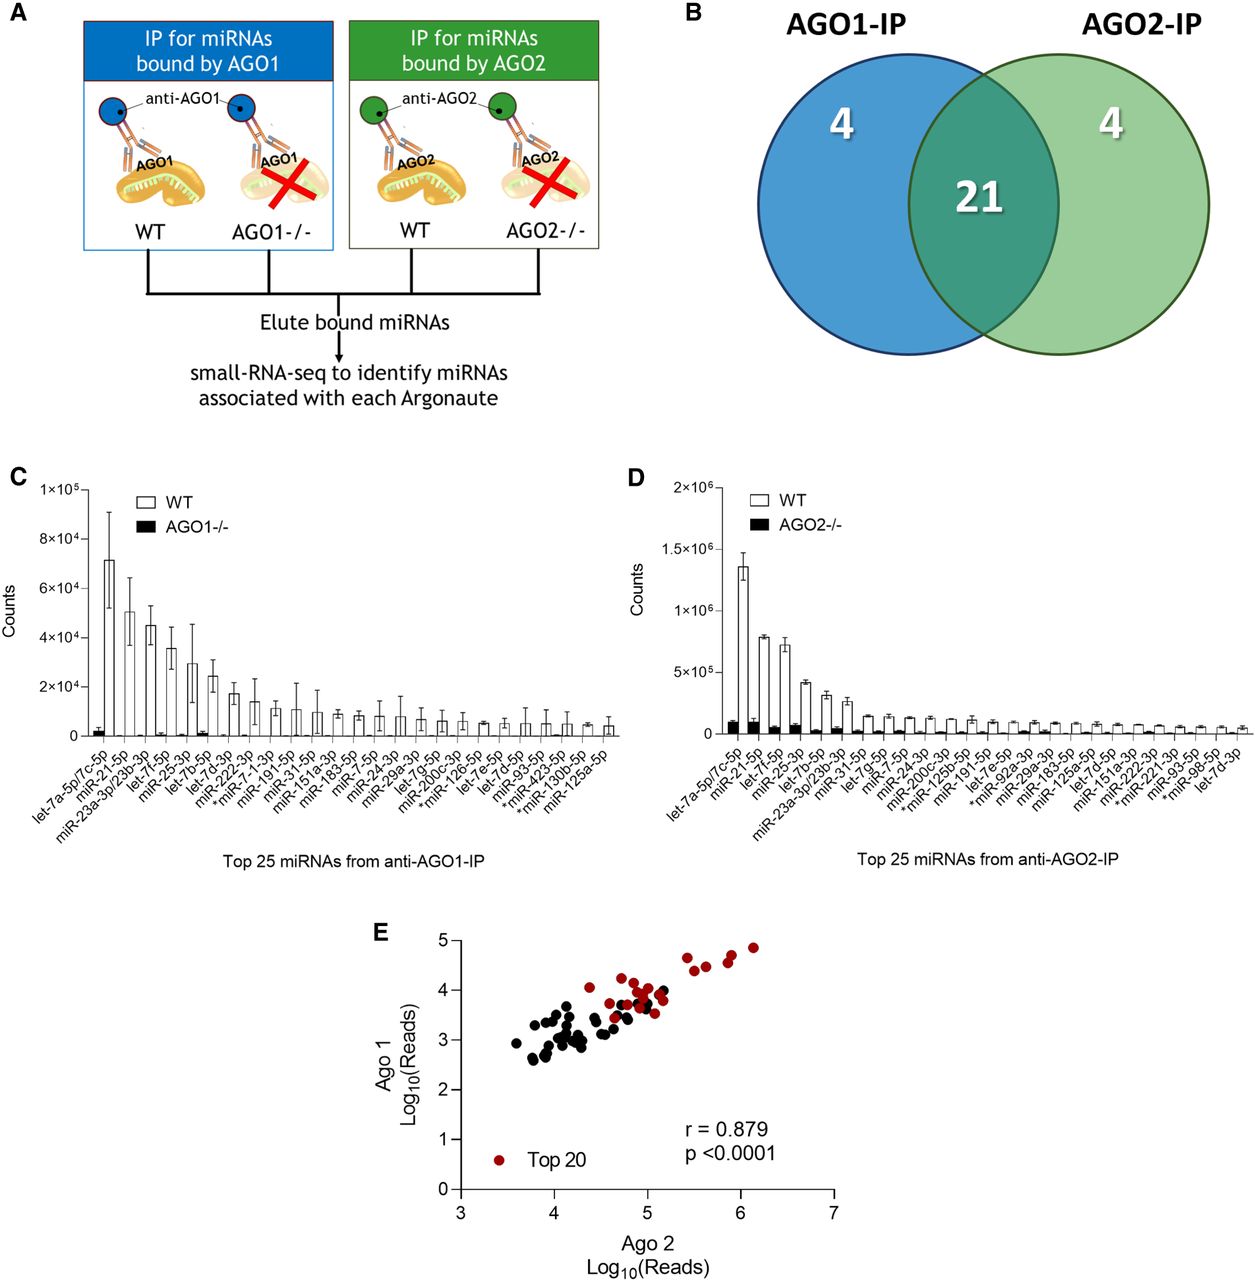
Similar abundant miRNAs found associated with AGO1 and AGO2. (A) Parallel AGO-immunoprecipitations in WT HCT116, AGO1−/−, and AGO2−/− cells. (B) Venn diagram showing the overlap between the top 25 miRNA by counts in the AGO1 and AGO2 pull-downs in the WT cell lines (circles not drawn to scale). (C,D) Chart showing the top 25 miRNA by counts in the (C) 2A7 Ago1 antibody pull-down in the WT and AGO1−/− cell lines and in the (D) 3148 anti-AGO2 antibody pull-down in the WT and AGO2−/− cell lines. miRNAs indicated with a (*) are the four miRNAs that did not overlap in both pull-downs from (B). (E) Pearson correlation plot of miRNA reads for the top 60 miRNAs in the AGO2 and AGO1 protein pull-down in WT. The top 20 miRNAs with the highest read count from the anti-pan-AGO antibody 2A8 pull-down are highlighted in red.




