


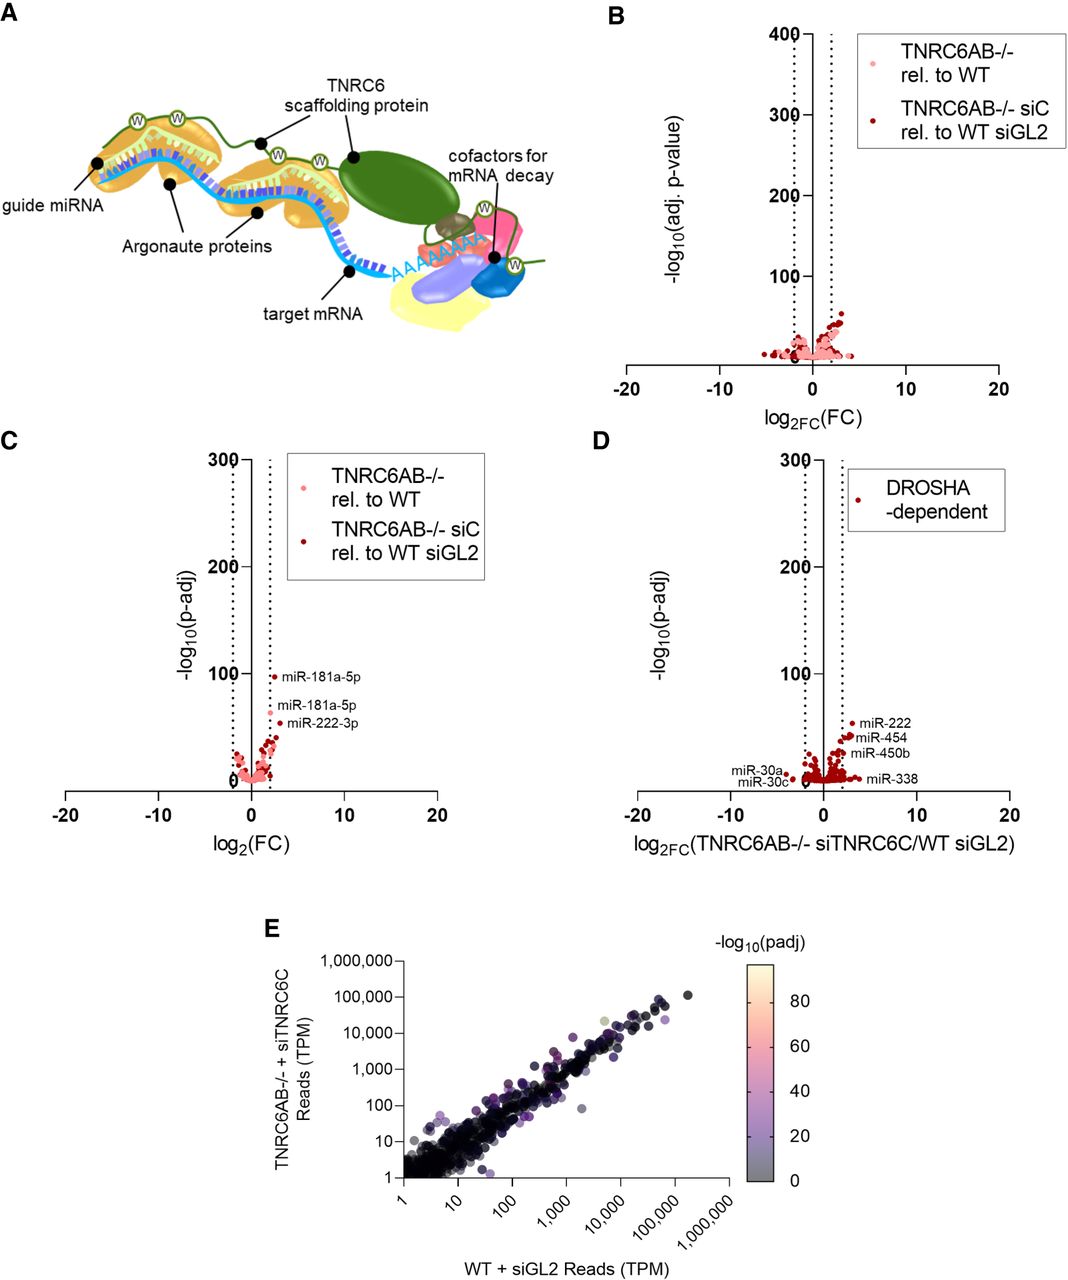
Effect of loss of TNRC6 paralogs on mature miRNA expression. (A) Scheme showing interactions of TNRC6 protein during miRNA-mediated silencing. Tryptophan residues on the TNRC6 protein are indicated as “W” in a circle. (B) Volcano plot of global differential miRNA expression of miRNAs annotated on MirGeneDB from small-RNA-seq in TNRC6AB−/− relative to WT (pink) and TNRC6AB−/− + siTNRC6C cells relative to WT HCT116 transfected with siGL2 negative control (red). (All sequencing performed in three biological replicates. Differential expression and significance [P-adj] calculated with edgeR, and dotted lines represent two log2 fold-change. Read cutoff of 1 TPM for all displayed miRNAs.) (C) Volcano plot of differential miRNA expression from small-RNA-seq in TNRC6AB−/− relative to WT and TNRC6AB−/− + siTNRC6C (pink) cells relative to WT HCT116 transfected with siGL2 negative control (red) showing only the top 100 miRNAs associated with AGO2 from AGO2-eCLIP from HCT116. (D) Volcano plot where red dots represent differential expression of miRNAs that were reported as Drosha-dependent (Kim et al. 2021) in TNRC6AB−/− HCT116 transfected with siTNRC6C relative to WT HCT116 transfected with siGL2 negative control. (E) TPM for all miRBase miRNAs with expression levels above the read cutoff of 1 TPM in WT transfected with siGL2 negative control and TNRC6AB−/− transfected with siTNRC6C. The color of each point represents significance, −log10 adjusted P-value.




