


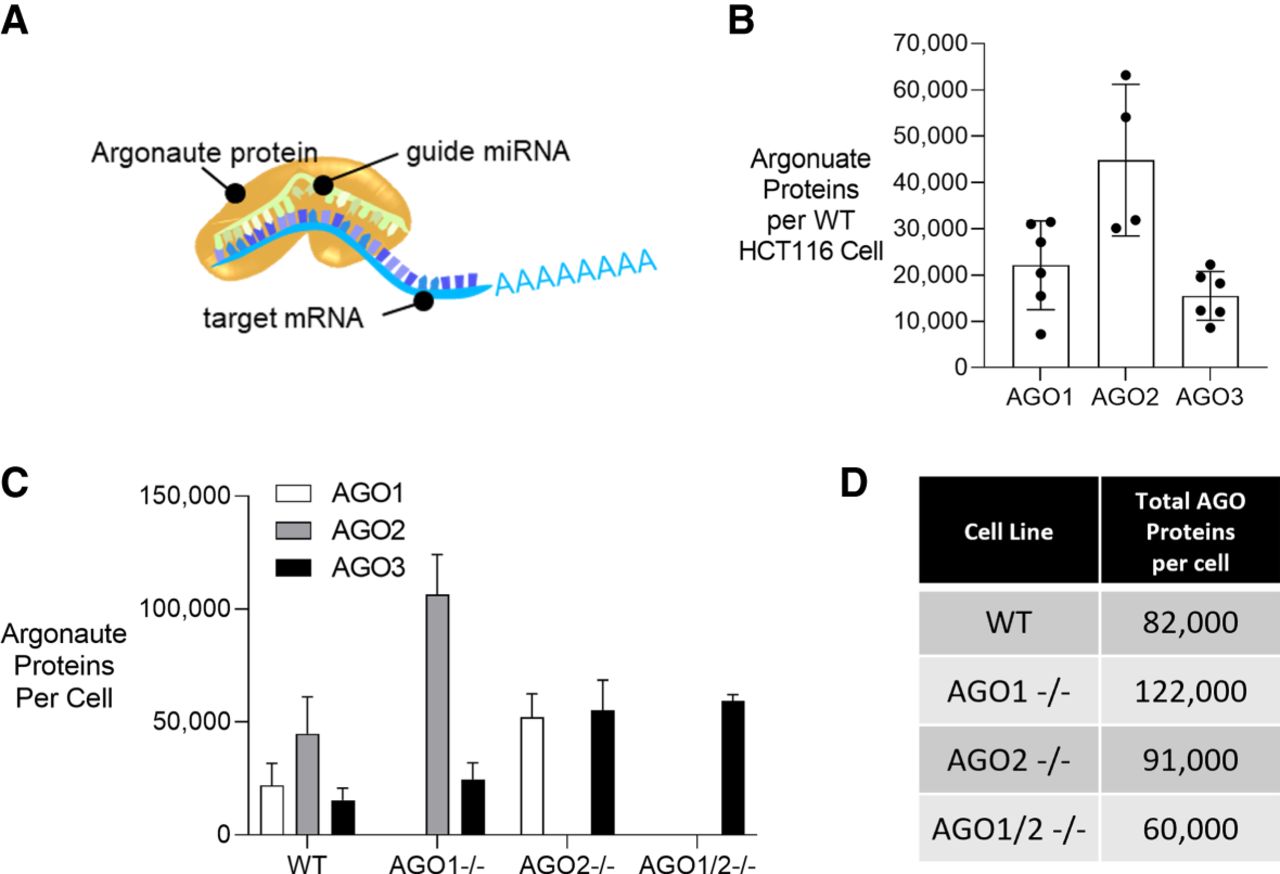
Absolute quantification of AGO proteins per cell shows compensation of remaining paralogs after AGO depletion. (A) Scheme showing AGO protein loaded with a microRNA guide strand that is engaged with a target mRNA. (B) Absolute quantification of AGO1, AGO2, and AGO3 protein molecules per WT HCT116 cell based on recombinant Western standard curve titration of recombinant AGO1, AGO2, and AGO3 compared to cell lysate from WT HCT116. Cells were counted prior to lysis to estimate protein number per cell. (C) Graph showing absolute quantification of AGO1, AGO2, and AGO3 protein molecules per cell in HCT116 WT, AGO1−/−, AGO1/2−/− cells from Western standard curve analysis. (D) Table of AGO1, AGO2, and AGO3 protein molecules per cell in WT, AGO1−/−, AGO2−/−, and AGO1/2−/− HCT116 cells.




