


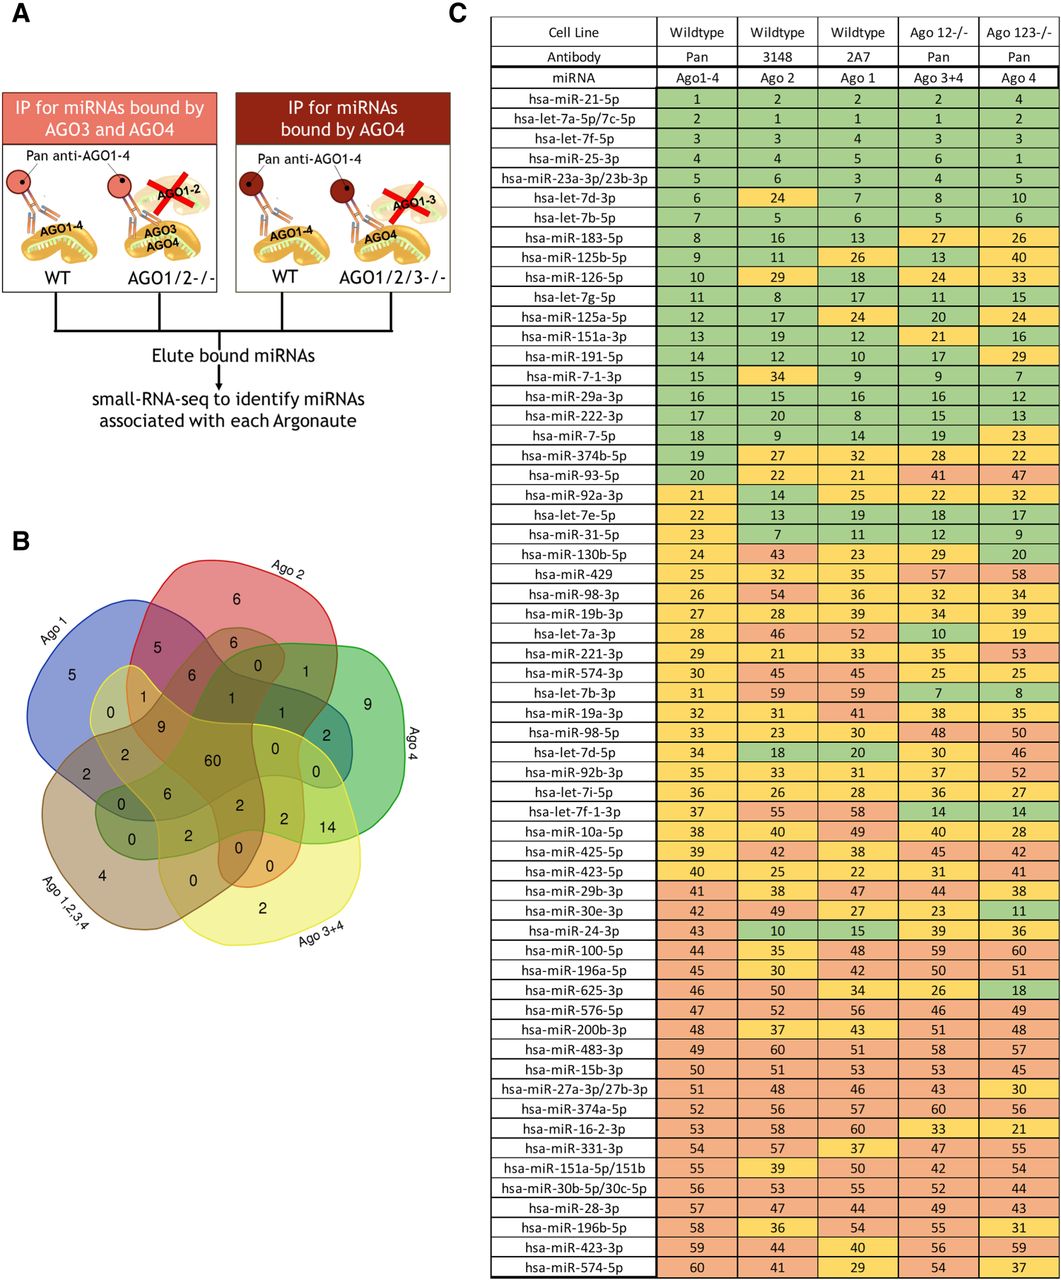
Similar abundant miRNAs found associated with all AGO proteins. (A) Experimental scheme for parallel AGO-immunoprecipitations in WT HCT116, AGO1/2−/−, and AGO1/2/3−/− cells. (B) Venn diagram of the top 100 miRNA by counts from AGO1, AGO2, and the Pan argonaute antibody pull-downs in the various cell lines (WT = AGO 1,2,3,4; AGO12−/− = Ago 3,4; AGO123−/− = Ago 4). (C) Table showing where the overlapping 60 top miRNAs (from B) are ranked in each pull-down, using the Ago1–4 pull-down in the WT as a reference. The green (top 20), yellow (middle 20), and orange (bottom 20) show the ranking of the 60 overlapping miRNAs immunoprecipitated in comparison to a previously published AGO2-eCLIP-sequencing data set (Chu et al. 2020).




