


mRNA isoform diversity can obscure detection of miRNA-mediated control of translation
- Jennifer L. Clancy1,
- Grace H. Wei1,
- Nicole Echner1,4,
- David T. Humphreys1,
- Traude H. Beilharz3 and
- Thomas Preiss1,2
- 1Molecular Genetics Division, Victor Chang Cardiac Research Institute, Darlinghurst, NSW 2010, Australia
- 2School of Biotechnology and Biomolecular Sciences and St. Vincent's Clinical School, University of New South Wales, Sydney, NSW 2052, Australia
- 3Department of Biochemistry and Molecular Biology, Monash University, Clayton, VIC 3800, Australia
Abstract
Reporter-based studies support inhibition of translation at the level of initiation as a substantial component of the miRNA mechanism, yet recent global analyses have suggested that they predominantly act through decreasing target mRNA stability. Cells commonly coexpress several processing isoforms of an mRNA, which may also differ in their regulatory untranslated regions (UTR). In particular, cancer cells are known to express high levels of short 3′ UTR isoforms that evade miRNA-mediated regulation, whereas longer 3′ UTRs predominate in nontransformed cells. To test whether mRNA isoform diversity can obscure detection of miRNA-mediated control at the level of translation, we assayed the responses of 11 endogenous let-7 targets to inactivation of this miRNA in HeLa cells, an intensively studied model system. We show that translational regulation in many cases appears to be modest when measuring the composite polysome profile of all extant isoforms of a given mRNA by density ultracentrifugation. In contrast, we saw clear effects at the level of translation initiation for multiple examples when selectively profiling mRNA isoforms carrying the 5′ or 3′ untranslated regions that were actually permissive to let-7 action, or when let-7 and a second targeting miRNA were jointly manipulated. Altogether, these results highlight a caveat to the mechanistic interpretation of data from global miRNA target analyses in transformed cells. Importantly, they reaffirm the importance of translational control as part of the miRNA mechanism in animal cells.
Keywords
INTRODUCTION
microRNAs (miRNAs) are small guide RNAs that recruit RNA-induced silencing complexes (RISC) to mRNAs, thus dampening their expression. A multitude of reporter construct studies on the miRNA mechanism in animal cells led to an emerging consensus that they repress translation at the initiation stage while also stimulating mRNA turnover (Eulalio et al. 2008; Liu 2008; Fabian et al. 2010; Jackson et al. 2010). Both effects can be accounted for by RISC affecting functions of the mRNA cap structure and poly(A) tail (Humphreys et al. 2005; Pillai et al. 2005; Mathonnet et al. 2007; Wakiyama et al. 2007; Fabian et al. 2009; Zdanowicz et al. 2009; James et al. 2010). A present challenge is to assess how these mechanistic features of miRNA action are integrated into the regulation of their endogenous mRNA targets, which may exist as alternatively processed isoforms (Sandberg et al. 2008) and recruit additional regulatory factors leading to combinatorial outcomes (Kim et al. 2009a).
Global approaches (proteomics, translation state, and ribosome profiling) have sought to identify the targets of miRNAs and also their effects on these targets (Baek et al. 2008; Selbach et al. 2008; Hendrickson et al. 2009; Guo et al. 2010). A surprising finding in several of these studies was that miRNAs appeared to predominantly decrease mRNA levels, with translational control accounting only for quantitatively minor effects. To address these apparently divergent findings, we present here an analysis of the response of 11 endogenous mRNA targets to inactivation of let-7 in HeLa cells, using qRT–PCR and polysome profiling. Analysis of processing isoforms of these mRNAs and combinatorial miRNA effects revealed that translational repression is commonly a prominent component of let-7 action.
RESULTS
Manipulation of let-7 activity by anti-miR transfection
We chose to inhibit let-7 action in HeLa cells by transfection with an anti-miR against let-7 or an anti-miR against the irrelevant miR-499 as a specificity control (Beilharz et al. 2009). We also cotransfected cells with the reporter R-luc-3xb (Fig. 1A, schematic), a positive control known to respond to let-7 through changes in mRNA stability and translation initiation (Pillai et al. 2005; Beilharz et al. 2009). To measure changes in mRNA translation we used density gradient ultracentrifugation of HeLa cell cytoplasmic extracts that were devoid of nuclear contamination and contained high amounts of intact polysomes, the levels of which did not change with anti-let-7 treatment (Fig. 1B; data not shown). Next, we measured by qRT–PCR the level of R-luc-3xb mRNA in the gradient fractions, as well as endogenous GAPDH mRNA and a spiked-in RNA for normalization purposes (see Supplemental Fig. S1 for details on experimental design and data processing). We observed a strong shift of R-luc-3xb mRNA into polysomal fractions after let-7 inhibition, indicating that let-7 acts to inhibit translation initiation of R-luc-3xb (Fig. 1C). Puromycin treatment confirmed bona fide ribosome association (Supplemental Fig. S2). Further, there was a mild increase in the R-luc-3xb mRNA level in the absence of let-7 (2.3-fold) (Table 1). These results replicate previously reported experiments (Pillai et al. 2005) and demonstrate that our manipulation of cellular let-7 levels elicits clear effects on translation initiation as revealed by shifts in R-luc-3xb mRNA polysome association.
Effect of let-7 inhibition on mRNA stabilization
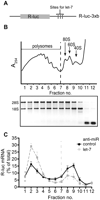
Manipulation of let-7 activity by anti-miR transfection. HeLa cell lysates were prepared 9 h after transfection with R-luc-3xB reporter and anti-miR against let-7 or control anti-miR, followed by density gradient ultracentrifugation and RNA analysis. (A) Schematic of the Renilla luciferase R-luc-3xB reporter. (B) Representative absorbance trace at 254 nm is shown at the top to locate positions of polysomes, ribosomes (80S), and subunits (60S, 40S). Gel analysis of gradient fraction RNA integrity is shown below. (C) Gradient distribution of R-luc-3xB mRNA after anti-let-7 (gray squares) or control anti-miR transfection (black circles) was measured by qRT–PCR. R-luc-3xB mRNA abundance in each fraction is expressed as a percentage of the total R-luc-3xB mRNA in the gradient (see Supplemental Fig. S1 for normalization strategy). Dotted line represents border between polysomal and subpolysomal complexes. Data are an average of three experiments, and bars represent standard error.
mRNA isoform diversity complicates measurement of translational control by let-7
Next, we chose a set of 11 endogenous let-7 target mRNAs (Fig. 2A) previously documented by proteomics (IGF2BP1, TMEM2, SLC25A24, GPR56, SPRYD4, RDH10) (Selbach et al. 2008) or other studies (HMGA2 [Lee and Dutta 2007], MYC [Kim et al. 2009a], NRAS, KRAS [Johnson et al. 2005], CCND1 [Schultz et al. 2008]). To measure effects on a composite of mRNA isoforms, analogous to previous genome-wide studies, we initially analyzed effects of let-7 on stability and translation of these mRNAs using qRT–PCR with primers designed to coding regions (see Supplemental Table S1). To this end, we performed multiple independent transfection and ultracentrifugation experiments featuring the controls outlined above for the R-luc-3xb reporter. We approximated the 8-h post-transfection time frame of the proteomics study (Selbach et al. 2008) with some variation (6–17 h) to optimize responses to let-7 inhibition for each target. Figure 2B shows profiles of target mRNAs with and without let-7 inhibition, while Table 1 summarizes changes in mRNA abundance. The data on SLC25A24, TMEM2, IGF2BP1, and HMGA2 mRNAs are consistent with regulation at both translation and stability. MYC, GPR56, and KRAS mRNAs presented with evidence only for translational control, while CCND1 and SPRYD4 were mildly stabilized by let-7 inhibition. Surprisingly, the endogenous NRAS and RDH10 mRNAs showed no responses at either level to let-7 inhibition and neither did a RDH10 3′ UTR reporter construct (Supplemental Fig. S3). This may indicate that NRAS and RDH10 respond only to high doses of let-7, as RDH10 was identified by a let-7 overexpression screen in HeLa cells (Selbach et al. 2008), and NRAS reportedly is a weak target of let-7 (Park et al. 2007). Another reason for a modest response to let-7 inhibition could be that the target mRNA is under the control of multiple miRNAs. We therefore explored the reported and predicted miRNAs targeting our cohort of mRNAs and found that several are likely to be targeted by other miRNAs expressed in HeLa cells at similar levels to let-7 (Fig. 2A; Supplemental Table 2). The MYC mRNA is a case in point, as its let-7 target site overlaps a miR-34a site (Fig. 3A), and both miRNAs are expressed at comparable levels in HeLa cells (Supplemental Table S2). We therefore measured MYC polysome profiles in extracts from cells transfected with anti-miRs targeting either miRNA or a combination of both. This revealed moderate translational regulation by each miRNA, but stronger regulation when both are inhibited (Fig. 3B). In summary, nine of 11 targets tested positive for regulation by let-7 in our survey, at least to some degree (two via mRNA stability, three via translation, and four via a combination of both).
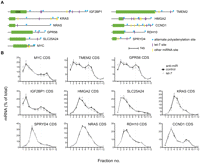
mRNA isoform diversity complicates measurement of translational control by let-7. HeLa cells were transfected with anti-miRs, harvested 6–17 h later, and lysates fractionated by gradient centrifugation as in Figure 1. (A) 3′ UTR configurations of the 11 experimentally verified let-7 target mRNAs under study. Alternative polyadenylation sites (blue triangles) were identified from Refseq, EST, and the PACdb (Brockman et al. 2005) databases (see Supplemental Materials and Methods). Let-7 target sites (purple lines) were as predicted by Targetscan (Friedman et al. 2009) and other sources (MYC, Kong et al. 2008; GPR56, Selbach et al. 2008; HMGA2, Lee and Dutta 2007; IGF2BP1, Mayr and Bartel 2009). Also shown are binding sites for miRNAs expressed at the level of ≥10% that are seen for let-7 in HeLa cells (determined by small RNA-Seq; yellow lines). Binding sites for these miRNA were derived from published studies and Targetscan predictions (details in Supplemental Table S2). (B) Gradient distribution of let-7 target mRNAs after transfection anti-let-7 (gray squares) or control anti-miR (black circles). All qRT–PCR measurements used primers designed against coding regions. Profiles are the averages of four to nine independent experiments (bars represent standard error). An exception is KRAS, which is an average of three independent experiments (6–9 h after anti-miR transfection).
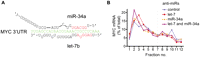
Combined inhibition of let-7 and miR-34a reveals greater translational regulation of MYC mRNA. (A) Schematic of binding sites for miR-34a and let-7 in the MYC 3′ UTR (Kong et al. 2008; Kim et al. 2009a). Red sequence denotes miRNA seed regions, green denotes UTR. (B) Gradient distribution of MYC mRNA by coding-region-focused qRT–PCR, 17 h after transfection with anti-miRs against let-7 (red squares), miR-34a (orange triangles), both (purple diamonds), or a control (blue circles). Data shown are representative of two independent experiments.
Analysis of long 3′ UTR mRNA isoforms reveals stronger let-7-mediated translational repression
Frequent use of alternate 3′ processing sites is known to either expose or withdraw mRNAs from the effects of miRNAs (Sandberg et al. 2008; Mayr and Bartel 2009), and EST database analyses support the existence of multiple 3′ UTR isoforms for our let-7 target set (Fig. 2A; see Supplemental Methods). Given the use of coding region-focused qRT–PCR, the profiles in Figure 2B may each represent the composite behavior of several mRNA isoforms, some lacking let-7 target sites, thus explaining apparently modest regulation. To address this, we performed qRT–PCR assays specific to the long 3′ UTR isoforms of HMGA2, IGF2BP1, TMEM2, KRAS, and SLC25A24. This did not uncover additional let-7 regulation for KRAS and SLC25A24 either at translation or stability (Table 1; data not shown), suggesting that these mRNAs mostly retain long 3′ UTRs in HeLa cells. In contrast, qRT–PCR of the long 3′ UTR isoforms of IGF2BP1, TMEM2, and HMGA2 did reveal greater translational regulation than the corresponding composite mRNA measurement (Fig. 4B), although only a mild increase was observed for HMGA2 (which has a relatively small ORF). While IGF2BP1 and TMEM2 showed no evidence of increased mRNA stability effects in this comparison, there was a tendency for the long 3′ UTR isoform of HMGA2 to be more stabilized by the inhibition of let-7 than a composite of its mRNA isoforms 9 h post-transfection (Table 1), which reached significance by 17 h (Fig. 4C). To directly distinguish let-7 effects on individual mRNA isoforms, we used measurement of poly(A) tail length by the LM–PAT assay, which we previously used to detect let-7-dependent deadenylation of the long 3′ UTR isoform of HMGA2 (Beilharz et al. 2009). We established LM–PAT assays for the IGF2BP1 3′ UTR isoforms ending at positions 2416 and 8769 (Fig. 2B; none or five predicted let-7 sites, respectively). poly(A) tails were of intermediate length and invariant with treatment for the shorter 3′ UTR. The longer IGF2BP1 3′ UTR isoform had short tails when let-7 was active, which gained in length after let-7 inhibition (Fig. 4B), demonstrating that the long isoform selectively responded to let-7. Additionally, we also identified another alternative polyadenylation site in IGF2BP1 (cleavage at site 3779) used in HeLa cells (see Supplemental Fig. 4; Supplemental Materials and Methods). Collectively, these data show that HeLa cells coexpress 3′ UTR isoforms for several mRNAs in our let-7 target set. Importantly, for three of five cases tested, analysis of the appropriate longer 3′ UTR isoforms revealed a stronger let-7-dependent translational regulation.
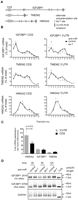
Analysis of long 3′ UTR isoforms reveals stronger regulation of translation initiation by let-7. (A) Schematic of IGF2BP1, TMEM2, and HMGA2 3′ UTRs showing let-7 binding sites (lines), alternative polyadenylation sites (triangles), and long 3′ UTR isoforms PCR amplicons (open black box). (B) Gradient distribution of let-7 target mRNAs IGF2BP1, TMEM2, and HMGA2 after transfection anti-let-7 (gray squares) or control anti-miR (black circles). Profiles are averages of four to nine independent experiments (bars represent standard error) and were generated either with coding regions primers as in Figure 2 (left) or with primers selective to the longest 3′ UTR isoform of each mRNA (right). (C) Stabilization of long 3′ UTR isoforms by let-7 17 h after anti-miR transfection. This panel shows the fold stabilization of HMGA2, IGF2BP1, and TMEM2 measured using coding-region primers or primers in the 3′ UTR. Bars represent standard error of three to five independent experiments. (D) Poly(A) tail lengths of two 3′ UTR isoforms of IGF2BP1 mRNA (cleavage sites at 2416 and 8769, see Fig. 2A) were measured by LM–PAT assay 6, 9, and 12 h after anti-miR transfection. GAPDH mRNA is shown as an invariant control; TVN is a marker for ∼12 nt of poly(A) tail.
Let-7 differentially regulates 5′ UTR isoforms of GPR56 mRNA
GPR56 mRNA is known to exist as multiple isoforms (Kim et al. 2009b), some of which carry alternative 5′ UTRs that may impart different basal translation efficiencies, thus affecting regulation by let-7. Therefore, we used qRT–PCR analyses specific for two GPR56 5′ isoforms differing in the number of potentially inhibitory upstream open reading frames (uORFs) (Fig. 5A; Calvo et al. 2009). Results in control cells indeed showed that polysome association is strong for isoform 1 (one uORF) and weak for isoform 2 (three uORFs). Let-7 inhibition led to a further clear mobilization of isoform 1 into polysomes, consistent with regulation at translation initiation, but had no effect on sedimentation of isoform 2 (Fig. 5B). A plausible explanation for the latter observation is that relief from let-7 inhibition was unable to overcome the repressive effects of the 5′ UTR of isoform 2. In conclusion, clear translational regulation of GPR56 mRNA by let-7 was seen when the appropriate 5′ UTR isoform was studied.
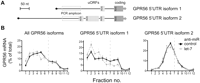
Analysis of GPR56 5′ UTR isoforms reveals regulation of translation initiation by let-7. (A) Schematic of alternate 5′ UTRs of GPR56 mRNA with positions of putative upstream open reading frames (uORFs) boxed in light gray and isoform-specific amplicons in open gray boxes. (B) Gradient distribution of GPR56 mRNA after transfection with anti-let-7 (gray squares) or control anti-miR (black circles). Profiles are averages of four independent experiments (bars represent standard error), either with coding regions primers as in Figure 2 (left) or primers specific to GPR56 5′ UTR isoform 1 (middle) and isoform 2 (right), respectively.
DISCUSSION
We demonstrated here that regulation of translation is a common component of let-7 action on its endogenous mRNA targets in a human cell line expressing physiological levels of let-7 (detected in seven of 11 examples). Key observations were that apparent translational activation following let-7 inhibition can be modest if a target mRNA is under the control of another miRNA (MYC and miR-34a) (Fig. 3), or when responses are measured as a composite of several extant cellular mRNA isoforms, some of which evade regulation by let-7 (5′ or 3′ UTR isoforms of IGF2BP1, HMGA2, TMEM2, and GPR56) (Figs. 4, 5).
The expression of the majority of mammalian genes produces multiple mRNA isoforms carrying variant 5′ and 3′ UTRs, either through alternative promoter (Jacox et al. 2010) or mRNA 3′ end cleavage and polyadenylation site usage (Andreassi and Riccio 2009). Shorter 3′ UTR isoforms lacking miRNA-binding sites are known to be particularly prevalent in highly proliferative or cancerous cells (Sandberg et al. 2008; Mayr and Bartel 2009). All this is likely to complicate transcriptome-wide measurements of translation state such as next-generation sequencing-based ribosome profiling (Guo et al. 2010) and microarray-based polysome profiling methods (Hendrickson et al. 2009), as these methods detect mRNA isoforms as one composite pool (similar to coding region-focused qRT–PCR) (Fig. 2). Since these studies assessed miRNA effects in transformed cell lines, they are therefore likely to underestimate the contribution of translational control. There is no conceptual impediment to the use of proteomics and transcriptome profiling by microarray (Baek et al. 2008; Selbach et al. 2008) to discriminate miRNA effects on translation versus decay. However, these studies are also based on composite mRNA measurements and given the limits of sensitivity, there may be an ascertainment bias toward targets with pronounced regulation at the mRNA stability level. Thus, while these global approaches are very useful in identifying novel targets of miRNA action, they are less suited to evaluate the scope of translational control as a component of the miRNA mechanism, especially in highly proliferative or transformed cell lines.
The results presented here are consistent with the body of work using reporter constructs that established inhibition of target mRNA translation at the initiation stage as a major effect of miRNA action (for review, see Eulalio et al. 2008; Fabian et al. 2010). Clearly, stimulation of mRNA deadenylation and decay are further common consequences (Beilharz et al. 2009; Eulalio et al. 2009), and are also seen in the present work. We favor the view that, rather than being mutually exclusive, these different effects will all contribute to produce the appropriate outcome. As seen here with let-7, this outcome may feature marked changes in mRNA stability and translation in the regulation of some targets, whereas translational control predominates in others. Additionally, regulation by the same miRNA/target pairing may manifest differently depending on cellular context (e.g., let-7 predominantly regulates translation of HMGA2 in leiomyoma cells) (Peng et al. 2008).
Intricate multilevel control is inherent to miRNA biology. miRNAs act cooperatively with each other and other post-transcriptional gene regulators when multiple cognate sites are present in a given target mRNA (Kim et al. 2009a; Peter 2010). Widespread coexpression of mRNA isoforms in a tissue and context-dependent manner (Wang et al. 2008) adds further complexity to this picture, as does the emerging realization that miRNA precursors can be differentially processed to yield 5p/3p isoforms and isomiRs (Fernandez-Valverde et al. 2010). Thus, conventional mRNA-specific investigation will continue to play an important role in determining how a given target may navigate through this multilayered web of controls, while future global approaches will need to take account of these additional complexities to further improve our network-level understanding of miRNA action.
MATERIALS AND METHODS
Cell culture, transfection, and polysome profile analysis
HeLa cells were plated in a 15-cm dish and transfected at 50%–70% confluency the next day for harvesting 6–17 h post-transfection. Cells were transfected using lipofectamine 2000 or RNAiMAX (Life Technologies) with 442 pmoles anti-miR LNA or 884 pmoles for combined knockdowns (miRcury knockdown probes against miR-499 or a 1:1 mixture of let-7a and let-7b, Exiqon). Plasmid transfections were as described in Beilharz et al. (2009).
For polysome profiles, cells were lysed and subjected to density gradient centrifugation as described in Clancy et al. (2007). Briefly, cells were incubated with 0.1 mg/mL cycloheximide for 3 min at 37°C (or 20 min in 200 μg/mL puromycin), and lysed in 5 mM MgCl2, 150 mM KCl, 20 mM HEPES (pH 7.6), 2 mM DTT, complete protease inhibitor, 0.5 mM PMSF, 0.1 mg/mL cycloheximide, and 100 U/mL RNAseOUT. Cleared lysate was applied to a 17%–50% linear sucrose gradient, centrifuged for 2 h, 15 min at 35,000 rpm in a SW 41 Ti rotor (Beckman), and fractions were collected.
RNA extraction
Each gradient fraction was spiked with 100 ng of yeast total RNA, 1.2 mL of ethanol added, and stored overnight at −80°C. Glycogen was added and fractions centrifuged at 20,000g for 20 min. The pellet was vortexed in 1 mL of Trizol (Life Technologies) for 30 min and RNA purified. Total cellular RNA was prepared from unfractionated lysate using Trizol. Purity was assessed by spectrophotometry and integrity by agarose gel. Reporter-containing preparations were Turbo DNase treated (Ambion). One microgram of total or gradient fraction RNA was reverse transcribed using random hexamers and superscript III (Life Technologies).
Quantitative PCR (qPCR) and Ligation-mediated poly(A) test (LM–PAT)
All qPCR was performed on a Lightcycler 480 using a SYBR master mix (Roche) and melt curve analysis. Normalization of polysome gradient qPCR data to spike-in and GAPDH values is described in Supplemental Figure S1. Data from total RNA analysis were normalized to GAPDH, ubiquitin, and RPL13a. LM–PAT assays were performed as described (Clancy et al. 2007; Beilharz et al. 2009). See Supplemental Table S1 for primers.
SUPPLEMENTAL MATERIAL
Supplemental material is available for this article.
ACKNOWLEDGMENTS
We thank W. Filipowicz for pRL-3xbulge, H. Patel for data management, C.M. Sergio for MYC primers, and C. Suter and M.W. Hentze for useful suggestions on the manuscript. This work was funded by the Victor Chang Cardiac Research Institute and grants from the Australian Research Council and the National Health & Medical Research Council to T.P.
Footnotes
-
Reprint requests to: Thomas Preiss, Molecular Genetics Division, Victor Chang Cardiac Research Institute, 405 Liverpool St., Darlinghurst, NSW 2010, Australia; e-mail: t.preiss{at}victorchang.edu.au; fax: 612-9295-8601.
-
Article published online ahead of print. Article and publication date are at http://www.rnajournal.org/cgi/doi/10.1261/rna.2567611.
- Received November 25, 2010.
- Accepted March 3, 2011.
- Copyright © 2011 RNA Society




