


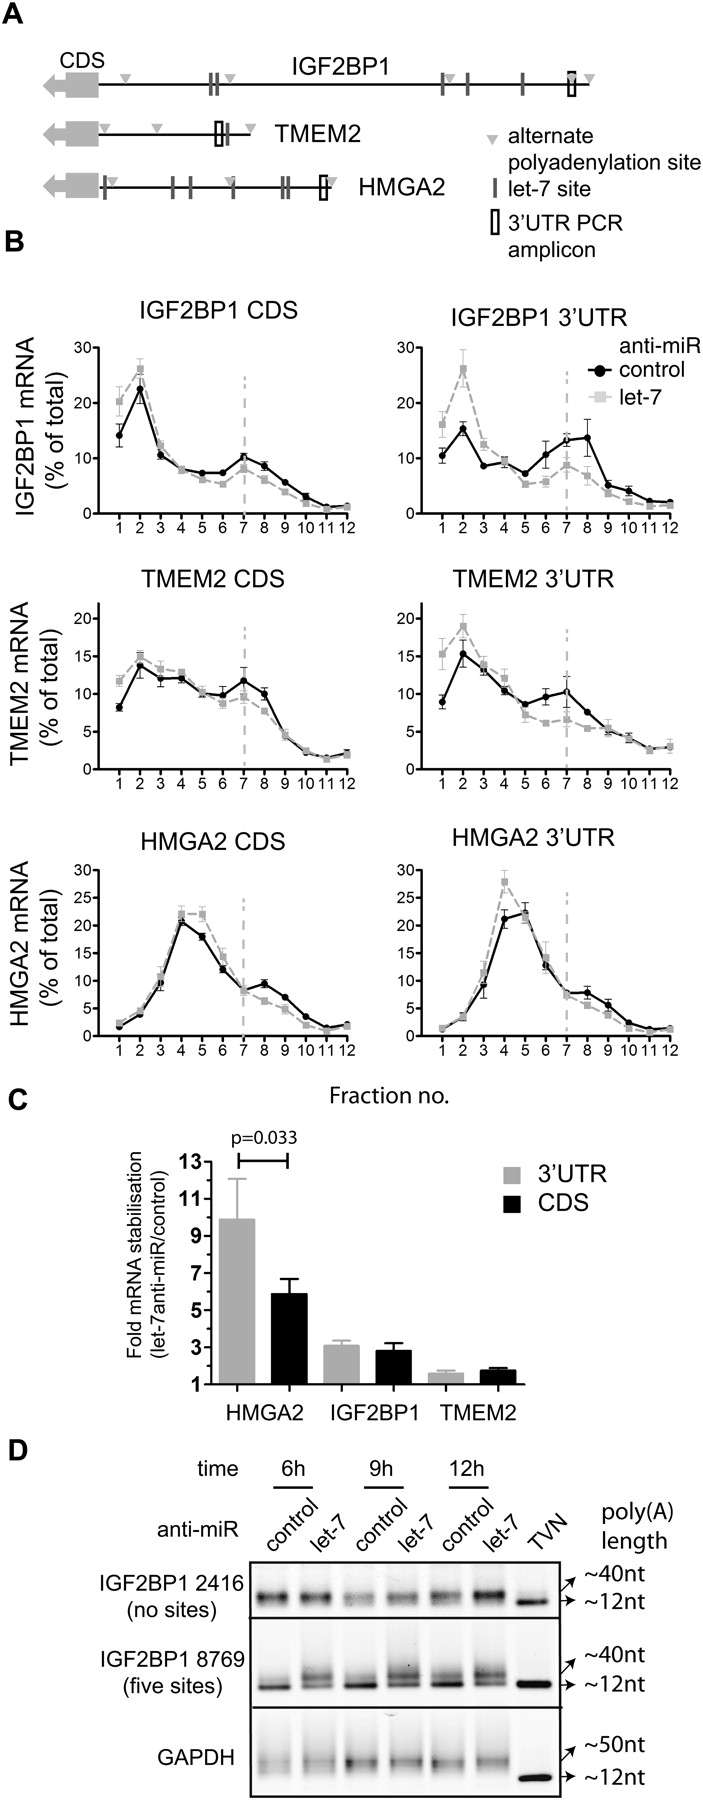
Analysis of long 3′ UTR isoforms reveals stronger regulation of translation initiation by let-7. (A) Schematic of IGF2BP1, TMEM2, and HMGA2 3′ UTRs showing let-7 binding sites (lines), alternative polyadenylation sites (triangles), and long 3′ UTR isoforms PCR amplicons (open black box). (B) Gradient distribution of let-7 target mRNAs IGF2BP1, TMEM2, and HMGA2 after transfection anti-let-7 (gray squares) or control anti-miR (black circles). Profiles are averages of four to nine independent experiments (bars represent standard error) and were generated either with coding regions primers as in Figure 2 (left) or with primers selective to the longest 3′ UTR isoform of each mRNA (right). (C) Stabilization of long 3′ UTR isoforms by let-7 17 h after anti-miR transfection. This panel shows the fold stabilization of HMGA2, IGF2BP1, and TMEM2 measured using coding-region primers or primers in the 3′ UTR. Bars represent standard error of three to five independent experiments. (D) Poly(A) tail lengths of two 3′ UTR isoforms of IGF2BP1 mRNA (cleavage sites at 2416 and 8769, see Fig. 2A) were measured by LM–PAT assay 6, 9, and 12 h after anti-miR transfection. GAPDH mRNA is shown as an invariant control; TVN is a marker for ∼12 nt of poly(A) tail.




