


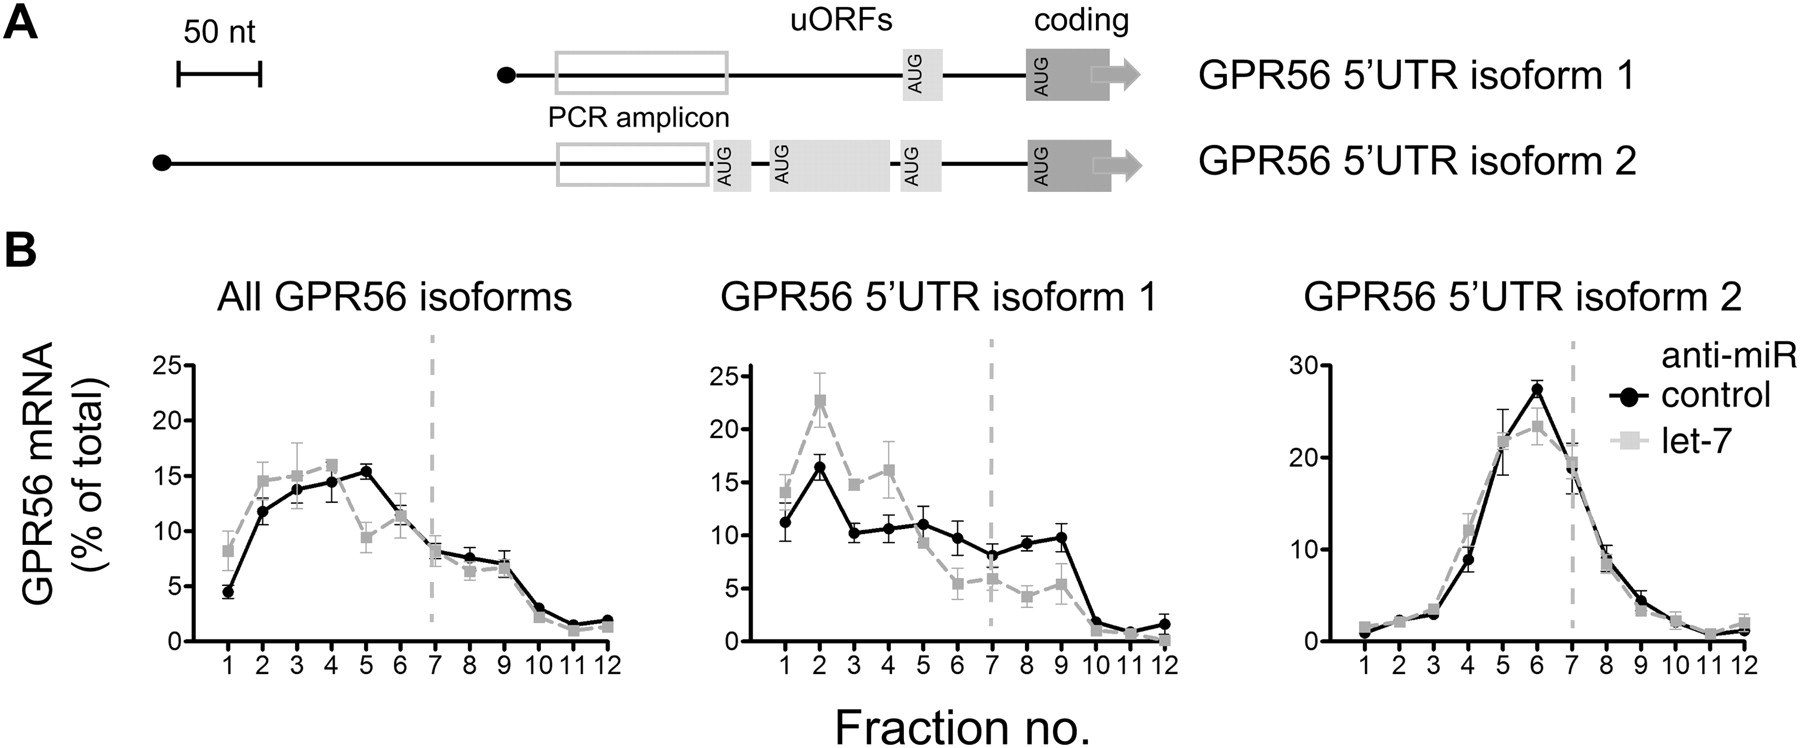
FIGURE 5.
Analysis of GPR56 5′ UTR isoforms reveals regulation of translation initiation by let-7. (A) Schematic of alternate 5′ UTRs of GPR56 mRNA with positions of putative upstream open reading frames (uORFs) boxed in light gray and isoform-specific amplicons in open gray boxes. (B) Gradient distribution of GPR56 mRNA after transfection with anti-let-7 (gray squares) or control anti-miR (black circles). Profiles are averages of four independent experiments (bars represent standard error), either with coding regions primers as in Figure 2 (left) or primers specific to GPR56 5′ UTR isoform 1 (middle) and isoform 2 (right), respectively.




