


Assembly and mobility of exon–exon junction complexes in living cells
- Ute Schmidt1,2,5,
- Kang-Bin Im2,
- Carola Benzing1,
- Snjezana Janjetovic1,
- Karsten Rippe3,
- Peter Lichter1 and
- Malte Wachsmuth2,4
- 1Division of Molecular Genetics, Deutsches Krebsforschungszentrum, 69120 Heidelberg, Germany
- 2Cell Biophysics Group, Institut Pasteur Korea, Seoul 136-791, Republic of Korea
- 3Research Group Genome Organization and Function, Deutsches Krebsforschungszentrum, 69120 Heidelberg, Germany
- 4Cell Biology and Biophysics Unit, European Molecular Biology Laboratory, 69117 Heidelberg, Germany
Abstract
The exon–exon junction complex (EJC) forms via association of proteins during splicing of mRNA in a defined manner. Its organization provides a link between biogenesis, nuclear export, and translation of the transcripts. The EJC proteins accumulate in nuclear speckles alongside most other splicing-related factors. We followed the establishment of the EJC on mRNA by investigating the mobility and interactions of a representative set of EJC factors in vivo using a complementary analysis with different fluorescence fluctuation microscopy techniques. Our observations are compatible with cotranscriptional binding of the EJC protein UAP56 confirming that it is involved in the initial phase of EJC formation. RNPS1, REF/Aly, Y14/Magoh, and NXF1 showed a reduction in their nuclear mobility when complexed with RNA. They interacted with nuclear speckles, in which both transiently and long-term immobilized factors were identified. The location- and RNA-dependent differences in the mobility between factors of the so-called outer shell and inner core of the EJC suggest a hypothetical model, in which mRNA is retained in speckles when EJC outer-shell factors are missing.
Keywords
INTRODUCTION
The separation of cytoplasm and nucleoplasm in mammalian cells by the nuclear envelope enables the cells to control the flow of information between the two compartments via selective transport mechanisms. In a number of signal transduction pathways, cytoplasmic retention of transcription factors or their release into the nucleus modulate gene expression. Vice versa, nuclear retention of premature or incorrectly processed RNA messages prevents their translation, which otherwise might produce proteins with activities harmful to the cell (Gadal and Nehrbass 2002). Thus, the interplay of transcription and splicing must result in the formation of a distinct and stable mRNA–protein complex (mRNP), the export-competent conformation of spliced messenger RNA (mRNA). Splicing involves the five uridine-rich small nuclear ribonucleo–protein particles (snRNPs) U1, U2, U4/U6, and U5, as well as additional proteins, which together carry out the excision of introns and ligation of exons (Jurica and Moore 2003). During splicing, factors required for translation, quality control, and export are recruited to the mRNA. These proteins form together with the mRNA 20–25 nucleotides (nt) upstream of the exon–exon boundary (Le Hir et al. 2000a,b) and are referred to as the exon–exon junction complex (EJC). Certain EJC components are exported with the mRNA and trigger nonsense-mediated decay (NMD), i.e., the elimination of the mRNA in the cytoplasm in case it contains a premature termination codon (Chang et al. 2007). Studies addressing the structure of the EJC/RNA complex suggest the existence of a stable tetrameric inner core, which consists of the proteins eIF4A3 and MLN51 and the Y14/Magoh dimer (Fig. 1A; Ballut et al. 2005; Tange et al. 2005; Le Hir and Andersen 2008). The inner core is covered by RNPS1 and REF/Aly, which form, along with further proteins, the outer shell. UAP56 and the export dimer NXF1/p15 are considered as shuttling EJC proteins that interact with the EJC/mRNP complex in a more transient manner (Tange et al. 2005). The establishment of a stable EJC requires a dynamic remodeling of the mRNP to establish a complex protein–protein and protein–RNA interaction network (Zhang and Krainer 2007).
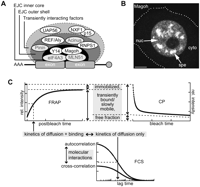
Schemes of EJC complex structure, in situ distribution, and applied experimental approaches. (A) The minimal EJC core consists of a tetrameric complex, comprising eIF4A3, MLN51, Magoh, and Y14 (Tange et al. 2005). Two additional layers of EJC factors cover the EJC core: RNPS1, Acinus, Pinin, and REF/Aly comprise the outer shell and UAP56 and NXF1/p15 are transiently interacting factors. The investigated proteins in this study are highlighted in white. The figure is modified from Tange et al. (2005). Please note that the model does not reflect the asymmetry of the EJC. For a detailed structural view on the EJC please see Chang et al. (2007) and Le Hir and Andersen (2008). (B) The in situ distribution of EJC proteins is exemplified with a GFP–Magoh-expressing living cell. The dotted line indicates the outline of the cell, the arrows point at speckles or the nucleoplasm. spe: speckles; nuc: nucleoplasm; cyto: cytoplasm; and scale bar = 5 μm. (C) Scheme of FRAP, CP, and FCS to illustrate how the different parameters (half-times of recovery, diffusion correlation times, free, transiently bound/slowly mobile and immobilized fractions) were obtained. For FRAP, fluorescent molecules within a region of interest were bleached with a high intensity laser pulse. The exchange of bleached against unbleached molecules was observed over time and half-times of recovery and immobilized fractions were determined. For CP, a laser beam was placed at a point of interest, which was illuminated continuously to bleach the pool of fluorescent molecules within the spot. The exchange of fluorescent against bleached molecules was measured within the spot over time and the fractions of fully free and transiently bound or immobilized molecules were determined. Immobilization refers to the absence of exchange within the observation period; it does not imply that the proteins will never be replaced. FCS and two color FCCS were measured for 60 sec and (co)diffusion correlation times were obtained from correlated fluctuation curves. For details see the text and Materials and Methods.
Despite its good biochemical in vitro characterization leading to the model depicted in Figure 1A, the spatiotemporal assembly of the EJC in the nucleus remains obscure. Splicing-related proteins, including the EJC constituents, snRNPs, and RNAs, accumulate in discrete nuclear clusters, termed speckles or SC35 domains (Fig. 1B; Carmo-Fonseca et al. 1991; Spector et al. 1991). This raises the question for which step in mRNA biogenesis speckles play a functional role. In order to address this point we previously used the technique of bimolecular fluorescence complementation (BiFC) (Hu et al. 2002) to visualize Y14/NXF1-containing mRNPs (Schmidt et al. 2006). The assay is based on the complementation of two fragments of the yellow fluorescent protein, which are fused to Y14 and NXF1, respectively. Upon interaction of the two proteins in the presence of nascent RNA, the YFP fragments complement, thereby reconstituting a YFP molecule. Emerging fluorescence is thus a proof of protein–protein interaction (for BiFC on RNA see also Rackham and Brown 2004; Valencia-Burton et al. 2007). The Y14/NXF1–BiFC complexes were accumulated and immobilized in speckles pointing toward mRNA retention at these sites prior to export. However, the BiFC approach could neither reveal the assembly sites of these complexes nor did it allow us to assess the impact of inhibiting Y14–NXF1 dissociation with respect to mRNA immobilization. To further investigate the formation of the EJC in the in vivo context the diffusion properties and mobilities of a representative set of EJC inner core (Y14, Magoh) and outer-shell (RNPS1, REF/Aly) proteins as well as transiently interacting factors (UAP56, NXF1) were measured using fluorescence recovery after photobleaching (FRAP), continuous fluorescence photobleaching (CP), fluorescence correlation spectroscopy (FCS), and fluorescence cross-correlation spectroscopy (FCCS) (Fig. 1C). The results of these experiments lead to a model for the retention of mRNA in nuclear speckles that depends on EJC composition.
RESULTS
We examined the assembly of the EJC in vivo based on the core/shell model proposed by Tange et al. (2005), see Figure 1A. As representative proteins the EJC inner-core factors Y14 and Magoh, the outer-shell factors REF2-II (depicted in Fig. 1A as REF/Aly) and RNPS1, and the transiently interacting factors UAP56 and NXF1 were chosen (Fig. 1A). The EJC proteins investigated localized in the cell nucleus and accumulated in nuclear speckles (Fig. 1B, GFP–Magoh), except for NXF1 and the RNA binding-deficient mutant NXF1Δ1-371, which showed a homogeneous distribution throughout the nucleus (Schmidt et al. 2006).
In order to obtain the degrees of immobilized, transiently bound/slowly mobile, and fully mobile particles, as well as their dynamic properties such as diffusional and association-/dissociation-related kinetics of the factors above, a combination of imaging-based FRAP, point FRAP, CP (Wachsmuth et al. 2003), and F(C)CS experiments was performed (Fig. 1C). Briefly, FRAP allowed the distinction of an immobilized from a combined transiently bound and freely diffusive fraction. With CP, it was possible to discriminate a fully free fraction from a bound, i.e., a transiently bound/slowly diffusive and immobilized fraction. FCS and FCCS were used for differentiating diffusion properties of free factors from slower-moving complexes and for the determination of macromolecular interactions, respectively. Finally, the diffusion properties obtained from FCS could be compared to the joint diffusion and binding properties determined from the FRAP recovery.
We performed all experiments in cells covering a broad range of expression levels. Typical nuclear FCS amplitudes for all constructs were around 0.05 and had a lower limit of 0.005, corresponding to an average number of 20 and 200 molecules, respectively, in the microscope focus with a volume of ∼0.3 femtoliter (fl). Thus, typical nuclear concentrations of fluorescently tagged molecules were ∼100 nM with an upper limit of ∼1 μM. The observed variations in the values for the different fractions and diffusion properties were not concentration dependent, so that we were able to obtain the fractions by averaging over all the cells with different expression levels.
Differential immobilization of EJC core, shell, and transport proteins in nucleoplasm, speckles, and cytoplasm
Imaging-based FRAP revealed differential degrees of immobilization and dynamics of the EJC proteins (Fig. 2A): transiently bound and outer-shell factors (UAP56, REF2-II, and RNPS1) had smaller immobilized fractions in speckles than the core factors Magoh and Y14 (Fig. 2A,D; Table 1). Half-times of recovery were between 0.2 and 0.6 sec, except for UAP56, which was much slower (6.0 sec) (Table 2), indicating that the recovery of UAP56 was dominated by binding rather than diffusion. The recovering fractions of the other factors experienced either slow free diffusion or slow effective diffusion composed of transient binding and free diffusion.
Percentage of free, slowly mobile/transiently bound, and immobilized fractions of EJC proteins
Half-times of recovery and diffusion correlation times of GFP–UAP56, GFP–REF2-II, GFP–RNPS1, GFP–Magoh, GFP–Y14, RFP–NXF1, RFP–NXF1Δ1-371, and Y14/NXF1 BiFC complexes measured by FRAP and FCS
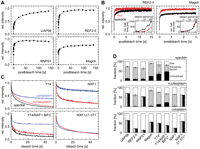
Determination of half-times of recovery, free and bound fractions of EJC proteins and Y14/NXF1 BiFC complexes at different cellular locations with imaging FRAP, point FRAP, and CP. (A) Imaging-based FRAP of GFP-tagged UAP56, REF2-II, RNPS1, and Magoh in speckles. The curves represent the average of 12–21 single FRAP experiments. (B) Point FRAP of GFP-tagged REF2-II and Magoh performed in speckles (black) and nucleoplasm (red). Half-times of recovery increased with increasing bleaching periods, indicating that effective diffusion contributed to the redistribution (inset). (C) CP of GFP-tagged Y14, NXF1, NXF1Δ1-371, and YFP-tagged Y14/NXF1–BiFC complexes. The example plots are averages of 5–10 independent CP experiments and show differences in the degree of immobilized/transiently bound and free molecules between cytoplasm (blue), speckles (black), and nucleoplasm (red). (D) Plots of free, transiently bound/slowly mobile and immobilized fractions of UAP56, REF2-II, RNPS1, Magoh, Y14, Y14/NXF1–BiFC complexes, NXF1, and NXF1Δ1-371 in speckles, nucleoplasm, and cytoplasm obtained from the integrated FRAP and CP approach. The allocated transiently bound fractions for the cytoplasm, as well as of nucleoplasmic UAP56 and RNPS1 may still contain immobilized molecules (indicated by vertically splitting the bars) as FRAP data were not available. Immobilized fractions obtained with FRAP were taken from (*) Schmidt et al. (2006) and (†) Calapez et al. (2002).
In order to further elucidate the redistribution process by extending the time resolution toward the microsecond range, we carried out point FRAP experiments, which take advantage of the very small bleaching and observation volume of submicrometer dimensions of the FCS setup. We selected the EJC outer-shell factor REF2-II and the EJC core factor Magoh as examples. Point FRAP was performed in speckles and at nucleoplasmic sites with bleaching periods varying from 0.5 to 100 msec (Fig. 2B). The resulting half-times of recovery increased with increasing bleaching periods (Fig. 2B, insets), showing that effective diffusion or transport contributes to the redistribution. For REF2-II, the half-times of recovery were larger in speckles than in the nucleoplasm, whereas they were the same for Magoh at both locations (Fig. 2B; Table 2). We chose the extrapolated infinitesimal bleaching period for further evaluation in order to minimize the effect of diffusion or transport during bleaching. Although the immobile fractions of REF2-II in speckles and nucleoplasm were small (7.3% and 1.5%), we obtained half-times of recovery of 108 and 8.2 msec, respectively (Table 2). Magoh showed only a minor difference in the half-time of recovery in speckle and nucleoplasm, but a significantly higher immobilized fraction in speckles (Tables 1, 2). These results suggest that the accumulation of the EJC outer-shell factor REF2-II in speckles results from a longer transient immobilization, whereas the accumulation of the EJC core factor Magoh corresponds to a larger fully immobilized fraction. To better distinguish a diffusional contribution to the recovery from biochemical processes, such as a transcription-induced formation of newly assembled complex or an active removal of components following remodeling of the EJC, we performed FCS experiments (see below).
In order to discriminate the bound (i.e., the transiently bound/slowly mobile plus the immobilized) from the free fractions, CP was applied to all proteins studied here (Fig. 2C), including the RNA binding-deficient mutant NXF1Δ1-371, as well as the Y14/NXF1–BiFC complexes. As shown before, NXF1Δ1-371 moves faster than wild-type NXF1 (Calapez et al. 2002), while the Y14/NXF1–BiFC complexes move slower than single NXF1 or Y14 (Schmidt et al. 2006). CP measurements were performed in speckles, nucleoplasm, and cytoplasm. For a comprehensive evaluation, we subtracted the values of the immobilized fractions obtained with FRAP from the joint transiently bound/slowly mobile and immobilized fractions obtained with CP (Fig. 2D; Table 1).
The bound fractions of all proteins were dominant and slightly larger in speckles than in the nucleoplasm (Fig. 2C,D; Table 1). Bound fractions of 53% (nucleoplasm) and up to 75% (speckles) were found for UAP56, REF2-II, and RNPS1 with fully immobilized contributions of 10% or less. In contrast, Magoh and Y14 had larger bound fractions of 80% or more including a fully immobilized contribution that is higher in speckles than in the nucleoplasm. The results further support the idea that mainly long-term binding leads to the accumulation of Magoh and Y14 in speckles, while accumulation of other EJC factors results mainly from transient immobilization. NXF1 and NXF1Δ1-371 featured similar bound fractions (60%–65%) in the nucleus (Fig. 2C). The fraction of bound BiFC complexes amounted to 82% in speckles and 68% at nucleoplasmic sites.
In the cytoplasm, the bound fractions showed more protein-dependent variations than in the nucleus, but were always smaller than at nuclear sites. Wild-type NXF1 was predominantly freely mobile, whereas the mutant was mainly in a bound state. The sizes of both the free and the bound fractions of the BiFC complexes were between those of the components Y14 and NXF1.
Diffusion properties of mobile EJC proteins and codiffusion of Y14 and NXF1
In contrast to FRAP, FCS allows the identification of a freely diffusive fraction and to measure diffusion properties with submicrometer spatial and microsecond time resolution, while it is conceptually “blind” for immobilized molecules as these would simply get bleached before a steady state fluorescence signal due to molecules diffusing through the focus is reached. Furthermore, a free fraction can be distinguished from molecules assembled into high-molecular, yet mobile, complexes. We found different types of autocorrelation functions, representing a single fast-moving component, a fast-moving component plus a slow relaxation, no correlated movements, or a single slow relaxation (Fig. 3A,B).
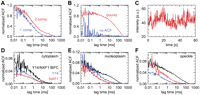
FCS of EJC proteins. (A) Examples of obtained autocorrelation curves: autocorrelation function (ACF) representing one moving component with free, yet anomalous diffusion (blue; GFP–Y14 in the cytoplasm) or two moving components (red; GFP–Y14 in speckles). (B) Example of an FCS experiment not showing correlated movements (blue; GFP–Magoh in nucleoplasm) and an autocorrelation curve with a single, very slow fluorescence decay, which was considered as being associated with nucleoplasmic components, such as chromatin (red; GFP–UAP56 in speckles). (C) Intensity time trace used for the calculation of ACFs showing very slow fluorescence decays to demonstrate that the decay is not a photobleaching artifact. (D–F) Comparison of the ACF of Y14/NXF1–BiFC complexes (black) with GFP–Y14 (blue) and RFP–NXF1 (red) in (D) the cytoplasm, (E) the nucleoplasm, and (F) speckles. The examples of the Y14 and NXF1 autocorrelation curves were obtained from the same cell stably expressing GFP–Y14 and transiently coexpressing RFP–NXF1. BiFC curves were measured in MCF7 cells transiently expressing the BiFC plasmids YC–Y14 and YN–NXF1.
The latter case was observed for nuclear UAP56 whose unusual correlation functions showed very slow correlation times (τ D > 100 msec), which could neither be fitted with a one-component nor with a two-component model function. The slow relaxations were interpreted as chromatin- or non-chromatin-associated diffusion and were no bleaching artifacts, as could be seen from the time course of intensity (Fig. 3C). Single moving components were found for all proteins in the cytoplasm, as well as for nuclear NXF1, Y14, REF2-II, and NXF1Δ1-371. We observed two moving components of nuclear Y14, NXF1, and REF2-II, but no correlated movements of nuclear RNPS1 and Magoh. Table 2 summarizes the respective diffusion correlation times.
The best curve fits for NXF1Δ1-371 in all three compartments represented a single fast-moving fraction, showing that NXF1Δ1-371 was not integrated into a large complex and moved by free, yet anomalous diffusion. Diffusion correlation times of NXF1Δ1-371 were slower in the nucleoplasm compared to the cytoplasm (τ D,cyto = 0.75 ± 0.17 msec; τ D,nuc = 1.12 ± 0.11 msec; τ D,spe = 1.54 ± 0.21 msec). These diffusion times correspond to apparent diffusion coefficients between 5.8 and 11.9 μm2 sec−1 and are thus indicative of isolated proteins or relatively small RNA-free complexes in all three compartments.
Single component correlation functions and similarly fast diffusion correlation times were found for UAP56, REF2-II, RNPS1, Y14, and NXF1 in the cytoplasm (Fig. 3D). Cytoplasmic Magoh was slower (1.11 ± 0.39 msec), indicating that only Magoh is integrated into larger complexes in the cytoplasm. The fits of the correlation functions of REF2-II, Y14, and NXF1 in speckles and at random nucleoplasmic sites revealed fast-moving components with apparent diffusion coefficients between 2.9 and 7.2 μm2 sec−1 and partly additional slower-moving components (Fig. 3D,E; Table 2). The fast components resembled NXF1Δ1-371 correlation functions and could be assigned to free, yet anomalous, diffusion. The second fraction was more than nine times slower than the free, fraction, being an indication for the proteins' assembly into bigger complexes. NXF1 moved slower in speckles than in the nucleoplasm, an observation not evident for the other proteins.
For a comparison of FCS and point FRAP data, we computed the mean dwell time of the REF2-II molecules in two ways: from FCS data, the average of the fast and the slow diffusion correlation times weighted with their apparent fractions was computed, while from point FRAP data, the diffusion times obtained from the half-times of recovery were extrapolated to an infinitesimal bleaching period. We obtained 16.6 msec (FCS, corresponding to an apparent diffusion coefficient of 0.54 μm2 sec−1) and 13.5 msec (FRAP, 0.66 μm2 sec−1) in the nucleoplasm and 22.8 msec (FCS, 0.39 μm2 sec−1) and 89.9 msec (FRAP, 0.10 μm2 sec−1) in speckles. Thus, in the nucleoplasm the diffusing molecules as seen with FCS can be identified as the combined free and slowly mobile/transiently bound fraction in FRAP, i.e., there is no significant transient immobilization. Despite the absence of correlations of Magoh, we could determine the mean dwell time from FRAP as 5.3 and 5.2 msec (1.7 μm2 sec−1) in nucleoplasm and speckles, respectively, most likely resulting from a purely diffusive contribution to the recovery. Thus, accumulation in speckles results from transient immobilization of REF2-II and from long-term immo-bilization of Magoh.
To further distinguish the diffusion of RNA-bound EJC proteins from free factors, the codiffusion of a pair of EJC proteins as a bona fide representative comparison was investigated in two ways: Y14/NXF1–BiFC complexes were measured with FCS and GFP–Y14/RFP–NXF1 pairs were measured with two-color FCCS. Figure 3, D–F, shows typical NXF1, Y14, and BiFC correlation curves. The autocorrelation functions obtained in the nucleus could be fitted with either a one- or a two-component model. The single-component diffusion correlation times revealed that BiFC complexes were about twofold slower than RFP–NXF1 and GFP–Y14, respectively, demonstrating that the BiFC complexes are larger. Further, the BiFC complexes featured slightly larger diffusion correlation times in speckles compared to the nucleoplasm (Table 2). BiFC curves fitted with two components provided evidence for their integration into complexes of different sizes. Detection of YFP fluorescence in a nondenaturating agarose gel electrophoresis further confirmed the RNA dependence and the heterogenic sizes of the Y14/NXF1–BiFC complexes (Supplemental Fig. S1). In the cytoplasm, the BiFC complexes appeared to be freely mobile, but moved slower than Y14, NXF1, or NXF1Δ1-371, respectively.
Cross correlation between GFP–Y14 and RFP–NXF1 was found in the cytoplasm, where the protein concentration was low (Fig. 4A). The degree of cross correlation was quantified using ratioG (Strohner et al. 2005) and was 0.15 ± 0.06 (n = 5 cells). RNAi against endogenous Y14 and NXF1 mRNA was used to increase the probability to measure FCCS by decreasing the levels of the endogenous, nonlabeled Y14 and NXF1 protein pool (Fig. 4B). While in control RNAi experiments, ratioG was unchanged (0.27 ± 0.05), simultaneous knockdown of Y14 and NXF1 increased ratioG to 0.45 ± 0.08 (n = 8). Again, the cross-correlation signal between NXF1 and Y14 was found in the cytoplasm only, leading to the conclusion that the concentrations of free proteins in the nucleus were exceeding the range accessible for FCCS measurements. An interaction between GFP–Y14 and RFP–NXF1Δ1-371 was not observed in the FCCS experiments, demonstrating that the NXF1 mutant is RNA binding deficient and that fluorescence cross talk was not the source of cross correlations (Fig. 4C). As a positive control we used the NXF1/p15 heterodimer, since RNA binding is a prerequisite for NXF1 and Y14 interactions but not for NXF1/p15 dimer formation. In the cytoplasm this pair showed pronounced cross correlations (Fig. 4D) with ratioG = 0.41 ± 0.12 (n = 6).
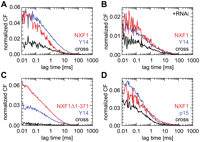
Co-diffusion of Y14 and NXF1 measured with FCCS. (A) Cross correlation (black) between GFP–Y14 (blue) and RFP–NXF1 (red) was detected in the cytoplasm. (B) RNAi-mediated reduction of endogenous Y14 and NXF1 increased the relative cross-correlation amplitude (black). Corresponding autocorrelation functions are shown in red for RFP–NXF1 and in blue for GFP–Y14. (C) Cross correlation (black) between GFP–Y14 (blue) and RFP–NXF1Δ1-371 (red) was not detected, demonstrating that fluorescence cross talk did not contribute to FCCS. (D) Cross-correlation (black) between GFP–p15 (blue) and RFP–NXF1 (red) as detected in the cytoplasm.
RNA-dependent localization and mobility of REF2-II and Magoh
In order to assess the RNA contributions we microinjected RNase A into living cells and assayed the cells 30 min after injection, which was sufficient to digest nascent RNA (Fig. 5A). To locate injected and RNA-digested cells, propidium iodide (PI) was coinjected. PI stained the nucleoli and the cytoplasm in control cells intensely, while RNase-treated cells could be identified by a strong PI signal at the nuclear periphery and a ring-like cluster in the nuclear center similar to purely DNA-specific staining of untreated cells (Fig. 5A). Regions with high PI density are referred to as HPD and regions with low PI density are referred to as LPD. Within the first 30 min post-injection, the cells appeared morphologically normal with the exception of the observed changes in PI staining. Only at around 90 min post-injection, cells started to go into apoptosis as indicated by the recruitment of the early proapoptotic factor BAX to the mitochondria (Kim et al. 2006; M. Caudron-Herger and K. Rippe, unpubl.).
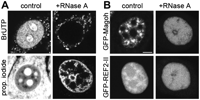
Accumulation of EJC in speckles is RNA dependent. The patterns of nascent RNA, nucleic acids, GFP-Magoh, and GFP–REF2-II were examined in intact cells subjected to RNA digestion. (A) Upper row: nascent RNA was labeled by BrUTP incorporation for 30 min. Cells were either fixed (left) or subsequently reinjected with RNase A (right) and then fixed. Control cells displayed the typical nascent RNA pattern, while in RNase A injected cells, no RNA was detected within the nuclei. Lower row: propidium iodide was used as a relocation marker for injected cells and to follow redistribution of nucleic acids upon RNase A injection. RNA digestion led to re-distribution of the propidium iodide signal and strong fluorescence appeared at the nuclear periphery in the nuclear center. (B) RNA digestion led to the disappearance of the typical speckled pattern of GFP–Magoh and GFP–REF2-II (examples show living/unfixed cells). Scale bar = 5 μm.
We focused on REF2-II and Magoh as examples of a core and an outer-shell EJC factor. Upon RNase A injection, the proteins were distributed uniformly throughout the nuclei (Fig. 4B), demonstrating that the speckle pattern is RNA dependent. CP showed that the fraction of free REF2-II increased both in the nucleus and in the cytoplasm (Fig. 6; Table 2). FCS revealed an increase of the fast diffusion correlation times of REF2-II (Fig. 5A; Table 2), whereas a second, slowly diffusing component was no longer detected in RNase A-treated cells. These findings denote that the molecular weight increase of the fast component after RNA digestion is possibly due to arrested association with other proteins and that the slow component almost solely present in untreated cells contains RNA.
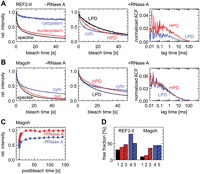
Mobility of GFP–Magoh and GFP–REF2-II in RNA-digested cells. Changes of the degree of immobilization and of the mobility of REF2-II and Magoh were measured in RNA-digested cells with CP, FCS, and FRAP and compared with untreated cells. (A) CP and FCS of REF2-II in RNA-digested cells. Left: CP was measured in speckles (black), the nucleoplasm (red), and the cytoplasm (blue) in control cells. Center: CP reveals an increase of the free fraction of REF2-II in the nucleus (high propidium iodide density region HPD: red and low propidium iodide density region LPD: black) and a decrease of the free fraction in the cytoplasm (blue) in RNase A-injected cells. Right: FCS of REF2-II after RNase A injection. (B) Same experiments as in A but with Magoh. (C) FRAP of Magoh in RNA-digested cells detected 99% free molecules and a half-time of recovery similar to that of untreated cells (red: RNA digested cells, average of n = 8 cells; blue: untreated cells, average of n = 18 cells). (D) Bar chart summarizing the free fractions of REF2-II and Magoh before and after RNA digestion. 1: speckle before digest; 2: nucleoplasm before digest; 3: averaged over HPD and LPD (referred to as “nucleus”) after digest; 4: cytoplasm before digest; and 5: cytoplasm after digest.
Similarly to REF2-II, the free fraction of nuclear Magoh increased upon RNase A treatment. In the cytoplasm, free fractions remained unchanged (Fig. 6B; Table 1). The diffusion of Magoh after RNA digestion could now be detected and evaluated with FCS in the nucleus (Fig. 6B). The best fit curve for Magoh represented a single moving species with diffusion correlation times corresponding to that of NFX1-Δ1-371 (Table 2). This indicates a release of associated factors after RNA digestion and the absence of RNA-containing complexes. FRAP experiments confirmed the increase of the freely mobile Magoh fraction in the nucleus to 99% in RNase A-treated cells, with half-times of recovery similar to those measured in untreated cells (Fig. 6C; Table 2). A summary of the free fractions of REF2-II and Magoh before and after RNase A injection is shown in Figure 6D.
DISCUSSION
The EJC assembly at the mRNA is tightly related to its functional state and proceeds in a step-wise manner with UAP56, RNPS1, and REF/Aly binding to the pre-mRNA prior to the first splicing step, while Y14/Magoh, MNL51, and eIF4A3 associate with the mRNA during or after exon–exon ligation (Reichert et al. 2002; Kataoka and Dreyfuss 2004). Studies on the structural organization of the EJC proteins revealed a large supramolecular complex that is depicted schematically in Figure 1A (Ballut et al. 2005; Tange et al. 2005; Le Hir and Andersen 2008). Similar to splicing factors, EJC proteins accumulate in nuclear speckles, suggesting that these nuclear sites play a role in mRNA biogenesis. In vivo studies of poly(A) RNA and serine–arginine-rich splicing proteins (SR proteins), which bind transiently during splicing, revealed that they pass through speckles at rates similar to those found at other nucleoplasmic locations. These rates are compatible with free diffusion or very fast association/dissociation, suggesting that speckles do not serve as sites of mRNA processing or RNA depots (Misteli et al. 1997; Politz et al. 1999; Kruhlak et al. 2000; Molenaar et al. 2004; Politz et al. 2006). In contrast, we recently found that Y14/NXF1 BiFC complexes were immobilized in nuclear speckles, leading to the conclusion that a fraction of spliced RNA is retained at these sites (Schmidt et al. 2006). Supporting this view, certain mRNAs require the passage through speckles in order to become competent for export (Holt et al. 2007; Smith et al. 2007). Furthermore, transcripts with many exons, splice-defective transcripts, or poly(A) RNA in splicing-inhibited cells accumulate in speckles (Smith et al. 1999; Johnson et al. 2000; Kaida et al. 2007), pointing toward retention of transcripts unable to form export-active complexes at these sites.
In order to elucidate the dynamic formation of export-competent mRNPs and their interactions with different cellular sites, the mobility and interactions of the EJC core factors Y14 and Magoh, the outer-shell components REF2-II and RNPS1, and the transiently associated factors UAP56 and NXF1 were studied here. By applying a complementary confocal fluorescence microscopy-based approach, a quantitative description was obtained that led to the hypothetical model shown in Figure 7.
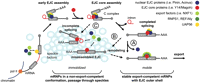
Model for the coupling of mRNA transcription, splicing, and nuclear export. Messenger RNA is transcribed by RNA polymerase II (pol II). Except for UAP56 (yellow circle), association of the pre-mRNA with EJC factors of the outer shell (dark green circles), factors with export activity (light green circles), or factors loosely interacting with the EJC and RNA (blue circles) is very dynamic. EJC core proteins (red circles) stabilize the mRNP complex (EJC core assembly). Spliced mRNPs in a stable, export-competent protein–RNA conformation are exported immediately (path A), while other mRNA–protein complexes, which carry an incomplete or destablized EJC (path B) or feature many exons and introns and are thus not completely spliced (path C), accumulate in speckles due to the lack of outer-shell factors that drive export. Completion of splicing and (re)assembly of a functional EJC leads to a stable protein–RNA complex that is exported.
Similar or identical fluorescent-protein-tagged constructs have been studied separately in a number of previous studies (Bachi et al. 2000; Lykke-Andersen et al. 2001; Rodrigues et al. 2001; Calapez et al. 2002; Zolotukhin et al. 2002; Custodio et al. 2004; Forler et al. 2004; Glanzer et al. 2005; Schmidt et al. 2006). As judged from the previous studies, as well as from our own work, we have no indication that the constructs used here behave differently than the endogenous proteins. We performed all experiments in cells covering a broad range of expression levels. Within this concentration range we did not observe any dependence of parameters, such as mobile and bound fractions or diffusion correlation times on the concentration of tagged proteins. It should be noted that the numbers of all proteins presented here are averages of many different cells with various expression levels, this way, remaining concentration effects were considered as being ruled out. As we did not know the exact concentration ratio of tagged versus endogenous proteins and as the results are based on ectopically expressed populations, the numbers for free fractions might be overestimated when assuming that the binding reactions involved are sufficiently close to saturation. Since we followed the above-mentioned scheme for all proteins the relative fractions should still be comparable between the different proteins.
High degree of immobilization of the EJC core proteins in speckles
We determined the fractions of free, immobilized, and transiently bound molecules using FRAP and CP. In agreement with findings for splicing factors (Misteli et al. 1997; Kruhlak et al. 2000; Carrero et al. 2006; Rino et al. 2007), all proteins studied are present in a high free and transiently bound/slowly mobile fraction and are not significantly immobilized in the nucleoplasm, ensuring their availability throughout the nucleus.
However, the degree of immobilization and the dwell time in speckles is protein specific: Magoh and Y14 have a greater immobilized fraction, but a shorter dwell time in speckles than outer shell (this study), export (Calapez et al. 2002; this study), or splicing factors (Misteli et al. 1997; Kruhlak et al. 2000; Kues et al. 2001). In vivo RNA digestion experiments show that the immobilization and accumulation of the EJC proteins in speckles is RNA dependent. Thus, Magoh and Y14 accumulate in speckles preferentially due to an RNA-involving immobilization mechanism, whereas the other factors accumulate at these sites because of longer transient dwell times.
In contrast to Y14 and Magoh proteins, which are loaded onto spliced mRNA via an eIF4A3-dependent mechanism resulting in an RNase-resistant and stable core complex, RNPS1 and REF/Aly interact with the mRNP in a more dynamic fashion (Ballut et al. 2005; Zhang and Krainer 2007). This study implies that stable RNA/EJC core complexes emerge in speckles because the EJC inner core protein Magoh is only immobilized when the RNA component of the speckles is present, for which an immobilized fraction was found, too (Molenaar et al. 2004). In contrast, the outer-shell protein REF2-II is only transiently immobilized in speckles. As we cannot rule out a contribution of incompletely spliced mRNA or long still nascent transcripts with multiple exons to the RNA component of the speckles, it is also conceivable that immobilization in speckles results from mRNPs arrested at or undergoing the second step of splicing. Indeed, the core proteins are also found in high salt-resistant spliceosomal C complexes, which catalyze the second step of splicing (Bessonov et al. 2008). Thus, we suggest that immobilization in speckles results from (pre)mRNA/protein assemblies that contain stably bound EJC inner-core factors, but no, or only loosely bound, outer-shell proteins (REF2-II, UAP56, NXF1), which drive export (Stutz et al. 2000; Zhou et al. 2000; Luo et al. 2001; Rodrigues et al. 2001). This model has important implications: the stabilization of EJC outer-shell proteins on the EJC core/mRNA assembly or completion of the splicing reaction including the removal of splicing factors should increase the mobility of the mRNP complex (Lin et al. 2005). Indeed there are splicing-associated candidates that could be considered as stabilization factors: the Drosophila NonA protein, which increases the mobility of NXF1 (Kozlova et al. 2006) or the helicase HRH1 (Zhang and Krainer 2007).
High mobility of EJC proteins in the nucleus
The diffusion properties of the proteins in a freely mobile state and/or integrated into complexes of different sizes were measured at high resolution using FCS and point FRAP. UAP56 produced an unusual autocorrelation function with a single, slow relaxation and a correlation time of more than 100 msec. The autocorrelation function suggests that UAP56 is bound to a large, yet flexible structure, which we propose to be the nascent pre-mRNA that is tethered to chromatin. FRAP experiments revealed slow exchange rates of UAP56, suggesting that the redistribution of UAP56 is dominated by dissociation of the nascent RNA from the transcription site. Although all other proteins investigated were reported to associate with pre-mRNA cotranscriptionally (Strasser et al. 2002), the atypical autocorrelation curve was not observed for either of them. We therefore suggest that REF2-II, Y14, Magoh, and NXF1 associate with the nascent transcript with high on and off rates. This conclusion can also be drawn from the FRAP data showing faster exchange rates of RNPS1, REF2-II, and Magoh compared to UAP56. It is in agreement with the conclusions of Custodio et al. (2004), that is, in vivo efficient processing rather than transcription promotes the formation of a stable EJC. In addition to the real diffusive component that could be identified with FCS, an additional fast exchange of the EJC factors due to rapid remodeling at rates similar to diffusion as it has been observed for non-shuttling SR proteins (Lin et al. 2005) could contribute to the recovery, resulting in a slightly reduced effective diffusion. For example, for REF2-II this could be clearly seen when comparing FCS and FRAP data. Another process that could contribute to the recovery is the transcription-induced emergence of a newly assembled complex. However, since the transition from transcription initiation to elongation can be considered rate limiting (Wade and Struhl 2008), the formation rate of exons is not faster than ∼1 sec−1, whereas the observed recovery rates are higher, ruling EJC de novo formation out as relevant for the recovery. Moreover, the FCS correlation functions were not in agreement with this process.
In the nucleus, regardless of the location, Y14, NXF1, and REF2-II all featured a fast-moving fraction with diffusion correlation times and apparent diffusion coefficients similar to NXF1Δ1-371, while their slow fractions had more than nine times higher diffusion correlation times. It is concluded that the fast-moving fractions are largely RNA free. They can be in a dynamic exchange with the slow fractions, which consist of molecules assembled into probably RNA-containing complexes. This view is supported by the absence of a slow component of REF2-II and Magoh after RNA depletion. Moreover, the apparent diffusion coefficients of both diffusive fractions found for Y14, Magoh, NXF1, and REF2-II, when considered jointly, are in good agreement with findings for other splicing factors and poly(A) RNA (Kruhlak et al. 2000; Molenaar et al. 2004; Politz et al. 2006).
The diffusion of the Y14/NXF1–BiFC complexes was significantly slower than the diffusion of Y14 and NXF1, showing its supramolecular nature. However, as the BiFC tags link the proteins irreversibly to one another, a validation of RNA-mediated NXF1 and Y14 complexes was required. Protein–protein interactions were measured in the cytoplasm, where the concentration of the single species was significantly lower. FCCS revealed that the two proteins interact in the cytoplasm, despite the assumption that NXF1 dissociates from export complexes at the nuclear pore (Lund and Guthrie 2005), but failed to track the Y14–NXF1 interaction in the nucleus, even in combination with RNAi-mediated knockdown of the endogenous proteins. Strikingly, no interaction between p15 and NXF1 in the nucleus was observed by FCCS although they form stable dimers. As FCCS relies on the formation of complexes between two labeled moieties, high concentrations of nonlabeled or labeled, but not incorporated binding partners impair cross-correlation (Strohner et al. 2005). This situation may be encountered here as no care was taken for balanced expression levels.
In combination with FCS and FRAP the RNA digestion experiments confirmed that the fast-moving fraction in untreated cells is not bound to RNA, as Magoh now moved with diffusion properties similar to NXF1Δ1-371. In contrast, the translocations of REF2-II were reduced in RNA-digested cells compared to the fast-moving fraction in untreated cells. This indicates that REF2-II is assembled into a larger complex that could involve factors of the transcription machinery or the EJC core and outer shell (Tange et al. 2005). It should be noted that we did not identify the RNA.
Taken together, FCS and FRAP showed that besides a significant fraction of immobilized EJC core proteins in speckles, the mobile part of the EJC proteins Y14, NXF1, and REF2-II consists of two moving fractions throughout the nucleus: a fast and freely diffusing and a slowly moving fraction, which can be considered as mRNP complex diffusing within the nucleus unless it becomes exported.
Dynamic properties of the EJC in the cytoplasm
Due to the high sensitivity of our detection system CP and FCS measurements could also be applied to measurements in the cytoplasm. CP revealed at least transient immobilization of Magoh, Y14, and UAP56 in the cytoplasm, which may be attributed to an involvement of the proteins in cytoplasmic targeting (Hachet and Ephrussi 2001; Le Hir et al. 2001; Meignin and Davis 2008). Cytoskeletal interaction via Y14 may also be the cause for the immobilization of the Y14/NXF1–BiFC complexes. Proteins not involved in cytoplasmic targeting (RNPS1, REF2-II, and NXF1) are present in a larger free fraction. The RNA digestion experiments revealed an increase of the cytoplasmic immobilization of REF2-II, which also participates in mRNA export (Stutz et al. 2000; Zhou et al. 2000). We conclude that RNA is required for the release of some factors from the mRNA and/or cytoplasmic binding sites. Indeed, in yeast it was reported that removal of the export factor Mex67 requires an RNA helicase, the activity of which might be reduced upon digestion of RNA flanking the complex binding sites (Lund and Guthrie 2005).
The diffusion properties as seen with FCS of all proteins are similar to those of NXF1Δ1-371 and compatible with free diffusion. As only one moving fraction was detected, the dissociation from RNA seems to occur rapidly. However, Y14 and NXF1 dimers codiffuse at similar rates (as seen with FCCS), demonstrating the existence of interacting Y14–NXF1 in the cytoplasm.
Model of mRNP formation in the nucleus and subsequent immobilization in speckles
Based on this work and other studies, we propose the model depicted in Figure 7. Splicing and mRNA processing events occur cotranscriptionally and can be in close spatial relationship to speckles (Misteli et al. 1997; Bentley 2005). Except for UAP56, the association of the pre-mRNA with EJC proteins at the transcription site is very dynamic with high on and off rates. During or after the second step of splicing, EJC core proteins sustain a stable grip on the mRNP and stabilize other factors of the EJC (Ballut et al. 2005; Bono et al. 2006; Zhang and Krainer 2007). When the EJC and export proteins immediately form a stable export-competent mRNP, passage through speckles is not required before export (Fig. 7, path A). mRNPs containing the EJC core, but with an incomplete or destabilized EJC outer shell, are retained in speckles (Fig. 7, path B), possibly involving the speckle localization signal of MLN51 (Degot et al. 2004). Speckle-retained transcripts also include those originating from genes containing many exons and introns and thus requiring several splicing events, which have not been completed (Fig. 7, path C). Release of the mRNPs from speckles requires a stable protein–RNA conformation or completion of splicing accompanied by the removal of nonshuttling SR proteins in order to allow the sound association with export-promoting factors (Lin et al. 2005). This step may further involve hnRNP proteins, proteins with helicase acitivity to displace splicing components or chaperones (Schroeder et al. 2004). In summary, mRNP accumulation in splicing speckles occurs prior to export and may be a consequence of the lack of EJC outer-shell proteins that drive export.
MATERIALS AND METHODS
Plasmids
Y14 was subcloned from pEYFP–Y14 (Schmidt et al. 2006) into pEGFP–C1 (ClonTech). To generate the mRFP–NXF1 and mRFP–NXF1Δ1-371 plasmids, the LacI insert of pSV2mRFP–LACI (a gift from M. Cristina Cardoso, Technical University of Darmstadt) was replaced with the NXF1 and NXF1Δ1-371, respectively. The plasmids GFP–UAP56, GFP–REF2-II (the mouse homolog of human REF/Aly), GFP–RNPS1, GFP–Magoh, and GFP–p15 were kind gifts from Eliza Izaurralde (Max Planck Institute for Developmental Biology). Plasmids pEYFP–NXF1 and pEYFP–NXF1Δ1-371 and the BiFC plasmids YN–NXF1 and YC–Y14 have been described previously (Schmidt et al. 2006).
Cell culture
Human MCF7 cells were cultured as previously described (Schmidt et al. 2006). For CP, point FRAP and FCS analysis, low-expressing stable cell lines were generated. Transiently transfected MCF7 cells were treated with 4 mg/mL G418 (Invitrogen Gibco) for several weeks. Fluorescent cells were FACS sorted and subcultured in medium supplemented with 0.5 mg/mL G418. The distribution pattern of stably expressed GFP–p15, GFP–REF2-II, GFP–Magoh, and GFP–Y14 corresponded to the pattern of transiently transfected cells (data not shown). UAP56 and RNPS1 were measured in transiently transfected cells, as the stable lines did not show the typical speckled pattern.
Transfections and live cell observations
Cells were seeded in conventional or in Lab-Tek chambered coverglasses (Nalge Nunc) and transfected with Effectene (Qiagen). Live cell observations were performed as described previously (Schmidt et al. 2006). Except for BiFC construct-expressing cells, which were maintained and measured at 30°C, measurements were performed at 37°C.
Sequences of the StealthRNAi molecules (Invitrogen) used to knock down endogenous Y14 and NXF1 were:
-
NXF1-for 5′-CCGAAGGACUUAGGUGCUUUGUGUA-3′;
-
NXF1-rev 5′-UACACAAAGCACCUAAGUCCUUCG G-3′;
-
Y14-for 5′-CACCAAGUCUAGACUUGAUGGUGUU-3′; and
-
Y14-rev 5′-AACACCAUCAAGUCUAGACUUGGUG-3′.
Control stealth RNAi molecules were from Invitrogen. Cells grown in a 2 mL cell culture dish were transfected with 1 μg RNAi oligos (diluted in 100 μL EC buffer, mixed with 8 μL enhancer and 10 μL effectene). Six hours after transfection of the cells with the RNAi molecules, cells were transfected with the plasmids and analyzed 24–48 h post-transfection.
QRT-PCR-based quantification of knockdown efficiency
RNA of MCF7 cells was prepared as described (Schmidt et al. 2006). The mRNA levels of NXF1 and Y14 were validated by quantitative real-time reverse transcriptase polymerase chain reaction (QRT-PCR). Primer pairs spanned exon–exon boundaries and were tested with genomic DNA. Primer sequences were:
-
GAAACTCCCTGTGTGACACCT (NXF1-e10-for);
-
GTAGTAACTTGGGAAATCGTTCG (NXF1-e11-rev);
-
CGGATGCGTGAGGATTATGAC (24-Y14-e3-for); and
-
GAGAATCCAGCCTTCAACAGA (25-Y14-e4-rev).
One microgram of total RNA from transfected cells and corresponding control was treated with one unit of DNase I (Invitrogen) at room temperature for 20 min. DNase I-treated RNA was used as a template for reverse transcription with the Superscript II first strand synthesis kit (Invitrogen). Each cDNA sample was analyzed in triplicate (30 ng each) using the 7900RT Fast Real-Time PCR System (Applied Biosystems) with Absolute SYBR Green ROX Mix (ABgene). Calculation of effectiveness, normalization to corresponding control RNA, and relative quantification versus Lamin B1 and PGK were done according to published algorithms (Pfaffl 2001).
Microinjection and detection of nascent RNA
Cells were microinjected with a computer-based microinjection system (CellBiology Trading). Microinjection needles with an inner diameter of 0.3–0.4 μm were produced from capillaries (Harvard Apparatus). Cells were injected with 100 mM BrUTP (in water) or 10 mg/mL RNase A (Qiagen, DNA-preparation grade, diluted in sodium phosphate buffer at pH 6.9) supplemented with 40 μg/mL propidium iodode (PI). After injection, cells were incubated for 20 min at 37°C, then either fixed for immunofluorescence or prepared for live cell imaging. Fixation and immunofluorescence were performed as previously described (Schmidt et al. 2006). Antibody dilutions were 1:50 mouse α-BrdU (Progen) and 1:200 FITC-labeled goat anti-mouse secondary antibody (Dianova). Coverslips were mounted with VectaShield (Linaris).
Confocal microscopy for imaging and imaging-based FRAP
Live cells were imaged at 37°C maintained by a stage incubation/heating system (Live Cell Instrument). Images were acquired on a Leica SP2 AOBS confocal laser scanning microscope (Leica Microsystems) either with a planapochromat 63X/1.2 NA water immersion objective lens (FCS, CP, point FRAP) or a 63X/1.32 NA oil immersion objective lens (imaging-based FRAP and fixed cells). GFP and FITC fluorescence were excited with the 488 nm line of an Ar laser and recorded with a 500–550 nm detection window. RFP and PI fluorescence were excited with a 561 nm DPSS laser or with a 594 nm HeNe laser and recorded with a 600–700 nm detection window. BiFC YFP fluorescence was excited with the 514 nm line of the Ar laser and recorded with a 520–585 nm detection window.
For imaging-based FRAP, we applied the approach already successfully used in previous studies (Schmidt et al. 2006). The post-bleach time was chosen so that the fluorescence intensity could recover completely.
F(C)CS, CP, and point FRAP acquisiton
In vivo F(C)CS, CP, and point FRAP data were acquired with the FCS2 extension of the Leica confocal microscope. As NXF1 does not accumulate to a significant amount in speckles, RFP–NXF1 and RFP–NXF1Δ1-371were measured in cells stably expressing GFP–Y14 in order to localize speckles. For FCCS, GFP–Y14 or GFP–p15 stable cell lines were cotransfected with the respective RFP–NXF1 constructs. Using the same excitation scheme as for imaging, fluorescence was detected with a 500–530 nm band-pass filter for GFP and a 607–683 nm band-pass filter for RFP.
For FCS and CP, continuous illumination with very low and medium intensity levels, respectively, was used. For point FRAP measurements, we modified the system in such a way that we could modulate laser intensities with a time resolution of 10 μs controlled by a separate computer. For pre- and post-bleach acquisition, we used low intensities similar to FCS measurements, whereas for bleaching, the intensity was chosen to be up to 100 times higher. The bleaching period was set to 0.5, 1, 5, 10, 30, 50, and 100 msec. A more detailed description will be available elsewhere.
F(C)CS data processing and analysis
The auto- and cross-correlation functions of F(C)CS raw data were computed using the software “Fluctuation Analyzer” written
in our laboratory, which allows to correct for slow processes, such as bulk photobleaching and cellular movements. The resulting
correlation curves were fitted individually with a two-component three-dimensional anomalous diffusion model with a single
blinking term (Wachsmuth et al. 2003) using Origin (OriginLab):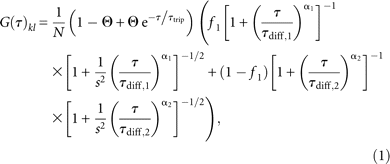 where G(τ)
kl
is the autocorrelation function in channel 1 for k = l = 1 and in channel 2 for k = l = 2 and the cross-correlation function for k = 1, l = 2. Furthermore, N stands for the average number of molecules in the focal volume, Θ for the fraction of molecules in a nonflurescent state,
τtrip for the lifetime of the nonfluorescent state, f for the fraction of a rapidly diffusing component and thus (1 – f) for a slowly diffusing component, τdiff,i for the diffusion correlation time, and α
i
for the anomaly parameter of component i = 1,2. This can be linked to an apparent diffusion coefficient Di
on the scale of the radius of the focus w
0 according to Di
= w
2
0/4τdiff,i. Resulting parameters from up to several tens of cells were averaged for the respective cellular locations, proteins, and
experimental conditions. In order to identify and characterize the formation of heterodimers, e.g., labeled with GFP and RFP,
we calculated the dynamic correlation coefficient of the signals in two channels based on the auto- and cross-correlation
amplitudes of the respective channels (Strohner et al. 2005) according to:
where G(τ)
kl
is the autocorrelation function in channel 1 for k = l = 1 and in channel 2 for k = l = 2 and the cross-correlation function for k = 1, l = 2. Furthermore, N stands for the average number of molecules in the focal volume, Θ for the fraction of molecules in a nonflurescent state,
τtrip for the lifetime of the nonfluorescent state, f for the fraction of a rapidly diffusing component and thus (1 – f) for a slowly diffusing component, τdiff,i for the diffusion correlation time, and α
i
for the anomaly parameter of component i = 1,2. This can be linked to an apparent diffusion coefficient Di
on the scale of the radius of the focus w
0 according to Di
= w
2
0/4τdiff,i. Resulting parameters from up to several tens of cells were averaged for the respective cellular locations, proteins, and
experimental conditions. In order to identify and characterize the formation of heterodimers, e.g., labeled with GFP and RFP,
we calculated the dynamic correlation coefficient of the signals in two channels based on the auto- and cross-correlation
amplitudes of the respective channels (Strohner et al. 2005) according to:
Theoretically, ratioG lies between zero, in the absence of any interaction, and 1 with exclusively double-labeled complexes; however, in real systems the accessible range is smaller and lies between 0.05 and 0.65 in our setup.
CP data processing and analysis
Typically 5–10 fluorescence time course data from CP measurements were averaged for the respective cellular locations, proteins,
and experimental conditions and subsequently fitted with a CP model function for a free and a bound fraction without association/dissociation
exchange using Origin: Here, F(0) is the initial fluorescence signal and f
bound is the lower limit of a joint transiently bound and immobilized fraction of molecules and thus (1 – f
bound) the upper limit for a freely diffusive fraction. The rate α characterizes bleaching of individual bound molecules in the
focus, whereas β stands for bulk bleaching of the whole pool of diffusive molecules.
Here, F(0) is the initial fluorescence signal and f
bound is the lower limit of a joint transiently bound and immobilized fraction of molecules and thus (1 – f
bound) the upper limit for a freely diffusive fraction. The rate α characterizes bleaching of individual bound molecules in the
focus, whereas β stands for bulk bleaching of the whole pool of diffusive molecules.
Point FRAP data processing and analysis
Typically, 10–15 separate FRAP measurements were normalized individually to the mean prebleach value and then averaged to get a single FRAP curve. To obtain the immobile fraction and the half-time of recovery we fitted the FRAP curves with an empirical equation composed of three exponential decay functions. Using the half-time of recovery, we obtained the diffusion time corresponding to the diffusion correlation time from FCS under the assumption that the laser intensity profile is Gaussian. In order to account for the effect of diffusion during bleaching on the post-bleach distribution, we extrapolated linearly the bleaching period-dependent half-times of recovery and the subsequently determined diffusion correlation times to infinitesimal bleach periods.
SUPPLEMENTAL DATA
Supplemental material can be found at http://www.rnajournal.org.
ACKNOWLEDGMENTS
We gratefully acknowledge the support of K. Fejes-Toth, F. Bestvater, and M. Weiss. We thank K. Knöpfle and L. Puccio for help with the Taq-Man analysis and J.S. Yong for technical help. We also thank P. Sommer, N. Cougot, M. Hentze, and the reviewers for valuable discussions and suggestions. We are grateful to C. Cardoso and E. Izaurralde for providing us with plasmids. U.S. was supported by a post-doctoral fellowship of the German Academic Exchange Service (DAAD; PKZ D/06/44332).
Footnotes
-
↵5 Present address: RNA Trafficking Group, Institut de Génétique Moléculaire de Montpellier CNRS-UMR 5535, 1919 Route de Mende, 34293 Montpellier Cedex 5, France.
-
Reprint requests to: Malte Wachsmuth, Cell Biology and Biophysics Unit, European Molecular Biology Laboratory, Meyerhofstraße 1, 69117 Heidelberg, Germany; e-mail: malte.wachsmuth{at}embl.de; fax: 49-6221-387-8512.
-
Article published online ahead of print. Article and publication date are at http://www.rnajournal.org/cgi/doi/10.1261/rna.1387009.
-
- Received September 23, 2008.
- Accepted January 30, 2009.
- Copyright © 2009 RNA Society




