


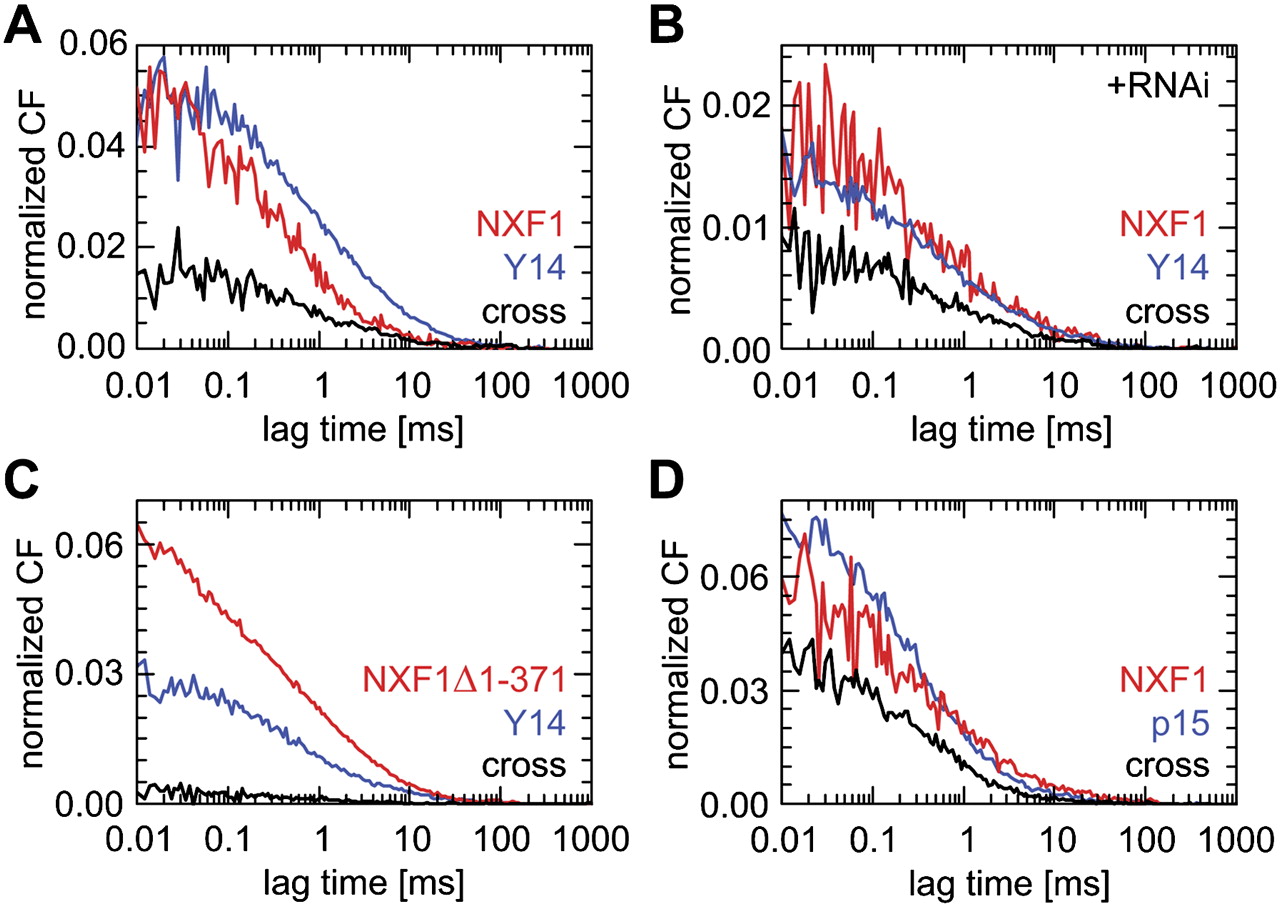
FIGURE 4.
Co-diffusion of Y14 and NXF1 measured with FCCS. (A) Cross correlation (black) between GFP–Y14 (blue) and RFP–NXF1 (red) was detected in the cytoplasm. (B) RNAi-mediated reduction of endogenous Y14 and NXF1 increased the relative cross-correlation amplitude (black). Corresponding autocorrelation functions are shown in red for RFP–NXF1 and in blue for GFP–Y14. (C) Cross correlation (black) between GFP–Y14 (blue) and RFP–NXF1Δ1-371 (red) was not detected, demonstrating that fluorescence cross talk did not contribute to FCCS. (D) Cross-correlation (black) between GFP–p15 (blue) and RFP–NXF1 (red) as detected in the cytoplasm.




