


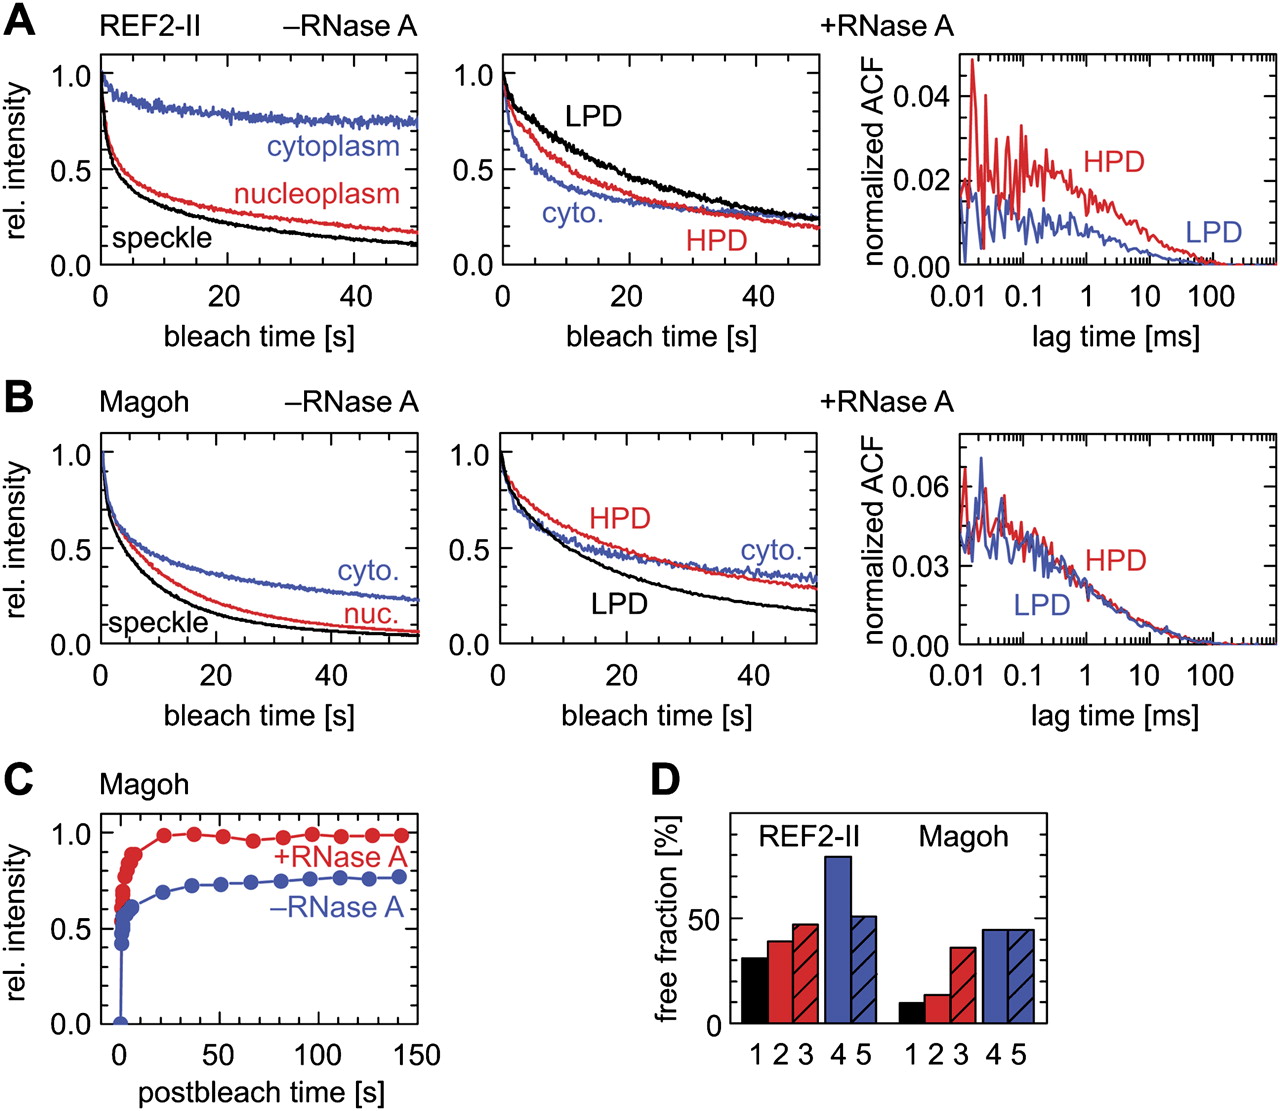
Mobility of GFP–Magoh and GFP–REF2-II in RNA-digested cells. Changes of the degree of immobilization and of the mobility of REF2-II and Magoh were measured in RNA-digested cells with CP, FCS, and FRAP and compared with untreated cells. (A) CP and FCS of REF2-II in RNA-digested cells. Left: CP was measured in speckles (black), the nucleoplasm (red), and the cytoplasm (blue) in control cells. Center: CP reveals an increase of the free fraction of REF2-II in the nucleus (high propidium iodide density region HPD: red and low propidium iodide density region LPD: black) and a decrease of the free fraction in the cytoplasm (blue) in RNase A-injected cells. Right: FCS of REF2-II after RNase A injection. (B) Same experiments as in A but with Magoh. (C) FRAP of Magoh in RNA-digested cells detected 99% free molecules and a half-time of recovery similar to that of untreated cells (red: RNA digested cells, average of n = 8 cells; blue: untreated cells, average of n = 18 cells). (D) Bar chart summarizing the free fractions of REF2-II and Magoh before and after RNA digestion. 1: speckle before digest; 2: nucleoplasm before digest; 3: averaged over HPD and LPD (referred to as “nucleus”) after digest; 4: cytoplasm before digest; and 5: cytoplasm after digest.




