


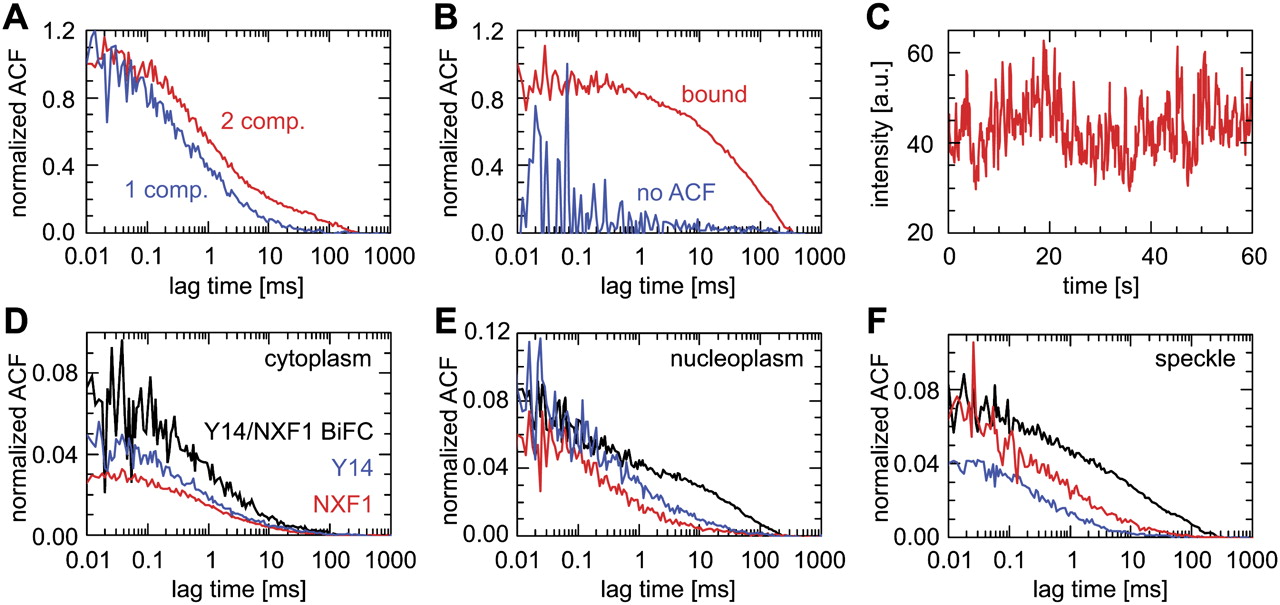
FCS of EJC proteins. (A) Examples of obtained autocorrelation curves: autocorrelation function (ACF) representing one moving component with free, yet anomalous diffusion (blue; GFP–Y14 in the cytoplasm) or two moving components (red; GFP–Y14 in speckles). (B) Example of an FCS experiment not showing correlated movements (blue; GFP–Magoh in nucleoplasm) and an autocorrelation curve with a single, very slow fluorescence decay, which was considered as being associated with nucleoplasmic components, such as chromatin (red; GFP–UAP56 in speckles). (C) Intensity time trace used for the calculation of ACFs showing very slow fluorescence decays to demonstrate that the decay is not a photobleaching artifact. (D–F) Comparison of the ACF of Y14/NXF1–BiFC complexes (black) with GFP–Y14 (blue) and RFP–NXF1 (red) in (D) the cytoplasm, (E) the nucleoplasm, and (F) speckles. The examples of the Y14 and NXF1 autocorrelation curves were obtained from the same cell stably expressing GFP–Y14 and transiently coexpressing RFP–NXF1. BiFC curves were measured in MCF7 cells transiently expressing the BiFC plasmids YC–Y14 and YN–NXF1.




