


A method of comprehensive sequencing analysis of the small RNA fragmentome (RiboMarker)
- Rachel C. Clark1,
- Aidan C. Manning1,
- Jonathan M. Howard,
- Sergio Barberán-Soler and
- Sergei A. Kazakov
- Corresponding author: skazakov{at}realseqbiosciences.com
-
↵1 These authors contributed equally to this work.
-
Handling editor: Javier Caceres
Abstract
Small RNAs and RNA fragments (sRNAs) found in blood and other biofluids have emerged as promising biomarkers for cancer and other pathologies. Sequencing analysis of sRNAs representing the entire RNA fragmentome could improve understanding of their roles in cancer development and be used for discovery of new biomarkers, cancer detection, and personalized treatment management. Conventional methods of sRNA-seq library preparation are limited to detection of sRNAs with 5′-P and 3′-OH ends (sRNA Type 1) that represent only ∼10% of the whole RNA fragmentome, whereas sRNA Types having other termini are hidden. Although recently developed sRNA-seq methods provide detection of some or all hidden sRNAs, these methods cannot both detect all and distinguish between sRNAs of different RNA Types. Here we describe the RiboMarker approach for preparation of sRNA sequencing libraries that addresses these shortcomings. It uses distinctive enzymatic pretreatment(s) providing conversion between the RNA termini that can enrich for or deplete specific sRNA type(s) upfront of the universal method of library preparation. To monitor the efficacy of these pretreatments, we leveraged a pool of synthetic RNAs of different RNA Types and lengths spiked in brain or plasma RNA samples. This allows identification and analysis of relative abundance, sequencing profiles, and RNA Types of naturally occurring sRNAs representing different RNA classes. Using the RiboMarker approach, we demonstrated its capability to enhance the capacity and sensitivity of distinguishing between plasma RNA samples from different donors (simulating healthy individuals and cancer patients) by selecting and using sRNAs of specific RNA Type(s).
Keywords
- small RNA
- RNA fragments
- cell-free RNA
- RNA circularization
- RNA ends conversion
- sequencing library preparation
INTRODUCTION
Cell-free RNAs (cfRNAs) are emerging as a source for potent diagnostic, prognostic, and predictive biomarkers that can provide higher sensitivity and specificity for cancer detection compared to cell-free DNAs that are currently considered as benchmark cancer biomarkers (Fish et al. 2018; Pardini et al. 2019; Ning et al. 2023; Tao et al. 2023). Tumor-associated cfRNAs (ctRNAs) are released from malignant (both dead and alive) and normal cells surrounding the tumor and providing immune response to cancer (Cabús et al. 2022; Liu et al. 2023). The ctRNAs are transcribed in multiple copies from various genomic DNA regions including the ones that are only transcriptionally active in cancer cells (Larson et al. 2021; Vibert et al. 2022). Dysregulated RNA post-transcriptional events (including alternative splicing and formation of chimeric RNAs) that are detectable only in the transcriptome also contribute to the higher complexity of the ctRNA landscape (Cabús et al. 2022; Ning et al. 2023; Wang et al. 2024).
Most of the cfRNA molecules (∼95%) found in circulation (e.g., in human plasma) are small RNAs and RNA fragments of <45 nucleotides (nt) in length, hereinafter together referred to as sRNA (Akat et al. 2019; Galvanin et al. 2019; Giraldez et al. 2019; Wang et al. 2024). sRNAs are processed from the longer, parent RNA transcripts of various RNA classes by one or more intracellular and/or extracellular ribonucleases (RNases) through one or more RNA cuts that can be site-specific or semi-random (Shi et al. 2022; Shigematsu and Kirino 2022; Chen and Zhou 2023; Lai et al. 2023; Tosar et al. 2024). Protective RNA–protein complexes, encapsulation into naturally occurring lipid extracellular vesicles (EVs), and/or RNA secondary structures help prevent further cleavage of processed sRNAs released from cells into circulation (Crocker et al. 2022; Shi et al. 2022; De Sota et al. 2024; Tosar et al. 2024). Most extracellular sRNAs are found outside EVs (Tosar et al. 2020; Jia et al. 2021). Furthermore, RNA molecules can undergo spontaneous cleavage in vitro during preparation, isolation, storage, handling, and enzymatic reactions (AbouHaidar and Ivanov 1999; Chheda et al. 2024). Depending on the mechanisms of the parent RNA cleavage and naturally occurring parent RNA termini, the processed sRNAs may feature specific combinations of RNA 5′ and 3′ ends (hereafter called RNA Types) having different phosphorylation states (Fig. 1).
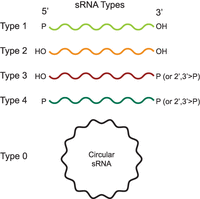
RNA Types representing small RNA molecules and RNA fragments (sRNAs) having different phosphorylation states of their ends (Types 1–4) or their circular form (Type 0) with no ends.
Most known sRNA sequences are assigned to the main RNA classes including ribosomal RNA (rRNA), transfer RNA (tRNA), microRNA (miRNA), small nuclear RNA (snRNA), small nucleolar RNA (snoRNA), messenger RNA (mRNA) (including exons and UTRs), long noncoding RNA (lncRNA), and Piwi interacting RNA (piRNA) (Vickers et al. 2015; Hulstaert et al. 2020). Until recently, the biological analyses and clinical applications of sRNAs have been primarily focused on miRNA (Wang et al. 2018; Pardini et al. 2019; Wu et al. 2021). However, there are other sRNA classes that harbor similar or greater potential than miRNAs to influence and assess the state of a disease (Vickers et al. 2015; Akat et al. 2019; Yao et al. 2020; Cabús et al. 2022; Liu et al. 2022). For example, multiple overlapping sequences of sRNAs processed from mRNA and lncRNA contain information about biological phenotypes that inform about tissues of cancer origin and cancer subtypes (Akat et al. 2019; Giraldez et al. 2019; Larson et al. 2021; Chen et al. 2022; De Sota et al. 2024). Also, sRNAs with unique (defined) sequences processed from tRNAs (Wang et al. 2022; Chen and Zhou 2023; Di Fazio and Gullerova 2023), snRNAs (Pardini et al. 2019; Su et al. 2022), and snoRNAs (Gao et al. 2024) have been identified as potential cancer biomarkers.
Standard methods for sRNA-seq library preparation capture only RNA Type 1 [5′-P and 3′-OH] including miRNAs and some other sRNAs having the same ends (Kawaji et al. 2008; Jackowiak et al. 2017; Max et al. 2018; Shi et al. 2021b; Wang et al. 2024), whereas RNA Type 2 [5′-OH and 3′-OH], RNA Type 3 [5′-OH and 3′-P], and RNA Type 4 [5′-P and 3′-P] are not incorporated into sequencing libraries (Crocker et al. 2022; Shi et al. 2022; Shigematsu and Kirino 2022). However, the sRNAs with 3′-OH ends (RNA Types 1 and 2) account for only ∼10% of the human cellular RNA fragmentome, while sRNAs having 3′-phosphorylated ends (RNA Types 3 and 4) are “hidden” and cannot be detected by these methods (Lai et al. 2023). Moreover, some sRNAs (e.g., tRNA fragments) contain modified 5′-end (e.g., 5′ cap) or internal nucleotide(s) that can interfere with reverse transcription, which prevents or allows only partial incorporation of these sRNA sequences into libraries (Crocker et al. 2022; Shi et al. 2022; Verwilt et al. 2023; Wang et al. 2024).
Current methods for detecting these hidden sRNAs by sequencing could be divided into two groups. The first group uses wild-type T4 polynucleotide kinase (PNK), which has both phosphatase and kinase activity in the presence of ATP, for treating sRNAs to erase differences between the phosphorylation states of the sRNA ends by converting them to the RNA Type 1 form (Akat et al. 2019; Galvanin et al. 2019; Giraldez et al. 2019; Crocker et al. 2022; Liu et al. 2022; Shi et al. 2022; Shigematsu and Kirino 2022; Solaguren-Beascoa et al. 2023). Although this approach allows simultaneous analysis of all RNA Types and RNA classes, the generated sRNA sequencing libraries contain very high proportions of rRNA fragments that overshadow the other RNA classes. While deep sequencing and/or commonly used rRNA depletion prior to sequencing library preparation could assist in the identification of low abundant sRNAs representing other RNA classes, such approaches significantly decrease the sensitivity and precision of their detection. The second group focuses exclusively on sRNAs with specific RNA ends such as 5′-OH, 3′-OH, 3′-P, or 2′,3′>P and cannot distinguish between the phosphorylation state at the opposite 5′ or 3′ end (Peach et al. 2015; Honda et al. 2016; Jia et al. 2021; Kugelberg et al. 2021; Crocker et al. 2022; Del Piano et al. 2022; Shi et al. 2022; Shigematsu and Kirino 2022; Lai et al. 2023). Except for RNA Type 1, none of these library preparation methods can specifically detect and compare individual sRNAs of Types 2, 3, and 4, representing the absolute majority of sRNAs as indicated above. Moreover, these known methods cannot detect all sRNA Types simultaneously and distinguish each individual Type specifically while using the same protocol for the preparation of sequencing libraries. Because of these method-specific biases (Zhuang et al. 2012a; Wright et al. 2019; Shi et al. 2021a), relative abundances of the different sRNA Types determined by different methods of library preparation cannot be accurately compared. Furthermore, all these reported methods require purification of intermediate reaction products, for example, by gel-electrophoresis, phenol–chloroform or TRIzol extraction, and ethanol precipitation (Akat et al. 2019; Giraldez et al. 2019; Kugelberg et al. 2021; Shi et al. 2021a; Del Piano et al. 2022; Lai et al. 2023; Solaguren-Beascoa et al. 2023), which leads to unavoidable loss of RNA during purification, limiting sensitivity and reproducibility of sRNA quantification by sequencing.
To address these shortcomings, we developed the RiboMarker platform that enables comprehensive profiling of total sRNA content in biological samples, including the detection of all RNA Types simultaneously and discrimination of the individual Types. RiboMarker uses distinctive enzymatic pretreatment(s) of RNA samples, determining the sRNA Type(s) to be sequenced upfront of a universal (the same for all different pretreatment protocols) library preparation protocol. It has the potential capability to both identify and then detect with enhanced sensitivity low abundance sRNAs (e.g., biomarkers for minimal residual disease or cancer at early stages).
RESULTS AND DISCUSSION
Design of RiboMarker platform
The RiboMarker platform has two key components. The first key component is a customizable group of RNA enzymatic pretreatment(s) that enriches for the specific sRNA Type(s) of interest while depleting other Type(s) in sequencing libraries. The RNA Type(s)–specific pretreatment protocols are schematically presented in Table 1. We applied column-based purification after each pretreatment step to concentrate reaction products, to exchange buffers, and to remove undesirable enzymes, which may interfere with the next reaction step.
Selected RNA Type–specific protocols for the preparation of RiboMarker sequencing libraries
Protocol T[1 + 2] provides the detection of RNA Types 1 and 2 simultaneously. This protocol is also used as a universal library preparation method in combination with all the other pretreatment steps described below.
Protocol T[2] has been designed to enrich for and detect RNA Type 2 with a single pretreatment by a mix of T4 RNA ligase 1 (Rnl1) and T4 RNA ligase 2 (Rnl2). This pretreatment results in the circularization of RNA Type 1 by ligating their 5′-P and 3′-OH ends and preventing incorporation of such RNA into the sequencing libraries.
Protocol T[1 + 2 + 3 + 4] has been designed to detect all RNA Types (Types 1, 2, 3, and 4) with a single pretreatment using T4 polynucleotide kinase (PNK) at pH 6.0 in the absence of ATP. Such pretreatment results in specific dephosphorylation of 3′-P or 2′,3′-cyclic phosphate (2′,3′>P) ends in RNA Types 3 and 4 without affecting the 5′ ends of RNA Types 1 and 2.
Protocol T[3 + 4] has been designed to enrich for and detect RNA Types 3 and 4 with two sequential pretreatment steps, including (i) simultaneously run in one mixture reaction with PNK mutant having no 3′-end phosphatase activity (PNK, 3′-minus) in the presence of ATP at pH 7.6 to phosphorylate 5′ ends of RNA Types 2 and 3, converting them to RNA Types 1 and 4, respectively, and with Rnl1 + Rnl2 mix to circularize RNA Type 1 excluding them from the sequencing library; and (ii) by PNK at pH 6.0 in the absence of ATP to dephosphorylate 3′ ends of former RNA Type 3 (converted to RNA Type 4) and original RNA Type 4 converting both of them to RNA Type 1.
Protocol T[3] has been designed to enrich for and detect RNA Type 3 with three sequential treatment steps, including: (i) by Terminator 5′-Phosphate-dependent exonuclease, which specifically digests RNA Types 1 and 4 having 5′-P ends excluding them from sequencing libraries; (ii) simultaneously run in one mixture reaction with PNK, 3′-minus in the presence of ATP at pH 7.6 to convert RNA Types 2 and 3, to RNA Types 1 and 4, respectively and Rnl1 + Rnl2 mix to circularize RNA Type 1 excluding them from the sequencing library; and (iii) by PNK at pH 6.0 in the absence of ATP to dephosphorylate 3′ ends of former RNA Type 3 (converted to RNA Type 4) converting these to RNA Type 1.
Protocol T[4] has been designed to enrich for and detect RNA Type 4 with three sequential pretreatment steps, including (i) by RtcB ligase to circularize RNA Type 3 through ligation of its 5′-OH and 3′-phosphorylated ends and preventing their incorporation in the sequencing libraries; (ii) simultaneously run in one mixture reaction with PNK, 3′-minus in the presence of ATP at pH 7.6 to phosphorylate 5′ ends of RNA Type 2, and Rnl1 + Rnl2 mix to circularize RNA Type 1 and former RNA Type 2 converted to RNA Type 1; and (iii) by PNK at pH 6.0 in the absence of ATP to dephosphorylate of 3′ ends of RNA Type 4.
The second key component of the RiboMarker platform is the universal library preparation protocol T[1 + 2], compatible with all the pretreatment steps described above. This protocol is based on the original RealSeq platform technology for preparation of small RNA sequencing libraries (Barberán-Soler et al. 2018) that is commercially available as RealSeq-Biofluids. The protocol T[1 + 2] workflow is schematically shown in Supplemental Figure S1, and its experimental details are described in Materials and Methods. A recent systematic evaluation of commercially available small RNA-seq library preparation kits selected the RealSeq platform for further development of the small RNA sequencing pipeline for absolute quantitation based on the sensitivity, consistency of detection of miRNAs, low bias toward different miRNAs, as well as usability criteria (Khamina et al. 2022). This protocol can simultaneously capture RNA Types 1 and 2 (Shigematsu and Kirino 2022), which allows detection of a higher variety of specific small RNAs than the standard methods of small RNA-seq library preparation (specific to RNA Type 1). The RiboMarker approach could also be combined with these standard methods using alternative pretreatment protocols suggested in Supplemental Table S1.
RNAs utilized for RiboMarker development
In this study, we utilized synthetic RNAs and naturally occurring RNAs isolated from commercially available human brain and human plasma samples (see Materials and Methods).
To optimize and monitor the efficacy of conversion between the different RNA Types, we leveraged a pool of synthetic spike-in sRNAs corresponding to specific Types of sRNAs (stsRNAs). The stsRNA sequences are shown in Table 2. The stsRNA features are as follows: (i) different lengths (20, 30, 40, 50, and 60 nt), (ii) 6 nt internal RNA Type–specific barcodes, (iii) 4 nt randomized nucleotides at both ends, and (iv) different termini corresponding to sRNA Types 1–4 shown in Figure 1. The core sequences of these stsRNAs (excluding the random and barcode sequences), which do not have homology with the human genome and do not form strong secondary structures, were adapted from Locati et al. (2015). A placement of four randomized nucleotides on both the 5′ and 3′ ends of stsRNAs was adapted from Lutzmayer et al. (2017). Equimolar pools of these 20 (4 Types × 5 lengths) individual stsRNAs were spiked in brain or plasma RNA samples at different inputs before pretreatments and/or preparation of sequencing libraries. We determined that the optimal inputs of the stsRNA pool were from 1%–5% sequencing reads relative to naturally occurring RNA samples, which allowed robust identification and quantification of stsRNAs along with the analysis of naturally occurring sRNA sequencing profiles. The developed pretreatment protocols result in stsRNA conversion between different RNA Types without shortening stsRNA lengths or causing their fragmentation.
Sequences of spike-in RNAs (stsRNAs) having barcodes (underlined) specific to each RNA Type
For naturally occurring RNAs, we used a high input (50 ng) of brain total RNA and low input of total plasma RNA equivalent to 83 µL of plasma volume (see more details in Materials and Methods). The brain and plasma RNA samples spiked with the stsRNAs were utilized for different aspects of the development of the RiboMarker approach. For all tested conditions, technical triplicate sequencing libraries were made with the brain RNA. The amount of plasma RNA was selected based on the minimum volume of available plasma from individual donors that allowed the use of equal plasma RNA inputs across experiments. We used plasma samples from 10 different individuals that were grouped into four cohorts (A, B, C, and D) based on the plasma source vendor and known pathology (Supplemental Table S2). For the A, B, and D cohorts, the plasma RNA samples from the three individuals of each cohort were considered biological replicates. A single plasma sample from the C cohort was available in a large enough volume to be used as technical replicates. Most figures present data for representative RNA samples displaying average sequencing profiles from the replicates shown in Supplemental Figures.
Implementation of RNA circularization in the RiboMarker platform
The RiboMarker approach exploits circularization reactions catalyzed by an RNA ligase for two different purposes. First, it is applied in the sequencing library preparation protocol T[1 + 2] (Supplemental Fig. S1), where sRNAs are first ligated to the sequencing combo adapter (CAD) and then sRNA–CAD ligation products are circularized. In contrast to similar methods of sequencing library preparations based on circularization of cDNAs (Kwon 2011; Jackson et al. 2014; Heyer et al. 2015), our approach allows sequencing of full-length sRNAs rather than their RT cDNA products. The RNA circularization steps are also used in the pretreatment protocols (Table 1), where sRNAs are circularized to block the sRNA ends preventing adapter ligation and incorporation of “unwanted” RNA into the sequencing libraries.
Although rates of RNA “intermolecular” ligation reactions catalyzed by Rnl1 are strongly dependent on the identity of terminal nucleosides at 5′-P and 3′-OH ends involved in these reactions (England and Uhlenbeck 1978; Ohtsuka et al. 1980; Romaniuk et al. 1982), the RNA circularization (“intramolecular” ligation) reactions exhibit less bias to the identity of terminal nucleosides and a presence of ribose 2′-O-methyl modification (2′-OMe) at the RNA 3′-end, depending mostly on RNA length and folding (Silber et al. 1972; Cranston et al. 1974; Kaufmann et al. 1974; Kumar et al. 2011; Del Piano et al. 2022). Although the generation of concatenated ligation products through intermolecular reactions may also occur concurrently with RNA circularization (Hafner et al. 2011; Chu et al. 2015), the circularization reaction greatly predominates for RNAs shorter than 60 nt (Uhlenbeck and Gumport 1982; Harrison and Zimmerman 1984) and can be additionally promoted by dilution of the ligation reaction mixtures (Obi and Chen 2021). Similar techniques were adapted for circularization-based methods of sRNA-seq library preparation (Chu et al. 2015; Gout et al. 2017; Barberán-Soler et al. 2018; Bradley et al. 2024). In comparison to the intermolecular ligation of adapters to 5′-P ends of sRNAs in dual-adapter ligation methods, which has significant biases (Hafner et al. 2011; McCormick et al. 2011), the single adapter and circularization-based approach used in the RealSeq platform (Supplemental Fig. S1) significantly reduces this bias (Barberán-Soler et al. 2018).
Evaluation of circularization-based RiboMarker sRNA sequencing library preparation method
We started development of the RiboMarker platform with an assessment of the universal protocol T[1 + 2] and its capability to capture stsRNAs of different lengths by analyzing sequencing length profiles (sequencing read count vs. length of sequences), while the stsRNA Types were identified by sequences of stsRNA barcodes.
Separate stsRNA libraries were prepared by protocol T[1 + 2] for stsRNAs in the absence of naturally occurring RNAs (mock controls) (Fig. 2A, left panel; Supplemental Fig. S2A) or for stsRNAs spiked into total RNA isolated from either brain (Fig. 2B, left panel) or representative A and B cohorts’ plasma (Fig. 2C,D, left panels) RNA samples. Our data demonstrated that protocol T[1 + 2] captured similar percentages of stsRNA Type 1 and Type 2, whereas only marginal percentages of stsRNA Type 3 and Type 4 were included in the sequencing libraries (Fig. 2A–D, left panels; Supplemental Table S3). Triplicate sequencing length profiles demonstrated no significant variations between the ratios of the RNA Types for the stsRNAs of the same lengths when the stsRNAs were spiked into either brain (Supplemental Fig. S3A) or into A or B cohort of plasma RNA samples (Supplemental Fig. S4). However, we noticed two phenomena related to differences in the sRNA profiles among the tested samples. The first phenomenon was small differing average ratios of stsRNA Type 1 and Type 2 of all lengths in the mock controls (Type 2 ∼ Type 1) or when they were spiked into total RNA from brain (Type 1 > Type 2) and plasma (Type 2 > Type 1) samples (Fig. 2A–D, left panels; Supplemental Table S3). In principle, a competition between naturally occurring sRNAs and synthetic stsRNAs of the same RNA Types present at different molecular ratios in brain and plasma samples could explain the Types ratio phenomenon. The second phenomenon was related to the differential capture of the stsRNAs of different lengths spiked into brain (20 ≥ 30 > 40 > 50 ≫ 60 nt) and plasma (40 > 20 ≈ 30 > 50 > 60 nt) RNA samples (Fig. 2B–D, left panels). Although the differential capture of stsRNA lengths was minimal between the mock control and brain samples, the differences in stsRNA lengths between brain and plasma RNA samples were more pronounced. We hypothesized that opportunistic folding and cofolding of stsRNAs having randomized ends with natural sRNAs, which is length, structure, and concentration dependent, may affect enzymatic reactions of RNA molecules at their ends as previously proposed (Zhuang et al. 2012a; Maguire et al. 2020). Regardless of the mechanism of these phenomena, protocol T[1 + 2] provides the capability for robust quantification of sRNAs ≤50 nt in human plasma samples, where 95% of extracellular sRNAs are <45 nt in length (Akat et al. 2019; Galvanin et al. 2019; Giraldez et al. 2019; Wang et al. 2024).
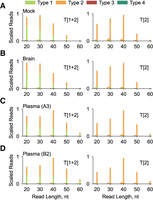
Sequencing length and RNA Type profiles for (A) stsRNAs in the absence of naturally occurring RNAs (mock controls), (B) stsRNAs spiked into brain RNA, and (C,D) stsRNAs spiked into representative A and B cohorts’ plasma RNA samples for the libraries prepared by protocols T[1 + 2] (left panels) and T[2] (right panels).
Circularization of small RNAs prevents their incorporation into sequencing libraries
sRNA circularization has been previously used for the detection of sRNAs by RT-qPCR (Kumar et al. 2011) and sequencing (Chu et al. 2015; Gout et al. 2017; Barberán-Soler et al. 2018; Bradley et al. 2024). In this study, we applied it to exclude selected sRNA Types (Fig. 1) from sequencing libraries. Following the circularization of sRNA Type 1, the termini of selected noncircularized sRNA Types are converted into Types 1 and/or 2 in the next pretreatment step(s), and then these converted sRNAs are either also excluded by circularization or incorporated into sequencing libraries using the universal protocol. In doing so, the exclusion of highly abundant sRNA Types from the libraries allows for a more sensitive detection of rare sRNA of other Type(s). This new exclusion-by-circularization approach could also be used along with other methods of sequencing library preparation that rely on the ligation of adapter(s) to RNA end(s) or on 3′-end extension by a ribonucleotidyl transferase (Crocker et al. 2022; Shi et al. 2022; Shigematsu and Kirino 2022; Wang et al. 2024).
Protocol T[2] features a circularization step in which the abundance of RNA Type 1 is decreased while RNA Type 2 is increased. To find the most efficient conditions for this circularization step, we used the stsRNA pool spiked into brain RNA samples at 37°C in standard T4 RNA ligase reaction buffer supplemented with 10% PEG 8000, 20 U Murine RNase Inhibitor (all NEB), and 100 µM ATP with the following variables: 10 U Rnl1 for 1 h (Rnl1_1h); 20 U Rnl1 for 1 h (2xRnl1_1h); 20 U Rnl1 for 2 h (2xRnl1_2h); and 10 U Rnl1 + 10 U Rnl2 for 1 h (Rnl1 + Rnl2_1h). The Rnl1 + Rnl2 combination was tested because of the ability of both Rnl1 and Rnl2 to circularize RNA Type 1 (Ho and Shuman 2002; Ho et al. 2004; Yin et al. 2004) and a potential synergy between these two enzymes having different structural and end-nucleotide biases for ligation of cofolded RNA ends (Yoshinari et al. 2017; Chen et al. 2020). Sequencing analysis of these different versions of protocol T[2] for the efficiency of RNA Type 2 enrichment revealed that the “Rnl1 + Rnl2_1h” reaction condition provided 90.91% ± 0.19% yield of stsRNA Type 2 in the brain RNA samples and 93.50% ± 0.51% in the A cohort and 93.90% ± 0.24% in the B cohort plasma RNA samples (Supplemental Table S4). The corresponding stsRNA length profiles demonstrated high reproducibility for the brain (Supplemental Fig. S3B) and A and B cohorts’ plasma (Supplemental Fig. S5) RNA samples. The mock controls performed in the absence of naturally occurring RNA resulted in a 91.53% ± 0.23% yield of stsRNA Type 2 (Supplemental Tables S4, S5).
Although two other circularization reaction conditions “Rnl1_1h” and “2xRnl1_1h” provided only marginally smaller yields (90.59% ± 0.28% and 89.71% ± 0.02%, respectively) of stsRNA Type 2 in the brain RNA samples in comparison to the selected condition, these conditions also produced higher percentages of Rnl1 reaction side products (stsRNA Types 3 and 4) than the “Rnl1 + Rnl2_1h” condition (Supplemental Table S4; Supplemental Fig. S6). The most prominent amounts of stsRNA Type 3 products (8.25% ± 0.03%) were produced under the “2xRnl1_2h” conditions (Supplemental Table S4). Evidently, the stsRNA Types 3 and 4 were products of the known Rnl1 reverse reaction causing removal of single mononucleotide diphosphates (5′-P-N-3′-P or 5′-P-N-2′,3′>P) from the 3′-end-phosphorylated RNA molecules (Krug and Uhlenbeck 1982; Uhlenbeck and Gumport 1982). The sequencing length profiles confirmed that this side reaction indeed removes a single terminal nucleotide from the 3′ ends of stsRNA Types 3 and 4 that makes them shorter by 1 nt and converts them to stsRNA Types 2 and 1, respectively, allowing their incorporation into sequencing libraries (Supplemental Fig. S6). The higher percentage of sequencing reads for stsRNA Type 3 (converted by Rnl1 to a 1 nt shorter Type 2) in comparison to stsRNA Type 4 (converted to a 1 nt shorter Type 1) is because stsRNA Type 1 can then be circularized by Rnl1 and, therefore, excluded from the library.
Based on the above results, we selected the “Rnl1 + Rnl2_1h” reaction condition to be used for the RNA Type 1 circularization in protocols T[2], T[3 + 4], T[3] and T[4]. In contrast to protocol T[1 + 2], the stsRNA sequencing length profiles for protocol T[2] were similar across the tested samples, including the mock controls of stsRNAs performed in the absence of naturally occurring RNA (Fig. 2A, right panel; Supplemental Fig. S2B), brain (Fig. 2B, right panel), and representative A and B cohorts’ plasma RNA samples (Fig. 2C,D, right panels). The average percentage of stsRNA Type 2 in the A cohort plasma RNA samples were found to slightly increase with increasing stsRNA length from 88.48% ± 1.32% (20 nt) to 92.78% ± 0.43% (30 nt) and 96.42% ± 0.22% (40 nt), held at 95.21% ± 0.44% (50 nt), and then dropped to 86.39% ± 1.00% (60 nt) (Supplemental Table S7). By comparing the percentage of stsRNA Type 1 reads of different lengths in the A cohort plasma RNA samples using protocols T[1 + 2] (Supplemental Table S6) and T[2] (Supplemental Table S7), we were able to evaluate both the extent of stsRNA Type 1 reduction from sequencing libraries and the corresponding efficiency of their circularization. We calculated the reduction for each stsRNA length for the A cohort plasma RNA samples by subtracting the corresponding stsRNA Type 1 percentages found with protocol T[2] from those with protocol T[1 + 2] and then dividing the differences by the Type 1 percentages for protocol T[1 + 2] (Supplemental Table S8). The found reductions of stsRNA Type 1 of different lengths were as follows: 79.85% (20 nt), 83.30% (30 nt), 89.05% (40 nt), 87.90% (50 nt), and 74.02% (60 nt). These results indicated that we were able to achieve high efficiency of stsRNA Type 1 reduction through circularization of stsRNA regardless of their lengths and termini sequences.
The efficiency of the sRNA circularization reaction could be further increased by optimizing the reaction buffer composition since Rnl1 and Rnl2 have different optimal concentrations of Mg2+ and reaction buffer pH (Ho et al. 2004; Yin et al. 2004; Viollet et al. 2011). Also, adding dimethyl sulfoxide (DMSO), a mild denaturant that disrupts secondary structures limiting the accessibility of RNA ends for the ligase, could enhance RNA circularization efficiency, similar to the DMSO effect on intermolecular RNA ligation (Romaniuk and Uhlenbeck 1983). Alternatively, thermostable RNA ligases like CircLigase could be used for circularizing heat-denatured RNA molecules at 60°C (Kumar et al. 2011). However, under this high-temperature reaction, unfolding RNA structures can also lead to unintended sRNA fragmentation.
Detection of naturally occurring RNA Types 1 and 2
After our assessment of the synthetic stsRNAs, we analyzed sequencing length profiles for the major RNA classes of naturally occurring sRNAs in the same brain and plasma RNA samples processed using protocols T[1 + 2] and T[2]. For the brain RNA samples, a comparison of the sRNA profiles showing all major RNA classes simultaneously for protocol T[1 + 2] (Supplemental Fig. S7A, left panel) and protocol T[2] (Supplemental Fig. S7A, right panel) confirmed the efficiency of depletion of sRNA Type 1 as shown by the reduction of the miRNA fraction in the protocol T[2] profiles. A subtraction of the normalized sequencing length profiles for protocol T[2], which is specific for RNA Type 2, from the profile for protocol T[1 + 2], which is specific for RNA Types 1 and 2, enables the identification of sequencing length profiles for the depleted sRNA Type 1. Using this approach, we found that most of the sRNA Type 1 in the brain sample were represented by miRNAs as well as fragments of tRNAs and rRNAs (Supplemental Fig. S8). In comparison to the brain sRNA (Supplemental Fig. S7A), the sequencing length profiles for representative A and B cohorts’ plasma RNA samples were comprised of a larger fraction of ultrashort sequences (<20 nt) for both protocols T[1 + 2] and T[2] (Supplemental Fig. S7B,C). Except for the depletion of miRNA sequences in the brain and plasma sRNA profiles for protocol T[2], there were no substantial differences between profiles for protocols T[1 + 2] and T[2] (Supplemental Fig. S7) indicating that most sRNAs detected by protocol T[1 + 2] had RNA Type 2 ends. For protocol T[1 + 2], we also noticed significant biological variations of sRNA sequencing length profiles showing all major RNA classes simultaneously among the different A and B cohorts’ plasma RNA samples, especially in the tRNA and miRNA classes (Supplemental Fig. S9).
In contrast to sequencing length profiles for sRNA Type 1 for cellular (Kawaji et al. 2008; Jackowiak et al. 2017; Shi et al. 2021b) and plasma (Max et al. 2018; Wang et al. 2024) RNA samples, the profiles for naturally occurring sRNA Type 2 have not been previously described. Here we present the sequencing profiles for sRNA Type 2 of all major sRNA classes detected in brain and representative A and B cohorts’ plasma RNA samples by protocol T[2] (Fig. 3). While length profiles for tRNA and mRNA-derived sRNAs were relatively consistent across the plasma samples (Fig. 3B,E), the profiles for snRNA, snoRNA, and lncRNA-derived sRNAs showed distinctive longer RNA fragments in the representative plasma sample from the B cohort than the A cohort (Fig. 3C,D,F, respectively).
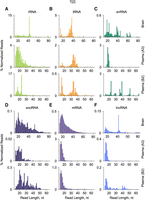
Sequencing length profiles for the main RNA classes of naturally occurring sRNAs found in brain RNA and in representative A and B cohorts’ plasma RNA samples for libraries prepared by protocol T[2].
Furthermore, protocol T[2] revealed intriguing features of piRNA-related sequences. Like miRNAs, mature (processed) piRNAs could be classified as RNA Type 1; however, these contain a 2′-OMe modification at their 3′-end. It has been previously shown that this modification could reduce the circularization rate of sRNAs having 5′-P and 2′-OMe/3′-OH ends by Rnl1 (Kumar et al. 2011). For the brain RNA samples, we determined that protocol T[2] reduced the percentage of the miRNA-related reads in comparison to protocol T[1 + 2] by 11.24 ± 2.80 fold, whereas percentages of piRNA-related reads were reduced by only 1.30 ± 0.05 fold (Supplemental Table S9A,B). In similar comparisons of these protocols applied to the A cohort plasma samples, the observed reduction for miRNA- and piRNA-related reads was 27.38 ± 7.50- and 1.17 ± 0.05-fold, respectively (Supplemental Table S9C,D). These results confirmed that the 2′-OMe modification substantially inhibited circularization of piRNA-related sRNAs and, therefore, reduced their depletion from sequencing libraries prepared by protocol T[2].
Detection of all four stsRNA Types after PNK pretreatment
PNK is commonly used to erase the differences between the phosphorylation states of sRNA ends by converting them simultaneously to RNA Type 1, followed by standard sRNA-seq library preparation methods (Akat et al. 2019; Giraldez et al. 2019; Crocker et al. 2022; Shi et al. 2022, Shigematsu and Kirino 2022; Solaguren-Beascoa et al. 2023). This approach, also known as phospho-RNA-seq, uses the standard, one-step PNK treatment of RNA performed in Tris-HCl buffer at pH 7.6 in the presence of 1 mM ATP under conditions adopted from earlier studies (Pan et al. 1991; Busch et al. 2000; Schürer et al. 2002; Brown and Bevilacqua 2005). Although these reaction conditions are optimal for the phosphorylation of 5′-OH ends of RNA Types 2 and 3 (Cameron and Uhlenbeck 1977), the maximum rate of dephosphorylation of 3′-P and 2′, 3′>P ends of RNA Types 3 and 4 is ∼pH 5.9, whereas at pH 7.6 it decreases by ∼10-fold (Cameron and Uhlenbeck 1977; Zhuang et al. 2012b). Also, PNK has significant 5′-P reverse (dephosphorylation and exchange) activities catalyzed by ATP (van de Sande et al. 1973). Additional anticipated problems include known bias of PNK to preferentially phosphorylate nucleic acids with certain 5′- and 3′-end nucleotides, sequences, lengths, and secondary structures (Székely and Sanger 1969; Lillehaug and Kleppe 1975; van Houten et al. 1988; Lee et al. 2013).
In this study, we sought to enhance desirable and minimize unwanted PNK activities through an examination of the effects of different PNK pretreatment conditions on the sequencing output of our pool of stsRNA spiked into brain RNA samples. In contrast to the phospho-RNA-seq method, we aimed to perform the 3′-end dephosphorylation and 5′-end phosphorylation by PNK in two separate steps (rather than simultaneously) under the optimal conditions for each step. In the first step, 3′-dephosphorylation was performed as an RNA pretreatment as described in protocol T[1 + 2 + 3 + 4] (Table 1). For this purpose, we tested three buffer conditions adapted from Cameron and Uhlenbeck (1977), comprising 100 mM Tris-HCl at pH 7.6 in the presence of 1 mM ATP; and 100 mM imidazole-HCl at pH 6.5 or 100 mM MES-NaOH at pH 6.0 (both in the absence of ATP) as described in Materials and Methods. In the second step, the 5′-phosphorylation of RNA Types 2 and 3 was carried out in Step 2b of the library preparation by PNK in standard NEB kinase reaction buffer at pH 7.6 in the presence of 100 µM ATP, which minimized the 5′-end dephosphorylation of RNA Types 1 and 4 (Supplemental Fig. S1A). In contrast to Cameron and Uhlenbeck (1977) demonstrating that the rate of 3′-P dephosphorylation depends on the buffer pH, we did not observe significant differences among average percentages of stsRNA Types 3 and 4 in brain RNA samples pretreated under the conditions described above (Supplemental Table S10).
Despite the different stsRNA Types having been premixed at an equimolar ratio of 25% per Type, we found that protocol T[1 + 2 + 3 + 4] applied to stsRNAs spiked into brain or plasma RNA samples did not produce the expected equal distribution for the stsRNA Types, with stsRNA Types 1 and 2 overrepresented and Type 4 slightly underrepresented, whereas Type 3 was substantially underrepresented (Supplemental Table S10). Since stsRNA Types 3 and 4 both have 3′-P ends and were less represented than stsRNA Types 1 and 2 having 3′-OH ends, we hypothesized that the dephosphorylation of 3′-P ends by commonly used 10 units PNK (per reaction) might be incomplete. Therefore, we compared the outputs of reactions containing either 10 or 20 units of PNK for stsRNAs spiked into the C1 plasma RNA sample and found that the twofold increase of PNK input did not enhance the percentage of stsRNA Type 3 and 4 in the sequencing libraries (Supplemental Table S10). Because the stsRNA Type 3 underrepresentation was also found with the mock stsRNA experiments under the selected PNK pretreatment condition while the other three stsRNA Types were more evenly represented (Supplemental Table S5), we considered it as a bias related to the Type 3 stsRNAs negatively affecting their incorporation in sequencing libraries.
Although the PNK pretreatment with MES buffer at pH 6.0 did not produce higher yields of stsRNA Types 3 and 4 than using Tris-HCl at pH 7.6 (Supplemental Table S10), we have selected it for 3′-P dephosphorylation in protocol T[1 + 2 + 3 + 4]. The rationale behind this selection is based on known factors leading to RNA fragmentation. To avoid an interference of PNK with the next enzymatic step, PNK should be either heat inactivated or removed by column purification prior to sequencing library preparation. Although the heat inactivation of PNK (and other thermolabile enzymes) is a common technique used in RNA biochemistry, we were concerned about additional sRNA fragmentation. As previously established, the heating of RNA molecules in select buffers can lead to their fragmentation, which is heavily influenced by RNA length, sequence, presence of divalent cations, buffer composition, and pH (Chheda et al. 2024). In the MES buffer at pH 6.0, RNA molecules were expected to be more resistant to cleavage than in Tris buffer at pH 7.6 (Chheda et al. 2024). Also, both imidazole and Tris in the presence of Mg2+ cations can catalyze RNA cleavage accelerated by high temperature (Breslow and Huang 1991; Vlassov et al. 1995; AbouHaidar and Ivanov 1999).
To test whether the column-based removal of PNK or its heat inactivation in solution affected the stsRNA sequencing length profiles, we performed two sets of experiments using the C1 plasma RNA sample. The first experiment was to assess the effect of passing RNA through a column on the distribution of RNA lengths sequenced. We compared sequencing profiles of stsRNAs spiked into the plasma RNA samples passed through the Zymo RNA clean and concentrate columns and stsRNAs spiked into plasma RNA samples that were directly used as input for library preparation without a column cleanup for universal protocol T[1 + 2] (Supplemental Fig. S10). We found that passing the sample through the column (Supplemental Fig. S10B) did not significantly alter the resulting stsRNA length profiles as compared to the samples not passed through the columns (Supplemental Fig. S10A). This result, which is universally applicable to all RiboMarker pretreatment steps (Table 1), demonstrated that the column purification did not noticeably alter the stsRNA length distribution. In the second experiment, we assessed the effect of PNK heat inactivation after enzymatic pretreatment on the distribution of stsRNA lengths. We treated the stsRNA with PNK in the MES pH 6.0 buffer, and then PNK was either heat-inactivated at 65°C for 20 min in the presence of 20 mM EDTA pH 8.0 or removed by the columns without heating. In this case, the heat inactivation of PNK resulted in less robust capture of longer stsRNAs, with a significant increase in the relative abundance of shorter molecules (Supplemental Fig. S11A) as compared to the column-purified stsRNAs (Supplemental Fig. S11B). Given our previous observation that passing through the columns does not alter the inclusion ratio of different lengths and, therefore, does not artificially enrich for longer stsRNAs (Supplemental Fig. S10), we concluded that the heat inactivation of PNK leads to the partial fragmentation of our stsRNAs that evidently affects longer molecules more readily. Also, we found that PNK heat inactivation additionally reduced the average percentage of stsRNA Type 3 (13.23% ± 0.42%) of all stsRNA lengths as compared to the column-purified samples (19.29% ± 0.43%) (Supplemental Table S10).
A comparison of stsRNA sequencing length profiles for the mock controls and stsRNAs spiked into the brain and representative A and B cohorts’ plasma RNA samples indicates that the natural RNA compositions can significantly affect the ratios between stsRNA Types for protocol T[1 + 2 + 3 + 4] (Fig. 4A–E). Furthermore, the percentage of stsRNAs of different lengths were also affected. Although these phenomena are not fully understood, the putative competition and/or cofolding between naturally occurring sRNAs (whose contents can vary among different samples) and synthetic stsRNAs might be responsible for these effects.
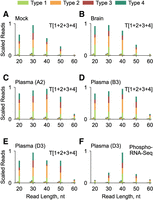
Representative sequencing length and RNA Type profiles for different stsRNAs contexts, including (A) mock control lacking a naturally occurring sRNA background; and stsRNAs spiked into either (B) brain RNA or (C–F) representative A, B, and D cohorts’ plasma RNA samples for libraries prepared either by (A–E) RiboMarker protocol T[1 + 2 + 3 + 4] or (F) phospho-RNA-seq.
We also compared sequencing length profiles of stsRNAs spiked into D cohort plasma RNA for protocol T[1 + 2 + 3 + 4] (Supplemental Fig. S12A) and phospho-RNA-seq (Supplemental Fig. S12B). For a fair comparison, we skipped the PNK heat inactivation step (which is commonly used for phospho-RNA-seq) but kept the column cleanup step, which was common for protocol T[1 + 2 + 3 + 4]. We found substantial differences in the stsRNA distributions between these two protocols among the four RNA Types at different lengths. On average for all stsRNA lengths, protocol T[1 + 2 + 3 + 4] includes more stsRNA Type 2 (35.15% ± 1.51%) and less stsRNA Type 3 (15.8% ± 1.75%) than phospho-RNA-seq (23.35% ± 0.56% and 19.02% ± 0.32%, respectively), whereas phospho-RNA-seq includes more stsRNA Type 1 (29.84% ± 0.44%) and Type 4 (27.79% ± 0.49%) than protocol T[1 + 2 + 3 + 4] (26.56% ± 1.86% and 22.49% ± 1.52%, respectively) (Supplemental Tables S11, S12). Neither of these two protocols was perfect in capturing the intended 25% distribution of each stsRNA Type. There were significant variations from the average stsRNA Type distributions of different lengths for both protocol T[1 + 2 + 3 + 4] and phospho-RNA-seq (Supplemental Tables S11, S12). Furthermore, we noticed remarkable differences in efficiency of capturing stsRNAs of different lengths between these two protocols. Protocol T[1 + 2 + 3 + 4] provided almost even coverage of stsRNAs in the 20–50 nt range, with a slightly higher yield for 30 nt and a significantly lower yield for 60 nt species (Fig. 4E; Supplemental Fig. S12A). In contrast, phospho-RNA-seq revealed a biased distribution of stsRNAs of different lengths, with a strong peak at 40 nt (10× yield) symmetrically surrounded by 30 and 50 nt (3× yield) and by 20 and 60 nt (1× yield) (Fig. 4F; Supplemental Fig. S12B). The sequencing library preparation for phospho-RNA-seq with the NEBNext Small RNA library preparation kit for Illumina used a two-adapter ligation to RNA ends and (theoretically) should provide length-independent incorporation of the stsRNAs in the libraries. Even so, a cofolding between sRNAs and the adapters has been identified as a key determinant of ligation efficiency bias (Zhuang et al. 2012a; Maguire et al. 2020). A plausible explanation of this observed NEBNext bias would be an accidental cofolding between our stsRNAs and NEBNext sequencing adapter(s) that is either favorable or unfavorable to their ligation efficiency. However, profiling of stsRNAs to evaluate the efficiency of conversions of RNA ends represents only an approximate outline of profiling naturally occurring sRNAs that might have different abundances, lengths, and nonrandom nucleotides at their ends than the stsRNA molecules.
Comparison of length profiles for naturally occurring RNA Types found with protocols T[1 + 2 + 3 + 4] and T[1 + 2]
After evaluating protocol T[1 + 2 + 3 + 4] with stsRNAs, we analyzed sequencing length profiles for naturally occurring sRNAs of all main RNA classes in the brain (Supplemental Fig. S13) and plasma (A and B cohorts) (Supplemental Fig. S14) RNA samples. In comparison to protocol T[1 + 2], the most distinctive differences were increased rRNA and decreased miRNA contents for both the brain and plasma RNA samples detected by protocol T[1 + 2 + 3 + 4] (Supplemental Fig. S15A,B). This result was similar but less dramatic than the differences in the rRNA and miRNA content between common sRNA-seq protocols detecting only sRNA Type 1 and phospho-RNA-seq detecting all four RNA Types simultaneously (Akat et al. 2019; Galvanin et al. 2019; Giraldez et al. 2019; Shi et al. 2021b; Solaguren-Beascoa et al. 2023).
In contrast to protocol T[2], which depletes RNA Type 1 (including miRNAs) from the sequencing libraries, protocol T[1 + 2 + 3 + 4] dilutes these reads by adding the “hidden” sRNA species of RNA Types 3 and 4 to the libraries after the pretreatment. If the 5′-P ends of miRNAs are not dephosphorylated by the PNK pretreatment, the reduction in the capture of miRNAs will be inversely proportional to the increase in new sRNA species. A comparison between these two protocols showed that the average inclusion into the resulting libraries for miRNA with protocol T[1 + 2 + 3 + 4] in comparison to protocol T[1 + 2] was reduced by 3.34 ± 0.09-fold in the brain (Supplemental Fig. S15A), 8.08 ± 1.73-fold in the A cohort plasma, and 20.64 ± 9.93-fold in the B cohort plasma RNA samples (Supplemental Fig. S15B). These results indicate that the “hidden” sRNA species that appeared after the PNK pretreatment by protocol T[1 + 2 + 3 + 4] can account for 95% of sRNA present in the B cohort plasma RNA samples. The relative abundance of sRNA across RNA classes indicates a high reproducibility for technical repeats for the brain (Supplemental Fig. S15A) and significant biological variations across different plasma (Supplemental Fig. S15B) RNA samples. In the brain sample, the percentage of sequencing reads for sRNAs derived from mRNA and lncRNA increased with protocol T[1 + 2 + 3 + 4] in comparison to protocol T[1 + 2], and for tRNA were about the same, whereas miRNA, snRNA, and piRNA decreased with protocol T[1 + 2 + 3 + 4] (Supplemental Fig. S15A). These differences for sRNAs derived from mRNA and lncRNA in the brain RNA sample were related to the inclusion of a bigger proportion of sRNA Types 3 and 4 than Types 1 and 2. Despite the expectation that most of the sequencing reads that align to mRNA and lncRNA found in circulation should belong to sRNA Type 3 due to the abundance of superfamily A RNases in human blood (Giraldez et al. 2019; Lee et al. 2019), we found that protocol T[1 + 2] detected about the same or larger fractions of these RNA classes than protocol T[1 + 2 + 3 + 4] in the A cohort and B cohort plasma RNA samples (Supplemental Fig. S15B). This finding correlates with previous TGIRT-seq analyses, indicating that many of the mRNA fragments present in plasma have 3′-OH rather than 3′-P ends (Yao et al. 2020).
Furthermore, we analyzed the changes in the length profiles of the individual RNA classes obtained by protocols T[1 + 2] and T[1 + 2 + 3 + 4]. For the brain samples (Supplemental Fig. S16), we detected comparatively long (>30 nt) fragments of snRNAs (Supplemental Fig. S16D), snoRNAs (Supplemental Fig. S16E), and lncRNAs (Supplemental Fig. S16G) whose relative abundances were decreased in protocol T[1 + 2 + 3 + 4] as compared to protocol T[1 + 2]. For mRNA, the abundance of both shorter and longer fragments was significantly increased by protocol T[1 + 2 + 3 + 4] (Supplemental Fig. S16F). In the representative A cohort plasma RNA sample, most sRNA sequences that aligned to the individual RNA classes (except tRNA) were found to be <20 nt (Supplemental Fig. S17). However, for the representative B cohort plasma RNA sample, we found relatively large fractions of sRNA sequences aligned to most individual RNA classes that were >20 nt for both protocols (Supplemental Fig. S18). Particularly, we detected a relatively larger fraction of tRNA fragments of ≥30 nt for protocol T[1 + 2 + 3 + 4] than for protocol T[1 + 2] (Supplemental Fig. S18C), suggesting their origin as RNA Types 3 and/or 4. In contrast, we detected a larger fraction of fragments of snRNA and snoRNA ≥30 nt for protocol T[1 + 2] than for protocol T[1 + 2 + 3 + 4] (Supplemental Fig. S18D,E), suggesting that these fragments were RNA Types 1 and/or 2.
Comparison of length profiles for naturally occurring RNA Types found with protocols T[1 + 2 + 3 + 4] and phospho-RNA-seq
Using phospho-RNA-seq as a benchmark, we compared its capacity to simultaneously capture sRNAs with RiboMarker protocol T[1 + 2 + 3 + 4]. Although the sequencing length profiles showing all RNA classes simultaneously for the D cohort plasma RNA samples appeared similar between these two protocols for each individual plasma sample (Supplemental Fig. S19), the profiles of sRNA representing individual tRNA, snRNA, snoRNA, and piRNA classes were found to be distinctively different as shown for a representative D cohort plasma RNA sample (Supplemental Fig. S20). We then compared the percentage of sRNA sequencing reads uniquely mapped to the individual RNA classes as captured by these two protocols in the D cohort plasma RNA samples. Although both protocols have similar capacity in the detection of sRNAs mapped to rRNA, snoRNA, and snRNA, protocol T[1 + 2 + 3 + 4] provided the detection of more sRNA sequences mapped to miRNA, piRNA, and tRNA, whereas phospho-RNA-seq detected slightly more mRNA and lncRNA fragments (Supplemental Fig. S21).
Detection of stsRNA Types 3 and 4
We reused single pretreatment steps from protocols T[2] and T[1 + 2 + 3 + 4] in protocols T[3 + 4], T[3], and T[4], which have multiple pretreatment steps (Table 1). First, we evaluated protocol T[3 + 4] to simultaneously detect RNA Types 3 and 4. Like protocol T[1 + 2] (Fig. 2A,D, left panels), the stsRNA sequencing length profiles for protocol T[3 + 4] significantly varied between the mock control (Fig. 5A, left panel; Supplemental Fig. S2D) and stsRNAs spiked in a representative B cohort plasma RNA sample (Fig. 5A, right panel), while there were few differences between profiles of stsRNAs spiked in the plasma (A or B cohorts) RNA samples (Supplemental Fig. S22A). For these profiles, the presence of naturally occurring sRNAs in the plasma samples provided almost even coverage of stsRNAs in the 20–50 nt range. Using protocol T[3 + 4] for stsRNAs spiked into the A cohort and B cohort plasma RNA samples, we successfully enriched for RNA Type 3 and Type 4, making up ∼90% stsRNA sequences detected, with similar average values for RNA Type 3 (A cohort: 39.80% ± 0.17% and B cohort: 39.92% ± 0.81%) and RNA Type 4 (A cohort: 49.39% ± 0.94% and B cohort: 49.90% ± 0.51%) (Supplemental Table S13A,B) with the ratio between stsRNA Type 3 and stsRNA Type 4 estimated as about 1–1.25.
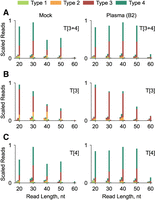
Representative sequencing length and RNA Type profiles for different stsRNA contexts, including a mock control lacking a naturally occurring sRNA background (left column) and stsRNAs spiked into representative plasma (from B cohort as indicated) RNA sample (right column), for libraries prepared by RiboMarker protocols (A) T[3 + 4], (B) T[3], or (C) T[4].
Second, we evaluated protocol T[3]. The sequencing length profiles for this protocol found a steady decline of stsRNA capture in the 20–50 nt range for both the mock control (Fig. 5B, left panel; Supplemental Fig. S2E) and stsRNAs spiked in the plasma (A and B cohorts) RNA samples (Fig. 5B, right panel; Supplemental Fig. S22B). In comparison to protocol T[3 + 4], the stsRNA sequencing profiles for protocol T[3] were less different among the mock controls and in the presence of the plasma RNA (Fig. 5B). However, the percentage of stsRNA Type 3 changed. In comparison to the mock control (53.07% ± 1.61%; Supplemental Table S5), the presence of the naturally occurring RNA significantly improved the stsRNA Type 3 specificity of this protocol for the stsRNAs spiked in the plasma RNA samples, where average percentages of the stsRNA Type 3 had similar values (76.96% ± 1.68% and 75.09% ± 1.42%) for the A and B cohorts’ plasma RNA samples, respectively (Supplemental Table S14A,B).
Finally, we evaluated protocol T[4]. In the first pretreatment step of this protocol, we circularized sRNA Type 3 by RtcB ligase to prevent their incorporation into sequencing libraries (in a similar fashion to circularization of sRNA Type 1 by T4 RNA ligases). For this purpose, we adopted previously described RtcB ligase reaction conditions (Chakravarty et al. 2012; Petkovic and Müller 2015). As in protocol T[3 + 4], stsRNA sequencing length profiles for protocol T[4] varied between the mock control (Fig. 5C, left panel; Supplemental Fig. S2F) and stsRNAs spiked in a representative B cohort plasma RNA sample (Fig. 5C, right panel), while there were few differences between profiles of stsRNAs spiked in the A and B cohorts’ plasma RNA samples (Supplemental Fig. S22C). Remarkably, both protocols T[3 + 4] and T[4] provided almost even coverage of stsRNA Type 4 in the 20–50 nt range in the presence of plasma RNA (A and B cohorts) (Supplemental Fig. S22A,C). For protocol T[4], we achieved only moderate enrichment for stsRNA Type 4 over Type 3 (Fig. 5C) presumably because of the limited efficiency of RtcB on sRNA Type 3 circularization. For stsRNAs spiked into plasma RNA samples, the average ratio of RNA Type 4 to Type 3 for all stsRNA lengths were found to be 2.1 to 1 (Type 4: 58.98% ± 1.01% vs. Type 3: 27.89% ± 2.06%) for A cohort plasma RNA and 2.3 to 1 for stsRNAs (Type 4: 61.95% ± 4.40% and Type 3: 26.88% ± 4.60%) for B cohort plasma RNA (Supplemental Table S15A,B).
Detection of naturally occurring RNA Types 3 and 4
After assessing protocols T[3 + 4], T[3], and T[4] with the stsRNAs, we evaluated these protocols for detection of naturally occurring sRNAs in plasma RNA samples. A comparison of the percentage of normalized sequencing reads for the individual main sRNA classes in libraries of different plasma RNA samples detected was about the same for rRNA, snRNA, mRNA, and lncRNA by protocols T[3 + 4], T[3], and T[4], whereas sRNA Type 4 prevailed over sRNA Type 3 for tRNA and snoRNA classes (Supplemental Fig. S15C). Although the differences in sRNA sequencing length profiles combining all RNA classes simultaneously were not easily notable for these three protocols in A and B cohorts’ plasma RNA samples (Supplemental Fig. S23A–C) because of high rRNA background, some individual RNA classes had distinctive protocol-specific and sample-dependent features. For instance, the sRNA profiles for tRNA, snRNA, snoRNA, and piRNA classes for a representative B cohort plasma RNA sample contained more abundant longer sequences in comparison to the representative A cohort plasma RNA sample (Fig. 6). However, the profiles for other RNA classes are less distinctive (Supplemental Fig. S24). The differences in sequencing length profiles for protocols T[3 + 4], T[3], and T[4] for the same plasma samples, such as the length of sRNA sequences and/or abundance of sRNA sequences having the same lengths, allow discrimination between sRNA Type 3 and Type 4. For example, in the representative B cohort plasma RNA sample, a subset of 35 nt tRNA fragments was identified as RNA Type 3, whereas other 30 nt fragments could be assigned to RNA Type 4 (Fig. 6A).
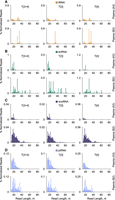
Comparison of sequencing length profiles for sRNAs of selected RNA classes (A) tRNA, (B) snRNA, (C) snoRNA, and (D) piRNA for representative A and B cohorts’ plasma RNA samples prepared by RiboMarker protocols T[3 + 4] (left column), T[3] (middle column), or T[4] (right column).
Analysis of sRNA transcriptomics using all RiboMarker protocols
In contrast to sRNAs generated by random (or semi-random) fragmentation of RNAs, sRNAs derived from specific segments of larger RNA transcripts may not only have different RNA Types but also be differentially abundant in biological samples. Comparative analyses of sRNA sequencing profiles for all or selected RiboMarker protocols could serve for the identification of sRNA sequences of biological and/or diagnostic interest, including their RNA class(es) and RNA Type(s), and thereby a method to select a specific protocol that would provide detection of these sRNA(s) with the highest sensitivity. In addition to the sRNA sequencing length profiles, we have evaluated other analytical tools to compare the capacities of different protocols to detect sRNAs derived from the main RNA classes for plasma RNA samples.
First, to better understand the origin of sRNAs, we generated consensus mapping profiles of reads aligned for A and B cohorts’ plasma RNA samples to all tRNA (Fig. 7A) and snRNA (Fig. 7B) transcripts for all RiboMarker protocols. These data revealed that different RNA Type–specific protocols captured sRNAs derived from distinct regions of their parent transcript. For tRNA, protocol T[2] primarily captured sRNAs derived from the 3′-end of tRNA molecules, protocol T[4] from the 5′- end, and protocol T[3] from either end (Fig. 7A, left panels) for A cohort plasma RNA samples. In the case of snRNA, sRNA Type 2 was found to be derived from their internal regions, sRNA Type 3 from both 3′- and 5′-ends, while sRNA Type 4 mostly overlapped with sRNA Type 2 molecules (Fig. 7B, left panels) for A cohort plasma RNA samples. We observed notable differences in these consensus profiles between A and B cohorts’ plasma RNA samples, particularly for sRNA Type 4 derived from tRNAs (Fig. 7A) and for sRNA Type 2 and Type 3 derived from snRNAs (Fig. 7B). Overall, our data demonstrated that the individual Type-specific protocols (e.g., T[2], T[3], or T[4]) could be more capable in detecting differences between the sRNA consensus profiles than the protocols detecting combinations of RNA Types (e.g., T[1 + 2 + 3 + 4], T[1 + 2], or T[3 + 4]).
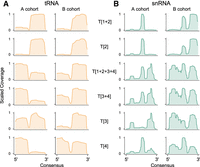
Comparison of consensus sequencing read coverage profiles for all (A) tRNA and (B) snRNA molecules, using the average distribution in A and B cohorts’ plasma RNA samples for libraries prepared by all RiboMarker protocols (indicated for each row).
Second, we examined heat maps visualizing patterns of RNA transcripts and/or fragmented sequences derived from different transcripts of all main RNA classes that were detected by the different RiboMarker protocols for A cohort (Fig. 8A) and B cohort (Fig. 8B) plasma RNA samples. Rather than identifying the best protocol(s) for detecting transcripts of individual RNA classes with higher sensitivity, these analyses facilitate the identification of the best protocol(s) for specific detection of transcripts of interest within each RNA class. In the heat maps, the larger width of RNA class-specific segments corresponds to larger numbers of unique RNA sequences, while higher Z-scores are related to the abundance of specific RNA sequences detected. Combined, transcript presence and abundance correspond to the stronger capability of different RiboMarker protocols to enrich for sRNA sequences aligned to the indicated RNA classes. The numbers of unique RNA sequences were compared and ranked (from higher to lower) for each RiboMarker protocol applied to the indicated RNA classes (Fig. 8A,B). For tRNA sequences, the protocols were ranked as T[1 + 2] ∼ T[2] > T[4] > T[3 + 4] > T[1 + 2 + 3 + 4] > T[3] in A cohort plasma (Fig. 8A) and as T[1 + 2] ∼ T[2] > T[4] > T[1 + 2 + 3 + 4] ∼ T[3 + 4] > T[3] in B cohort plasma (Fig. 8B) RNA samples. However, the number of unique fragments derived from tRNAs detected in the A cohort plasma RNA samples was approximately two times greater in comparison to the B cohort plasma RNA samples. For miRNA sequences, the protocols were ranked as T[1 + 2] > T[1 + 2 + 3 + 4] ≫ T2 > T[4] ∼ T[3 + 4] ≫ T[3] for detection in both A and B cohorts’ plasma RNA samples (Fig. 8A,B). Although the dominance of protocol T[1 + 2] for detecting miRNAs (RNA Type 1) was obvious and the presence of small fractions of miRNAs, which were detected by both protocols T[1 + 2] and T[2], could be explained by incomplete circularization of miRNAs, the uncovering of significant fractions of sRNA Type 4 aligned to miRNA sequences by protocol T[4] was intriguing. We also clearly identified short (e.g., 17 nt in length) fragments of miRNAs in sequencing length profiles for protocol T[4] (Supplemental Fig. S24B). Previously, small numbers of 3′-end phosphorylated miRNAs have also been detected by phospho-RNA-seq in human plasma (Giraldez et al. 2019) and in cells (Lai et al. 2023).
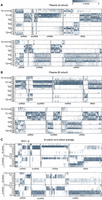
Hierarchically clustered heat maps showing the relative abundance (row-wise Z-score) of sRNA sequences aligned to significantly enriched RNA transcripts and/or their fragments of main RNA classes among RiboMarker protocols (DESeq2 LRT; Padj < 0.05) detected in the individual plasma RNA samples of (A) A cohort, (B) B cohort, and (C) comparison of average Z-scores calculated for all individual plasma RNA samples among each A and B cohort for libraries prepared by indicated RiboMarker protocols. Darker rows indicate a higher relative abundance of the corresponding RNA transcripts.
In other sRNA classes, we also noticed significant differences in enrichment of their different RNA Types. For instance, the ratio between the numbers of unique sRNA sequences derived from snoRNAs in comparison to snRNAs was about 1 to 4 in A cohort plasma (Fig. 8A) and 2 to 1 in the B cohort plasma (Fig. 8B) RNA samples. For snoRNA, the protocols were ranked as T[2] ∼ T[1 + 2] > T[1 + 2 + 3 + 4] > T[4] ∼ T[3 + 4] ≫ T[3] in the A cohort plasma (Fig. 8A) and as T[2] ∼ T[1 + 2] ≫ T[1 + 2 + 3 + 4] > T[4] ∼ T[3 + 4] ≫ T[3] in the B cohort plasma (Fig. 8B) RNA samples. For snRNA sequences, the protocols were ranked as T[2] ∼ T[1 + 2] ∼ T[1 + 2 + 3 + 4] > T[3] ∼ T[3 + 4] ≫ T[4] in the A cohort plasma (Fig. 8A) and as T[2] ∼ T[1 + 2] ≫ T[3 + 4] ∼ T[1 + 2 + 3 + 4] > T[4] ∼ T[3] in the B cohort plasma RNA samples (Fig. 8B).
For piRNA, the number of detected transcripts was ∼2.5 times smaller in the A cohort plasma (Fig. 8A) than in the B cohort plasma (Fig. 8B) RNA samples, and the protocols were ranked as T[4] ∼ T[3 + 4] ≥ T[3] > T[1 + 2] ∼ T[2] ≥ T[1 + 2 + 3 + 4] in the A cohort plasma (Fig. 8A) and as T[2] ∼ T[1 + 2] ≫ T[3] ∼ T[4] ∼ T[3 + 4] > T[1 + 2 + 3 + 4] in the B cohort plasma RNA samples (Fig. 8B). Remarkably, we found that sRNA sequences aligned to piRNA transcripts were represented by all RNA Types rather than predominantly by RNA Type 1, common for the mature form of this RNA class. The latter results agree with the previously suggested piRNA biogenesis pathway indicating that all four sRNA Types could be generated from precursor piRNAs (Shigematsu et al. 2021).
Although the phospho-RNA-seq approach was originally developed to increase the overall recovery of unique mRNA and lncRNA fragments (Akat et al. 2019; Giraldez et al. 2019; Yao et al. 2020), we found that, in D cohort plasma RNA samples, both phospho-RNA-seq and protocol T[1 + 2 + 3 + 4] underperformed in this task in comparison to protocols T[2], T[3], and T[3 + 4] (Supplemental Fig. S21). For mRNA sequences, the protocols were ranked as T[4] > T[3] > T[3 + 4] ≫ T[2] > T[1 + 2] ≫ T[1 + 2 + 3 + 4] in the A cohort plasma (Fig. 8A) and as T[3] ∼ T[4] > T[3 + 4] ∼ T[2] ∼ T[1 + 2] ≫ T[1 + 2 + 3 + 4] in the B cohort plasma (Fig. 8B) RNA samples. For lncRNA sequences, the RiboMarker protocols were ranked as T[4] > T[3] ∼ T[3 + 4] > T[2] ∼ T[1 + 2] ≫ T[1 + 2 + 3 + 4] in the A cohort plasma (Fig. 8A) and as T[2] > T[1 + 2] ∼ T[3] ∼ T[3 + 4] > T[4] ≫ T[1 + 2 + 3 + 4] in the B cohort plasma (Fig. 8B) RNA samples.
Additionally, we found significant differences among the transcript patterns visualized in heat maps for all featured RNA classes within the A cohort (Fig. 8A) and B cohort (Fig. 8B) plasma RNA samples. In general, protocols T[1 + 2] and T[3 + 4] are complementary for detection of sRNAs derived from all RNA classes, providing, in combination, more sensitive and comprehensive coverage of the entire RNA fragmentome than “all inclusive” protocol T[1 + 2 + 3 + 4]. Moreover, we did not find any individual RNA class for which RiboMarker protocol T[1 + 2 + 3 + 4] outperformed the Type-specific protocols in variety and sensitivity of detecting transcripts for all RNA classes featured in this study (Fig. 8A,B). A comparison of the heat maps for libraries prepared using either protocol T[1 + 2 + 3 + 4] or phospho-RNA-seq for D cohort plasma RNA samples (Supplemental Fig. S25A) and Pearson correlation analysis comparing the presence and abundance of specific RNA transcripts for each RNA class between these protocols (Supplemental Fig. S25B) further confirmed that these two protocols preferentially detected different groups of sRNA transcripts within every analyzed RNA class.
Discrimination between A cohort and B cohort plasma samples as a prototype for sRNA biomarker discovery
Above in this study, we identified differences among sequencing profiles for the A and B cohorts’ plasma RNA samples to highlight both technical aspects as well as biological variation observed using different RiboMarker protocols. These cohorts simulate plasma samples collected from healthy individuals (A cohort) and breast cancer patients (B cohort) (Supplemental Table S2). Using the RiboMarker approach, we demonstrated its potential capability to enhance the capacity and sensitivity of distinguishing between these or any other plasma RNA samples, by selecting and using sRNAs of specific RNA Type(s). Our study might serve as a prototype for utilizing the RiboMarker platform for sRNA biomarker discovery, followed by validation and translational research before clinical application.
The notable differences among the sequencing profiles of A and B cohorts’ plasma RNA samples for some sRNA classes have already been demonstrated above for selected RiboMarker protocols (see Figs. 3, 6, 7). However, these profiles and the differences among them were determined for average data covering entire sRNA classes, and rather individual, selected sRNA sequences within these RNA classes could prove to be more sensitive and precise, as previously shown using miRNAs (Wang et al. 2018). To demonstrate the feasibility of this approach, we first compared sRNA heat maps for different RiboMarker protocols and identified the most significant differences in transcript patterns among the A cohort and B cohort plasma RNA samples for the main RNA classes (Fig. 8C). Although the enrichment of certain sRNAs in either B cohort or A cohort plasma samples could be used for selecting sRNAs of interest, perhaps sRNAs that are unique for the “disease” B cohort samples over the “healthy” A cohort samples could be better biomarker candidates.
We noticed that sRNAs derived from snoRNAs and snRNAs could provide the largest number of potential sRNA biomarker candidates (Fig. 8C). Without any specific preferences, we selected a group of fragments of RNU2-1 snRNA, hereby referred to as RNU2-1_3p, which we have marked in Figure 8C, and whose sequences are shown in Supplemental Figure S26, as an example. Protocols T[1 + 2] and T[2] were found to provide the best enrichment of RNU2-1_3p among the B cohort plasma to discriminate these versus the A cohort plasma RNA samples (Fig. 8C). Differential expression analyses confirmed that RNU2-1_3p was indeed among the most significantly enriched sRNAs among the B cohort plasma versus the A cohort plasma RNA samples using both T[1 + 2] and T[2] protocols (Fig. 9A). These two protocols also excel in the sensitivity of detection of 24, 52, and 65 nt long RNU2-1 fragments that were found to be unique for both B1 and B2 plasma RNA samples (Fig. 9B). The profile of the one B3 plasma RNA sample had only minor differences as compared to the A cohort plasma RNA samples, which may be related to a different breast cancer subtype in the B3 sample in comparison to the B1 and B2 plasma RNA samples. Finally, we compared read coverage profiles mapping to the RNU2-1 snRNA transcript found in these A and B cohorts’ plasma RNA samples for libraries prepared by protocols T[1 + 2] and T[2] (Fig. 9C). These profiles identified two areas, 01 and 02, comprising sequences of the detected RNU2-1 snRNA fragments, where area 01 was common for both A and B cohorts’ plasma RNA samples while area 02 was specific to the B cohort plasma RNA samples (Fig. 9C). Also, the finding that protocol T[2] outperformed protocol T[1 + 2] in the detection of the RNU2-1 fragments in area 02 for the B1 and B2 plasma samples (two bottom panels in Fig. 9C) indicated that most of these RNU2-1 fragments had RNA Type 2 ends. The top 20 most abundant sRNA sequences aligned to the RNU2-1 snRNA that we detected in the selected B1 and B2 plasma RNA samples for libraries prepared by protocol T[2] are shown in Supplemental Figure S26.
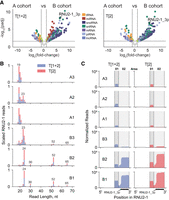
Comparison of differentially enriched sRNAs detected in the plasma RNA samples from A and B cohorts. (A) Volcano plots showing the significant changes (|log2fc| >1, Padj < 0.05) in the abundance of sRNAs indicated by dots, whose colors correspond to transcripts of the indicated RNA classes they were derived from. Average data calculated for all individual plasma RNA samples among each A and B cohort for libraries prepared by protocols T[1 + 2] and T[2] are shown in the left and right panels, respectively. (B) Overlapped sequencing length profiles for sRNAs derived from the RNU2-1 snRNA for libraries prepared using either protocol T[1 + 2] (blue) or T[2] (red) for each individual plasma RNA sample from A and B cohorts. (C) Read coverage profiles for those reads mapping to the RNU2-1 snRNA using either protocol T[1 + 2] (blue; left) or T[2] (red; right) for individual plasma RNA samples of A and B cohorts. The region corresponding to the counts associated with the RNU2-1_3p feature in A is underlined, as well as the designated areas “01” and “02” of the RNU2-1 snRNA transcript whose sequences are shown in Supplemental Figure S26.
Although short 17–25 nt fragments derived from RNU2-1 snRNA area 01 were previously identified as RNA Type 1 miR-U2-1 species in human blood using standard sRNA-seq methods (Mazières et al. 2013; Akat et al. 2019), the existence of sRNA Type 2 of longer 24–30 nt fragment sequences corresponding to area 01 and those 52–65 nt fragment sequences mapping to area 02 had not been observed. Additionally, the miR-U2-1 species were found in the blood of both cancer patients and healthy donors and have been implicated as potential multicancer diagnostic and prognostic biomarkers through their overexpression in non-small-cell lung, pancreatic, colorectal, and breast cancer (Mazières et al. 2013; Hahn et al. 2015; Köhler et al. 2016; Pantazi et al. 2022). However, the RNA Type 2 RNU2-1 fragments could conceivably be alternative, more sensitive biomarkers than the miR-U2-1 fragments, as we observed higher disease specificity. This example further emphasizes the general power of the RiboMarker platform for the identification and utilization of alternative Type-specific sRNAs to serve as novel, more potent biomarkers for cancer and other diseases.
The RiboMarker platform enables a powerful capability to accurately quantify the complete RNA fragmentome. This work demonstrates that distinctive enzymatic pretreatments can be applied to RNA samples prior to universal sequencing library preparation. These pretreatments, which include enzymatic conversions of RNA termini and circularization, make it possible to either detect all or specifically enrich for individual sRNAs. The groundbreaking protocols can be used individually or in combination to enrich for sequencing reads of the RNA Type of greatest interest. The RiboMarker platform protocols developed here offer a foundation to advance customizable RNA fragmentomics, empowering the search for novel sRNA biomarkers.
MATERIALS AND METHODS
Synthetic spike-in sRNA oligonucleotides
We designed 20 custom synthetic spike-in RNA oligonucleotides called stsRNAs. The core sequences of these stsRNAs, which do not have homology with the human genome, were adapted from Locati et al. (2015). The stsRNAs comprise 5′- and 3′-end combinations corresponding to four main RNA Types (1–4) shown in Figure 1. For each RNA Type, there were five stsRNAs of different lengths: 20, 30, 40, 50, and 60 nt. The five stsRNAs for each RNA Type contain a 6 nt barcode that is RNA Type–specific in their middle section. Also, all stsRNAs feature four randomized nucleotides at both ends. The complete sequences of these stsRNAs are shown in Table 2. The stsRNAs were diluted to working concentrations with IDTE pH 7.5 buffer (IDT) and equimolar pooled while working on ice to minimize RNA degradation. The resulting equimolar pool was aliquoted and stored immediately at −80°C. Sequences of combo adapter (CAD), blocking oligonucleotides, adapter dimer capture probes, RT blocking oligonucleotide, and RT and PCR primers (schematically shown in Supplemental Fig. S1) were the same as previously described in Barberán-Soler et al. (2018), except that the CAD sequence included an extra A ribonucleotide at its 3′-end. All synthetic oligonucleotides were synthesized and quantified spectrophotometrically by IDT.
Biological samples
Commercially available reference human brain total RNA samples (Thermo Fisher Scientific) were diluted to 100 ng/µL with IDTE pH 7.5 buffer (IDT), aliquoted, and stored at −80°C. Commercially available human plasma samples collected in EDTA plasma tubes from various individuals are described in Supplemental Table S2. Total RNA was extracted from plasma using Zymo Quick cfRNA Serum and Plasma Kit (Zymo Research) according to the manufacturer's protocol. Briefly, 1 mL of plasma was extracted per column. Columns were eluted with 12 µL of nuclease-free water, so that 1 µL of extracted RNA is equivalent to the amount of RNA found in 83 µL of plasma. Plasma and extracted RNA were stored at −80°C.
Experimental details of RiboMarker protocols
The RiboMarker protocols include RNA Type–specific enzymatic pretreatments of RNA samples and a universal library preparation protocol for untreated and pretreated RNA samples (Table 1). The RNA sample inputs for each of these protocols were 50 ng of human brain total RNA or the total human plasma RNA amount equivalent to 83 µL of plasma. Each input of naturally occurring RNA was supplemented with 16 pmol of synthetic RNA pool spike-ins (stsRNAs). This amount of stsRNAs was determined by testing multiple stsRNA input amounts into the 50 ng human brain total RNA to end up with stsRNA reads making up ∼1%–5% of the total trimmed sequencing reads. When applied to the RNA from 83 µL of plasma, the stsRNA reads made up <0.01% to ∼20% of the trimmed sequencing reads depending on the individual that the plasma sample came from and the RiboMarker protocol. Mock control RNA sample input comprises 16 pmol of the stsRNA pool without naturally occurring RNA.
Protocol T[1 + 2] is used here for specific capture of RNA Types 1 and 2 as well as the universal sRNA sequencing library preparation method for all RiboMarker protocols (see “Library Preparation and Sequencing” section below). This is the only protocol that does not have a pretreatment step. All other RiboMarker protocols have pretreatment step(s) before the library preparation that are described below.
To select an optimal reaction condition for protocol T[2], we used the stsRNA pool spiked into human brain RNA samples incubated in standard T4 RNA ligase reaction buffer supplemented with 10% PEG 8000, 20 U Murine RNase Inhibitor (all NEB), and 100 µM ATP at 37°C with the following variables: (i) 10 U Rnl1 for 1 h; (ii) 20 U Rnl1 for 1 h; (iii) 20 U Rnl1 for 2 h; or (iv) 10 U Rnl1 + 10 U Rnl2 for 1 h. The selected protocol T[2] consisted of a single pretreatment reaction with a mix of T4 RNA ligase 1 and T4 RNA ligase 2 under condition (iv). The same reaction condition was also used for one of several pretreatment steps in protocols T[3 + 4], T[3], and T[4] as described in Table 1.
To select an optimal reaction condition for protocol T[1 + 2 + 3 + 4], we used the stsRNA pool spiked into human brain RNA samples incubated with 10 U T4 PNK (NEB), 20 U Murine RNase Inhibitor (NEB), 5 mM DTT (Thermo Fisher Scientific), and 10 mM MgCl2 at 37°C for 30 min in various buffers, including (a) 100 mM Tris-HCl at pH 7.6 in the presence of 1 mM ATP; (b) 100 mM imidazole-HCl at pH 6.5 in the absence of ATP; or (c) 100 mM MES-NaOH at pH 6.0 in the absence of ATP. The selected protocol T[1 + 2 + 3 + 4] had a single pretreatment reaction under condition (c) and was used in experiments with human plasma samples.
Protocol T[3 + 4] involved two sequential pretreatment reactions. The first reaction is 10 U T4 PNK 3′ minus, 10 U T4 RNA ligase 1, 10 U T4 RNA ligase 2, 20 U Murine RNase Inhibitor, 1 mM ATP, 10% PEG8000, and 1× T4 PNK reaction buffer pH 7.6 (all NEB), incubated at 37°C for 1 h. The second reaction is 10 U T4 PNK (NEB), 20 U Murine RNase Inhibitor (NEB), 5 mM DTT (Thermo Fisher), 10 mM MgCl2, and 100 mM MES pH 6.0 (Thermo Fisher), incubated at 37°C for 30 min.
Protocol T[3] involved three sequential pretreatment reactions. The first reaction is 1 U Terminator 5′-Phosphate-Dependent Exonuclease (LCG Biosearch Technologies), 1× Terminator reaction buffer A (LCG Biosearch Technologies), and 10 U RNase Inhibitor (NEB), incubated at 37°C for 1 h. This reaction was terminated by adding 1 µL of 100 mM EDTA pH 8.0 with a final reaction concentration of 5 mM EDTA. The second reaction is 10 U T4 PNK 3′ minus, 10 U T4 RNA ligase 1, 10 U T4 RNA ligase 2, 20 U Murine RNase Inhibitor, 1 mM ATP, 10% PEG8000, and 1× T4 PNK reaction buffer pH 7.6 (all NEB), incubated at 37°C for 1 h. The third reaction is 10 U T4 PNK (NEB), 20 U Murine RNase Inhibitor (NEB), 5 mM DTT (Thermo Fisher), 10 mM MgCl2, and 100 mM MES pH 6.0 (Thermo Fisher), incubated at 37°C for 30 min.
Protocol T[4] consisted of three sequential pretreatment reactions. The first reaction is 30 pmol RtcB, 20 U Murine RNase Inhibitor, 100 µM GTP, 1 mM MnCl2, 10% PEG8000, and 1× RtcB Reaction Buffer (all NEB), incubated at 37°C for 1 h as previously described (Chakravarty et al. 2012; Petkovic and Müller 2015). The second reaction is 10 U T4 PNK 3′ minus, 10 U T4 RNA ligase 1, 10 U T4 RNA ligase 2, 20 U Murine RNase Inhibitor, 1 mM ATP, 10% PEG8000, and 1× T4 PNK reaction buffer pH 7.6 (all NEB), incubated at 37°C for 1 h. The third reaction is 10 U T4 PNK (NEB), 20 U Murine RNase Inhibitor (NEB), 5 mM DTT (Thermo Fisher), 10 mM MgCl2, and 100 mM MES pH 6.0 (Thermo Fisher), incubated at 37°C for 30 min.
After each step of enzymatic pretreatments of the input RNA, the reactions were stopped by immediately processing the pretreated RNA through RNA Clean and Concentrator Kit columns (Zymo Research). The column-washing protocol was modified to retain sRNAs of ≥15 nt in length. Briefly, 20 µL pretreatment reactions were mixed with 40 µL binding buffer. The resultant 60 µL mix was then mixed with 150 µL 95% ethanol. The final mix was applied to the column and washed according to the manufacturer's instructions. All pretreated RNA was eluted into 6 µL nuclease-free water and used as input for the next pretreatment reaction or directly into the sequencing library preparation as described below.
Library preparation and sequencing
All enzymatically pretreated RNA samples were prepared for sequencing using universal library preparation protocol T[1 + 2], which was also applied to input RNA samples that had not been enzymatically pretreated. Protocol T[1 + 2] was a modified version of commercially available RealSeq-Biofluids protocol, which is based on the original RealSeq-AC method for preparation of small RNA sequencing libraries (Barberán-Soler et al. 2018). The protocol T[1 + 2] workflow is schematically shown in Supplemental Figure S1 and includes the following modifications to the RealSeq-Biofluids protocol: (i) adding 100 µM ATP to the adapter blocking reaction of step 2; (ii) decreasing the concentration of ATP from 1 mM to 100 µM during circularization step 3; and (iii) decreasing the concentration of additionally added dNTPs in PCR step 6 from 3 to 1.2 mM. The RNA inputs for protocol T[1 + 2] were either (i) 16 pmol of stsRNAs (for mock controls); (ii) 50 ng of human brain total RNA with 16 pmol of stsRNAs; (iii) RNA volume equivalent to 83 µL of human plasma with 16 pmol of the stsRNAs; or (iv) 6 µL of pretreated RNA sample with an initial pretreatment input as in (i), (ii), and (iii). For all library preparations, technical triplicate libraries were made with the brain RNA, while the RNA from the three individuals of a single cohort of plasma samples was considered biological replicates. The exception is the C1 plasma sample, which was available in a large enough volume to be used as technical triplicates, and is not in a cohort with plasma from other individuals.
Phospho-RNA-seq libraries were prepared with the sRNA input of the extracted total RNA volume equivalent to 83 µL of human plasma with 16 pmol of the stsRNA pool. The RNA was pretreated in a reaction of 10 U T4 PNK, 20 U Murine RNase Inhibitor, 1 mM ATP, and 1× T4 PNK reaction buffer pH 7.6 (all NEB), incubated at 37°C for 30 min. Following the pretreatment incubation, the reactions were stopped by immediately processing the pretreated RNA using RNA Clean and Concentrator Kit columns (Zymo Research). Similar to RiboMarker protocol T[1 + 2 + 3 + 4], the column-washing protocol was modified to retain sRNAs of ≥15 nt in length. The pretreated RNA was eluted into 6 µL nuclease-free water and used as input directly into the NEBNext Small RNA Library Prep Set for Illumina (NEB). The libraries were prepared according to the manufacturer's protocol through PCR amplification. To more accurately compare phospho-RNA-seq and RiboMarker prepared libraries, 50 µL of the phospho-RNA-seq PCR reaction was cleaned up following the same SPRI bead size selection protocol used in RiboMarker protocol T[1 + 2].
During the preparation of sequencing libraries, PCR was performed with indexed primers to enable identification of reads unique to each sample during multiplex sequencing. The libraries were analyzed with an Agilent D1000 ScreenTape on a 4150 TapeStation instrument (Agilent) and then quantified with the TapeStation and the Qubit dsDNA BR Assay Kit (Thermo Fisher Scientific). Libraries were pooled and then sequenced in multiplex using the Singular Genomics G4 as 130 bp single-end runs, aiming for 10 million reads per library.
Computational methods
stsRNA quantification
To robustly assess the efficiency of capture of differentially processed naturally occurring sRNAs based on end chemistries and fragment length, we used 20 unique synthetic RNAs (stsRNAs), which were described above. For each of the four different stsRNA Types 1–4 (Fig. 1), a unique RNA Type–specific barcode was encoded in the internal part of the sequence (Table 2) to distinguish between the different Types during mapping. Mapping to these sequences was done after adapter trimming using bowtie2 (Martin 2011) [‐‐no-1mm-upfront ‐‐mp 6 ‐‐rdg 6,3 ‐‐rfg 6,3 ‐‐norc ‐‐n-ceil L,5,0.15 -k 1 -D 20 -R 2 -N 0 -L 10 -i S,1,0.40 ‐‐score-min L,0,-0.6 ‐‐np 1] to account for the 4 nt randomized ends, internal type-specific barcodes, and differing stsRNA lengths. A custom Python script was used to parse the alignments for each sample and quantify individual stsRNAs based on these mappings.
Read processing and feature counting
All sequencing libraries were subsampled to the maximum number of reads available based on the sample with the fewest number of reads to accurately compare samples within an experiment. Sequencing reads were trimmed of the adapter sequence using cutadapt (Martin 2011) and then further filtered to remove any reads <15 nt in length. Reads were then sequentially aligned using either bowtie or bowtie2 (Langmead and Salzberg 2012) to vector contaminants (UniVec), rRNAs, tRNAs (with the addition of the -CCA tail) identified using tRNAScan-SE (Chan et al. 2021), miRNAs from miRBase (Kozomara et al. 2019), snRNAs/snoRNAs from Ensembl (Dyer et al. 2025), piRNAs from piRBase (Wang et al. 2022), processed mRNA transcripts including 5′UTR, CDS, and 3′UTR (mRNA/protein_coding) from Ensembl (Dyer et al. 2025), and lastly to the genome. Reads associated with these features were then quantified using a custom Python script, choosing the feature annotation with the largest degree of overlap. Multimapping ncRNA reads with more than one highest-scoring alignment were randomly selected, while multimapping mRNA reads were not included in the downstream analysis. For tRNA, snRNA, and snoRNA mapping reads, a read was assigned as either a “5p,” “3p,” or an “internal” feature based on where it mapped in the parent transcript. For “5p” features, it must map within 10 nt of the 5′ end, “3p” features must map within 10 nt of the 3′ end, and an “internal” feature does not map within 10 nt of either the 5′ or 3′ end of the parent transcript. The resulting raw read counts underwent normalization and differential expression analysis using DESeq2 (Love et al. 2014). Visualizations were generated using custom Python scripts. Raw FASTQ files are available on the NCBI Sequence Read Archive database under bioproject accession: PRJNA1348206.
stsRNA and natural RNA read length profiles
The proportion (P) of a given stsRNA Type, or RNA class (T) (for natural RNAs, excluding unmapped reads), at a specified read length (L) was calculated by dividing its raw read count (CT,L) by the total number of reads across all classes and lengths for its respective category (i.e., all stsRNA or all naturally
occurring RNAs). This is shown by the following equation:

Consensus read mapping profiles
The distribution of read coverage across transcript bodies was calculated from the 5′-end transcript start to the 3′ transcript end by first generating a vector of read coverage at each position in a given RNA transcript. To normalize for different transcript lengths, each coverage vector was partitioned into 100 equal-sized bins, and the total counts within each bin were summed. These 100-point vectors were then aggregated by summing them for all transcripts within a given RNA class (e.g., tRNA, snRNA) for each sample. To create a final profile for each experimental protocol, these aggregated vectors were averaged across all biological replicates. For visualization, the resulting average profiles were min–max scaled to a range of [0,1] to emphasize the shape of the read distribution.
SUPPLEMENTAL MATERIAL
Supplemental material is available for this article.
ACKNOWLEDGMENTS
We thank Dr. Denise McGrath for helpful discussions, comments, and technical editing of the manuscript. This work was supported in part by National Institutes of Health (NIH) grants 1R43HG013284-01 and 2R44HG013284-02A1 to S.A.K.
Footnotes
-
Article is online at http://www.rnajournal.org/cgi/doi/10.1261/rna.080861.125.
-
Freely available online through the RNA Open Access option.
- Received November 12, 2025.
- Accepted March 5, 2026.
This article, published in RNA, is available under a Creative Commons License (Attribution-NonCommercial 4.0 International), as described at http://creativecommons.org/licenses/by-nc/4.0/.
REFERENCES
MEET THE FIRST AUTHORS


Meet the First Author(s) is an editorial feature within RNA, in which the first author(s) of research-based papers in each issue have the opportunity to introduce themselves and their work to readers of RNA and the RNA research community. Rachel C. Clark and Aidan C. Manning are co-first authors of this paper, “A method of comprehensive sequencing analysis of the small RNA fragmentome (RiboMarker).” Rachel is a Senior Scientist at RealSeq Biosciences, where she carries out the research and development of new small RNA and RNA fragmentome sequencing library preparation methods. She completed her PhD with Dr. Alexandra Worden at the University of California, Santa Cruz. Aidan is a Bioinformatics Scientist at RealSeq Biosciences, where he specializes in small and fragmented RNA biology. He is dedicated to bridging the gap between complex RNA research and practical clinical applications, leveraging these molecules to improve patient diagnostics and outcomes.
What are the major results described in your paper, and how do they impact this branch of the field?
RCC: This manuscript describes the RNA fragmentome RiboMarker sequencing platform, a library preparation method that applies distinct enzymatic pretreatments to RNA samples to either detect all or enrich for specific small RNAs and RNA fragments based on their combination of 5′- and 3′-end states. Sequencing analysis of these RNAs representing the entire RNA fragmentome has the potential capability to both identify and detect with enhanced sensitivity low abundance small RNAs and RNA fragments.
ACM: The RiboMarker technology revealed that RNA fragments found in human plasma contain RNA molecules having different RNA ends (RNA types) mapped to different portions of the transcripts representing each main RNA class (like tRNA, mRNA, etc.). We demonstrated that selecting and using RNA fragments of specific RNA type(s) can enhance the sensitivity of detecting rare transcripts and distinguishing between plasma RNA samples from different individuals. This technology offers a foundation to advance customizable RNA fragmentomics, empowering the search for novel RNA biomarkers.
What led you to study RNA or this aspect of RNA science?
RCC: I am interested in the potential for cell-free RNA as that can provide higher sensitivity and specificity for disease detection than cell-free DNA from liquid biopsies.
ACM: This work builds on the small RNA sequencing methods I studied during my graduate career. We are just beginning to better understand the complex regulatory mechanisms of fragmented RNA biology. While diagnostics currently focus heavily on DNA-based methods, RNA provides a novel vector that could meaningfully impact human health.
During the course of these experiments, were there any surprising results or particular difficulties that altered your thinking and subsequent focus?
RCC: Testing and optimizing many different enzymatic pretreatment reactions of the RNA led to several unexpected biochemical reactions. One of these surprising results includes the T4 RNA ligase reverse reaction that we discuss in this manuscript. Our sequencing data were able to confirm that RNA ligase 1, which circularizes RNA with 5′-P and 3′-OH ends, also removes single mononucleotide diphosphates from the 3′-end phosphorylated RNAs, making the sequencing reads 1 nt shorter. This led us to add RNA ligase 2 to the reaction, where these side products were less evident.
What are some of the landmark moments that provoked your interest in science or your development as a scientist?
RCC: My development as a scientist has been heavily influenced by all the scientists I have interned for, worked with, and studied under throughout my scientific career. I have learned different approaches to research and been able to adapt what works best for me during collaborations.
ACM: An impactful moment for me was my first tRNA conference, where I presented my graduate work and won an award for best poster presentation. Getting to interact with so many scientists made me feel like I was truly a part of the scientific community. This experience gave me confidence in my work and drove me to keep pushing the boundaries of RNA biology.
Are there specific individuals or groups who have influenced your philosophy or approach to science?
ACM: I've been fortunate to learn from incredible mentors at every stage of my career. Working with Heather Hundley as an undergraduate first drew me into RNA biology and was my first foray into bioinformatics. I later joined Todd Lowe's lab for my graduate work, where I focused on small RNA biology within interdisciplinary experimental and computational teams and learned to be an independent researcher. My time at RealSeq Biosciences rounded out this experience, showing me how to translate those complex biological nuances into real-world sequencing diagnostics and computational tools.
What are your subsequent near- or long-term career plans?
ACM: Throughout my scientific career, I've always been driven by the idea that my work would be able to make a meaningful impact on human health. Currently, I help develop diagnostic tools to better identify cancer early and ensure patients are provided the treatment most likely to improve their outcome. I look forward to continuing on this journey and seeing what the future of this field has to offer.
What were the strongest aspects of your collaboration as co-first authors?
RCC: The strongest aspect of our collaboration was how well our different areas of expertise complemented each other to progress our study and method development and how easily we worked together.
ACM: Rachel was an excellent co-first author. Her organization and ability to drive the experimental side of the project in the laboratory was a huge asset, as it allowed me to focus my efforts on the downstream data analysis and deriving meaningful insights from the data.




